


Abstract
Solar-induced chlorophyll fluorescence (SIF) provides an opportunity to rapidly and non-destructively investigate how plants respond to stress. Here, we explored the potential of SIF to detect the effects of elevated O3 on soybean in the field where soybean was subjected to ambient and elevated O3 throughout the growing season in 2021. Exposure to elevated O3 resulted in a significant decrease in canopy SIF at 760 nm (SIF760), with a larger decrease in the late growing season (36%) compared with the middle growing season (13%). Elevated O3 significantly decreased the fraction of absorbed photosynthetically active radiation by 8–15% in the middle growing season and by 35% in the late growing stage. SIF760 escape ratio (fesc) was significantly increased under elevated O3 by 5–12% in the late growth stage due to a decrease of leaf chlorophyll content and leaf area index. Fluorescence yield of the canopy was reduced by 5–11% in the late growing season depending on the fesc estimation method, during which leaf maximum carboxylation rate and maximum electron transport were significantly reduced by 29% and 20% under elevated O3. These results demonstrated that SIF could capture the elevated O3 effect on canopy structure and acceleration of senescence in soybean and provide empirical support for using SIF for soybean stress detection and phenotyping.
Introduction
Tropospheric ozone (O3) is a damaging air pollutant and greenhouse gas contributing to global warming (Ainsworth et al., 2012; Gaudel et al., 2018; Lefohn et al., 2018; Wedow et al., 2021). The formation of tropospheric O3 is mostly from chemical reactions of O3 precursors, including nitrogen oxides (NOx), methane (CH4), and volatile organic compounds (VOCs), with a minor contribution from stratospheric influx (Stevenson et al., 2006; Audran et al., 2018). The removal of O3 from the atmosphere includes chemical destruction and dry deposition to land surfaces (Fowler et al., 2001; Cieslik, 2004; Schultz et al., 2017). Surface O3 concentrations have increased by more than 2-fold since the industrial revolution due to anthropogenic emissions (Monks et al., 2015), with the current highest O3 concentrations found in East Asia, south-central Asia, central Africa, and western North America (Montes et al., 2022). The overlap of regions of high O3 pollution with important global croplands results in a significant negative impact on crop productivity (Mills et al., 2018; Tai et al., 2021).
O3 is widely recognized to reduce crop yield by negatively impacting leaf photosynthetic rate, stomatal conductance, leaf area, crop growth, and crop development (Ainsworth et al., 2012; Ainsworth, 2017; Montes et al., 2022). O3 damages crops by penetrating the leaf mainly through stomata and thereafter reacts rapidly with a wide range of potential molecules in the apoplast to produce other reactive oxygen species, which subsequently accelerate senescence and, at high concentration, can cause programmed cell death (Fiscus et al., 2005; Ainsworth, 2017). Extensive manipulative experiments have been developed to investigate the impacts of elevated O3 concentrations ([O3]) on crops over the last two decades, including use of growth chambers, open top chambers, and O3 free air concentration enrichment (O3-FACE) experiments (Lewin et al., 1994; Morgan et al., 2003; Feng et al., 2018; Montes et al., 2022). Leaf photosynthesis, stomatal conductance, leaf area index (LAI), plant height, stem diameter, aboveground biomass, seed quality, and seed quantity have been widely measured in these manipulative experiments to understand the effects of elevated O3 on the physiological and structural properties of crops across various species and different varieties within the same species (Morgan et al., 2006; Betzelberger et al., 2012; Choquette et al., 2019; Li et al., 2022).
Solar-induced chlorophyll fluorescence (SIF) provides a new opportunity to rapidly and non-invasively quantify physiological and structural properties that are important to crop productivity. SIF is an optical signal emitted by plants in the spectrum range of 650–850 nm after absorbing sunlight in competition with photochemistry and heat dissipation (Porcar-Castell et al., 2014, 2021; Frankenberg and Berry, 2018). It is functionally linked with photosynthesis and has been widely used over the last decade to study the dynamics of vegetation at the leaf, canopy, and regional levels, including quantification of canopy photosynthesis (e.g. Guanter et al., 2014; Zhang et al., 2020; Li and Xiao, 2022) and plant stress detection (e.g. Sun et al., 2015; Song et al., 2018; Helm et al., 2020; Marrs et al., 2020). Following the light use efficiency framework originally proposed for gross primary production (Monteith, 1972), canopy SIF can be decomposed into radiation, canopy structural, and physiological components (Frankenberg and Berry, 2018), as shown in the following equation:
where PAR represents photosynthetically active radiation, which is the radiation component of SIF; FPAR represents the fraction of absorbed PAR of the canopy; fesc is the escape probability of SIF photons from the canopy, and the product of FPAR and fesc provides information on canopy structure such as LAI and leaf orientation (Zeng et al., 2019); ΦF,canopy is the physiological SIF emission yield of all leaves in the canopy, which represents the physiological component of canopy SIF (Dechant et al., 2020). The product of fesc and ΦF,canopy is the apparent canopy SIF yield (SIFy). Recently, ΦF,canopy has been used to capture the physiological responses of crops to high temperatures (Kimm et al., 2021a) and water deficit (Kimm et al., 2021b). However, whether canopy SIF can detect the effects of elevated O3 on crop structure and function is not studied yet. Addressing this gap is crucial for large-scale assessment of O3 effects on ecosystems considering the availability of SIF data at regional and global scales (Frankenberg et al., 2011; Sun et al., 2017; Köhler et al., 2018).
In this study, we aim to determine whether canopy SIF captures the effects of elevated O3 on the structural and physiological properties of soybean. Soybean canopies were exposed to elevated O3 treatment in an open-field setting using FACE technology at the Soybean Free Air Gas Concentration Enrichment (SoyFACE) experiment facility in Champaign, IL, USA. Plant responses to O3 treatment at SoyFACE have been well characterized since 2002; therefore, this facility provides a unique opportunity to determine the sensitivity of canopy SIF to the physiological and structural effects of O3 on an intact soybean canopy. Previous studies have found that soybean LAI is significantly decreased in elevated O3 (Morgan et al., 2006; Gray et al., 2010), leaf photosynthetic traits such as carboxylation capacity (Vcmax) and maximum electron transport (Jmax) are reduced during the late reproductive stages in older leaves (Morgan et al., 2004), and O3 accelerated the rate of senescence in soybean (Dermody et al., 2008). Therefore, we hypothesize that: (i) elevated O3 decreases canopy SIF with a larger decrease in the late reproductive stage; and (ii) structural components FPAR and fesc are significantly decreased in elevated O3 throughout the whole growing season while physiological component ΦF,canopy would only decrease at the late reproductive stage. We collected canopy SIF data using a portable spectroscopic system as well as auxiliary canopy and leaf-level measurements at SoyFACE in 2021 to test these hypotheses.
Materials and methods
Site description and experiment setup
This study was conducted in 2021 at the SoyFACE facility in Savoy, Illinois (40°03ʹ21.3″ N, 88°12ʹ3.4″ W, 230 m elevation; https://soyface.illinois.edu/), managed by the University of Illinois at Urbana-Champaign and the Agricultural Research Service (ARS) of the United States Department of Agriculture (USDA). Within the SoyFACE facility, four pairs of 20 m diameter octagonal plots, with each pair containing one ambient O3 and one elevated O3 plot, were nested within a 16 ha soybean field. The four pairs were arranged in a randomized complete block design (n=4) to account for soil and topographic variations across the field (Fig. 1). The distance between plots was at least 100 m to avoid cross-contamination. The ambient O3 concentration was around 30–50 ppb, and the target elevated O3 concentration was 100 ppb between 09.00 h and 17.00 h CST (Supplementary Fig. S1). Mean elevated O3 concentrations were within 20% of the 100 ppb target concentration for 84% of the time based on 1 min average data (Kole Aspray et al., 2023). Each elevated O3 plot contained horizontal pipes that release O3 through 300 μm pores at a supersonic velocity at ~10 cm above the soybean canopy (Miglietta et al., 2001). Maturity group III soybean seeds were planted on 6 May 2021 at 38 cm row spacing within each ambient and elevated plot. Fumigation was initiated on 1 June 2021 and ended on 20 September 2021 (Kole Aspray et al., 2023). The leaf-level and canopy-level measurements were started in late July when the canopy was closed. In this study, we classified the period spanning from the end of July to early August as the middle growing season, while late August through early September was designated as the late growing stage for soybean.
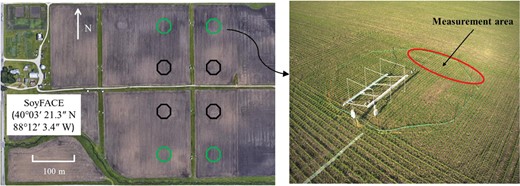
Experimental setup and the image of an elevated O3 plot at the SoyFACE facility. Soybean was grown at 100 ppb O3 in the elevated O3 plots. Green octagons represent elevated O3 plots and black octagons represent ambient O3 plots. A retractable awning is located inside the plot and is released to capture rainfall. Measurements in this study were conducted at the open area inside the ring indicated by the red circle.
Canopy spectral measurement
A portable spectroscopic system was used to conduct the canopy spectral measurements (Kimm et al., 2021a). The system consists of two spectrometers, one a QEPRO spectrometer with a wavelength range from 730 to 780 nm at 0.15 nm spectral resolution (Ocean Optics Inc., FL, USA), and the other an HR2000+ spectrometer (Ocean Optics Inc.) with a wavelength range from 350 to 1100 nm at 1.10 nm spectral resolution (Miao et al., 2018; Yang et al., 2018). The QEPRO spectrometer collected spectrum data for SIF retrieval, while data collected by the HR2000+ spectrometer were used for estimation of vegetation indices. Each spectrometer was connected to a bare fiber with a field of view (FOV) of 25° (Ocean Optics) to collect the downwelling irradiance from the sky and upwelling radiance from the canopy. To simplify the system configuration, the downwelling irradiance was measured by pointing the bare fiber at the middle of a level standard reflection board (Spectralon®; Labsphere Inc., NH, USA) with a distance of ~5 cm to ensure that the light from the canopy did not contribute to the incident light reflected from the board (Supplementary Fig. S2). The reflection board has nearly 100% reflectivity (98.6% at ~760 nm). Upwelling radiance was measured by pointing the bare fiber at the target canopy at the nadir view. The spectrometers were in a backpack with the temperature controlled to ~25–27 °C and relative humidity under 75% using ice packs and silica gel bags. The spectral radiance of the spectrometers was calibrated by a calibrated spectrometer before the measurements. Our collected downwelling irradiance and upwelling radiance showed the expected spectrum of solar irradiance and canopy radiance, which further demonstrated the reliability of the portable spectroscopic system (Supplementary Fig. S3).
A total of 20 spectral measurements were collected in each plot across the measurement area (~3 m diameter, Fig. 1) within 8 min on sunny days. Measurements of all plots were conducted between 11.00 h and 12.30 h to minimize the temporal variation. Each measurement included one downwelling irradiance and upwelling radiance spectrum collection by pointing the bare fiber at the reflection board and the canopy target, respectively. The integration time was manually set to ensure the maximum digital number (DN) was around 120 000 for the QEPRO and around 12 000 for the HR2000+ spectrometer. The narrow measurement time window and consistent sky conditions during measurements enabled us to use the same integrating time across the whole measurement period for each day and collect reliable DN values. The dark current of the HR2000+ was measured before and after data collection in each plot by covering the light inlet of the fiber, while the QEPRO’s dark current was collected for each measurement by closing its internal shutter. The spectral measurements were conducted on 26 July, 10 August, and 1 September (day of year 207, 222, and 244, respectively) in the 2021 growing season.
Canopy structural parameters measurement
Total intercepted PAR by both green and yellow canopy leaves (FPARtotal) was measured at each plot with an AccuPAR LP-80 Ceptometer (Decagon Devices, Inc., Pullman, WA, USA) after the canopy spectral measurements. A total of eight samples were collected at each plot within 3 min. For each sample, a sequence of incoming PAR from the sun (PARin), reflected PAR from the canopy and soil (PARout), transmitted PAR through the canopy (PARtrans), and PAR reflected by the soil (PARsoil) were measured. PARin and PARout were measured by placing the sensor above the canopy and looking up and down, respectively, and PARtrans and PARsoil were measured by placing the sensor below the canopy and pointing up and down, respectively. A level bubble was used to ensure the level of the sensor and shadows were avoided on the sensor. FPARtotal at each plot was calculated as the average of eight samples of PARin, PARout, PARtrans, and PARsoil measured by the AccuPAR LP-80 Ceptometer as follows:
Total canopy LAI in each plot was measured by a plant canopy analyser (LAI-2200; LI-COR Biosciences, NE, USA). On 27 July 2021, LAI was measured after 17.00 h to allow for diffuse light during the measurements. Measurements were conducted at two 1 m row sections in each plot. At each section, one measurement was made above the canopy, and two measurements were made below the canopy. LAI was calculated using the entire hemispherical view, and a view cap was used to exclude the operator from measurements. On 11 August and 1 September 2021, LAI measurements were conducted at noon under the sunny sky conditions. Scattering corrections were conducted by FV2200 software.
Canopy spectral data analysis
The improved fraunhofer line depth (iFLD) method was used to retrieve SIF at 760 nm (SIF760) from the spectral data collected by the QEPRO spectrometer. Compared with other FLD-based methods, which only use two or three bands, iFLD utilizes the whole irradiance (E) and radiance (L) to account for the non-linear variation of fluorescence and reflectance over the O2A absorption window (Alonso et al., 2008; Cendrero-Mateo et al., 2019). For each plot, the average of 20 E and L samples was used to retrieve SIF as follows:
where E(λin), E(λout), L(λin) and L(λout) were the solar irradiance inside and outside the absorption window and canopy radiance inside and outside the absorption window, respectively. αR and αF were the correction factors to account for the non-linear change of reflectance (R) and fluorescence (F), respectively, and they were estimated from E and the apparent reflectance calculated from E and L. SIF760 was calculated by setting λin as 760 nm. Detailed information about the selection of λout as well as the absorption windows, can be found in Cendrero-Mateo et al. (2019).
Since yellow leaves do not conduct photosynthesis nor emit fluorescence, the decomposition of observed SIF into PAR, FPAR, fesc, and ΦF,canopy should only focus on green leaves rather than the whole canopy. Incident PAR at the SIF measurement time was estimated by integrating the solar irradiance from 400 to 700 nm collected by the HR2000+. FPAR of the green leaves (FPARgreen) at each plot was estimated by red edge normalized difference vegetation index (Rededge NDVI) (Viña and Gitelson, 2005; Miao et al., 2018):
Rededge NDVI was calculated from the HR2000+ reflectance:
where R750 and R705 refer to the reflectance at 750 nm and 705 nm, respectively.
Two methods were used to estimate fesc. The first one was based on near-infrared reflectance of the canopy (NIRv) proposed by Zeng et al. (2019), hereafter referred as fesc_NIRv:
NIRv was estimated from the reflectance measured by HR2000+ as follows (Badgley et al., 2017):
where R770–780 and R650–660 edge refer to reflectance in bands of 650–660 nm and 770–780 nm, respectively. The other method was based on the fluorescence correction vegetation index (FCVI) (Yang et al., 2020; Siegmann et al., 2021), hereafter referred as fesc_FCVI:
where FCVI was calculated as follows:
where is the broadband visible directional reflectance covering the spectral range from 400 to 700 nm.
Apparent SIF yield (SIFy) was calculated from observed SIF760 and absorbed PAR of green leaves:
ΦF,canopy was calculated as:
ΦF,canopy_NIRv and ΦF,canopy_FCVI refer to ΦF,canopy calculated by fesc_NIRv and fesc_FCVI, respectively.
The total SIF emitted by all leaves in the canopy (SIFtotal) was calculated from the observed top of canopy SIF760 and fesc:
SIFtotal_NIRv and SIFtotal_FCVI refer to SIFtotal calculated by fesc_NIRv and fesc_FCVI, respectively.
Auxiliary leaf-level measurements
Leaf chlorophyll content (ChlLeaf) was measured by a Soil Plant Analysis Development (SPAD) chlorophyll meter. Leaf-level steady fluorescence (FS) and light-adapted apparent quantum efficiency of PSII (ΦPSII) were measured under ambient PAR conditions by an LI-600 fluorometer/porometer (LI-COR Biosciences). Leaf orientation was not altered during measurements. A rectangular flash mode with an intensity of 10 000 µmol m−2 s−1 and length of 800 ms was used to estimate FS and ΦPSII for light-adapted leaves. Ambient PAR at each leaf was recorded by a quantum sensor on the LI-600. A total of 8–10 mature leaves at the top of the canopy were measured at each plot in the measurement area shown in Fig. 1. Those measurements were conducted between 14.30 h and 16.00 h on 10 August and 1 September 2021.
CO2 response curves were conducted on three leaves to obtain leaf-level photosynthetic capacity using an open gas exchange system (LI-6800, LI-COR Biosciences). Three fully expanded leaves at the top of the canopy that were experiencing full sunlight were randomly selected at each plot. The petioles were cut under water between 05.30 h and 06.30 h, and the petioles of the excised leaves were placed in deionized water throughout the duration of the measurements. This ensured that the leaves were not stressed and the maximum potential capacity of the tissues was measured (Ainsworth et al., 2004). Leaves were placed in the dark, and ~15 min before measurement, leaves were acclimated to high light conditions outside the gas exchange chamber. Thereafter leaves were placed in the chamber at a saturating light of 1800 μmol m−2 s−1, a CO2 concentration of 400 μmol mol−1, relative humidity of 70%, and leaf temperature of 25 °C for 15–20 min to reach steady-state photosynthesis. The used saturating light intensity would not damage the sampled leaves since at our study site, PAR exceeds 1800 umol m−2 s−1 (Rogers et al., 2004; Miao et al., 2018). CO2 concentration in the cuvette was subsequently changed in the following order: 400, 300, 200, 100, 75, 50, 25, 400, 600, 800, 1000, 1200, 1500, and 2000 μmol mol−1. Leaf assimilation rate (A) and intercellular CO2 concentration (Ci) were recorded at each CO2 concentration point after the steady state was reached. The 14 data points of A and Ci were fitted to the biochemical model of photosynthesis (Farquhar et al., 1980) to solve for maximum Rubisco carboxylation rate at 25 °C (Vcmax25) and maximum electron transport capacity at 25 °C (Jmax25) following Long and Bernacchi (2003). A–Ci curves were measured on 21 July and 25 August (day of year 202 and 237, respectively) in 2021.
Statistical analysis
For all parameter comparisons, repeated measures analysis of variance (ANOVA) was used to test for O3 treatment effects. Analyses were performed on the plot means. Day of year (DOY) and treatment were fixed effects, and blocks were included as a random factor. All comparisons were made between elevated O3 treatment and ambient O3 control. To avoid type II errors, significant differences from the control were defined as P<0.05. A priori pairwise linear comparisons were made between treatments within days (α=0.05).
Results
Canopy-level response to elevated O3
Canopy SIF760 was significantly decreased under elevated O3 for both middle (DOY 207 and 222) and late growth stages (DOY 244), with the greatest decrease shown in the late growth stage (Fig. 2; Table 1). Specifically, SIF760 decreased by 13% on DOY 207 and 222, and 36% on DOY 244. Based on Equation 1, this decrease in SIF760 was caused by the decrease in FPARgreen, since PAR and SIFy were similar between ambient and elevated O3 treatments (Table 1). FPARgreen decreased by 8%, 15%, and 35% on DOY 207, 222, and 244, respectively. Regarding the seasonal variations, canopy SIF760 and FPARgreen showed the highest values on DOY 207, followed by DOY 222, with the lowest values shown on DOY 244, while SIFy did not show an apparent seasonal variation. These differences of SIF760 and FPARgreen between treatments were significant between dates (Table 1). For SIF760, the decrease from DOY 207 to DOY 222 was similar between ambient (9%) and elevated (9%) O3 plots. However, the decrease from DOY 222 to DOY 244 was larger at elevated O3 plots (35%) compared with ambient O3 plots (15%). FPARgreen decreased by 17% from DOY 207 to DOY 222 for ambient plots, and by 37% for elevated O3 plots, which is consistent with acceleration of soybean senescence in elevated O3.
Analysis of variance of fixed effects on canopy-level variables from field-grown soybean in ambient and elevated O3
| O3 | Day of year | O3 by day of year | ||||
|---|---|---|---|---|---|---|
| F | P | F | P | F | P | |
| SIF760 | 3287.80 | <0.0001 | 44.88 | 0.0002 | 12.07 | 0.0079 |
| PAR | 0.01 | 0.9863 | 3.51 | 0.0977 | 1.11 | 0.3902 |
| FPARgreen | 93.72 | 0.0023 | 49.50 | 0.0002 | 11.64 | 0.0086 |
| SIFy | 0.42 | 0.5651 | 1.17 | 0.3716 | 0.76 | 0.5087 |
| NIRv | 216.78 | 0.0007 | 70.83 | 0.0014 | 3.38 | 0.1041 |
| FCVI | 225.27 | 0.0006 | 69.04 | <0.0001 | 2.75 | 0.1420 |
| fesc_NIRv | 1.54 | 0.3046 | 1.77 | 0.2485 | 10.85 | 0.0102 |
| fesc_FCVI | 1.16 | 0.3611 | 3.92 | 0.0813 | 18.08 | 0.0029 |
| ΦF,canopy_NIRv | 0.55 | 0.5130 | 2.72 | 0.1446 | 2.32 | 0.1789 |
| ΦF,canopy_FCVI | 3.89 | 0.1432 | 4.84 | 0.0560 | 9.41 | 0.0141 |
| SIFtotal_NIRv | 109.22 | 0.0019 | 39.08 | 0.0003 | 29.63 | 0.0008 |
| SIFtotal_FCVI | 112.04 | 0.0018 | 38.88 | 0.0004 | 25.90 | 0.0011F |
| FPARtotal | 59.56 | 0.0045 | 37.19 | 0.0004 | 20.07 | 0.0022 |
| LAI | 51.36 | 0.0056 | 308.48 | <0.0001 | 0.28 | 0.7649 |
The F-statistic and associated P-values were calculated from a mixed model of a repeated measure analysis in a randomized complete block design (n=4).
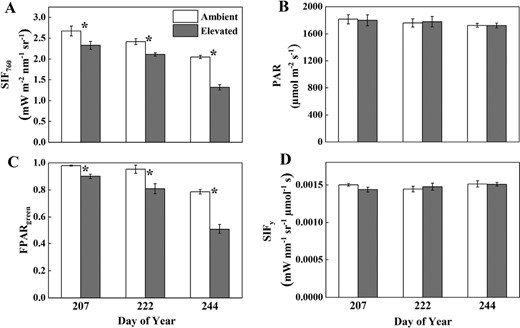
Observed top of canopy SIF760 (A), PAR (B), FPARgreen (C), and apparent SIFy (D) measured throughout the growing season in soybean grown in ambient O3 (white bars) and elevated O3 (grey bars). Each bar represents the least squared mean, and the error bars are ±SE of the difference in least square means. The measurement date is indicated on the x-axis as day of year (DOY). *Significant differences between treatments at each measuring date (P<0.05).
fesc, ΦF,canopy, and SIFtotal estimated from both NIRv and FCVI showed similar responses to elevated O3 between middle and late growth stages due to the similar responses of NIRv and FCVI to elevated O3 (Figs 3, 4; Table 1). On DOY 207, 222, and 244, NIRv was significantly reduced by 15%, 16%, and 32%, respectively, and FCVI was significantly reduced by 14%, 15%, and 28%, respectively. Elevated O3 decreased both fesc_NIRv (7%) and fesc_FCVI (7%) on DOY 207 but significantly increased fesc on DOY 244 (5% for fesc_NIRv and 12% for fesc_FCVI). ΦF,canopy_NIRv and ΦF,canopy_FCVI were not significantly different between treatments in the middle growing season (DOY 207 and 222) with slightly higher values shown under elevated O3. In the late growth stage (DOY 244), ΦF,canopy_NIRv decreased by 5% under elevated O3, though not significantly, and ΦF,canopy_FCVI significantly decreased by 11% under elevated O3. Canopy SIFtotal_NIRv and SIFtotal_FCVI significantly decreased under elevated O3 across both middle and late growth stages, with a larger decrease shown at the late growth stage. Specifically, on DOY 207, 222, and 244, SIFtotal_NIRv decreased by 6%, 12%, and 38%, and SIFtotal_FCVI decreased by 6%, 13%, and 42%, respectively.
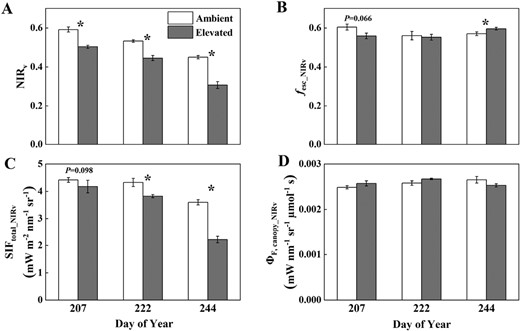
Canopy NIRv (A), fesc_NIRv (B), SIFtotal_NIRv (C), and ΦF,canopy_NIRv (D) measured or estimated throughout the growing season in soybean grown in ambient O3 (white bars) and elevated O3 (grey bars). Each bar represents the least squared mean, and the error bars are ±SE of the difference in least square means. The date of measurement is indicated on the x-axis as day of year (DOY). *Significant differences between treatments at each measuring date (P<0.05).
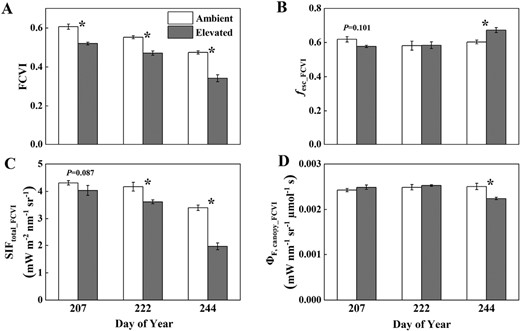
Canopy FCVI (A), fesc_FCVI (B), SIFtotal_FCVI (C), and ΦF,canopy_FCVI (D) measured or estimated throughout the growing season in soybean grown in ambient O3 (white bars) and elevated O3 (grey bars). Each bar represents the least squared mean, and the error bars are ±SE of the difference in least square means. The date of measurement is indicated on the x-axis as day of year (DOY). *Significant differences between treatments at each measuring date (P<0.05).
Measured FPARtotal showed a similar response to elevated O3 as estimated FPARgreen, but with a smaller magnitude change. FPARtotal decreased by 2%, 3%, and 21% on DOY 207, 222, and 244, respectively. Consistent with the canopy SIF760 and FPARtotal, exposure to elevated O3 significantly decreased LAI in both middle and late growth stages, with a large decrease at the late growth stage (Fig. 5; Table 1). Specifically, LAI decreased by 18%, 19%, and 41% on DOY 208, 222, and 244, respectively. For the seasonal variation, consistent with SIF760 and FPARgreen, NIRv, FCVI, SIFtotal, FPARtotal, and LAI showed the highest values on DOY 207 and then decreased on DOY 222 with the lowest values on DOY 244. From DOY 222 to DOY 244, the decrease in FPARtotal, and LAI was larger in elevated O3 plots than that in ambient O3 plots. Specifically, FPARtotal and LAI decreased by 24% and 59% in elevated O3 plots, but by 7% and 43% in ambient O3 plots, respectively.

Canopy FPARtotal (A) and LAI (B) measured throughout the growing season in soybean grown in ambient O3 (white bars) and elevated O3 (grey bars). Each bar represents the least squared mean, and the error bars are ±SE of the difference in least square means. The date of measurement is indicated on the x-axis as day of year (DOY). *Significant differences between treatments at each measuring date (P<0.05).
Leaf-level response to elevated O3
SPAD ChlLeaf was significantly reduced under elevated O3 with a larger decrease observed late in the season (7% on DOY 222 and 27% on DOY 244) (Fig. 6). ChlLeaf was significantly lower on DOY 244 compared with DOY 222 for both ambient and elevated O3, but the decrease from DOY 222 to DOY 244 was larger in elevated O3 (27%) compared with ambient O3 (7%). For the leaf-level FS (which can be regarded as leaf-level fluorescence yield) and light-adapted ΦPSII under ambient PAR conditions, elevated O3 did not significantly affect FS and ΦPSII in the middle growing season (DOY 222) (Fig. 6; Table 2). However, elevated O3 decreased FS and ΦPSII by 17% and 12% on DOY 244, but not significantly. ΦPSII was significantly lower on DOY 244 compared with DOY 222 for both ambient and elevated O3 plots (Table 2). Vcmax25 and Jmax25 showed similar patterns to ΦF,canopy_NIRv and ΦF,canopy_FCVI (Fig. 7), with slightly higher values under elevated O3 in the middle growing season (DOY 202) and significant reductions only apparent at the late growth stage (DOY 237, 29% reduction in Vcmax25 and 20% reduction in Jmax25). From DOY 202 to DOY 237, Vcmax25 decreased by 39% under elevated O3 but increased by 10% under ambient conditions. Similarly, Jmax25 decreased by 11% under elevated O3 but increased by 34% under ambient O3. While the interactions between O3 and DOY were only marginally significant, the results suggested that the physiological response of soybean to O3 was intensified at the late growth stage.
Analysis of variance of fixed effects on leaf-level variables from field-grown soybean in ambient and elevated O3
| O3 | Day of year | O3 by day of year | ||||
|---|---|---|---|---|---|---|
| F | P | F | P | F | P | |
| ChlLeaf | 50.11 | 0.0058 | 65.65 | 0.0039 | 55.25 | 0.0050 |
| PARLeaf | 0.24 | 0.6605 | 0.50 | 0.5313 | 0.21 | 0.6782 |
| FS | 2.89 | 0.1876 | 0.28 | 0.6311 | 3.60 | 0.1541 |
| ΦPSII | 1.66 | 0.2874 | 51.96 | 0.0055 | 0.90 | 0.4118 |
| Vcmax25 | 0.06 | 0.8283 | 4.32 | 0.1292 | 6.90 | 0.0785 |
| Jmax25 | 1.77 | 0.2750 | 1.34 | 0.3310 | 4.15 | 0.1344 |
The F-statistic and associated P-values were calculated from a mixed model of a repeated measure analysis in a randomized complete block design (n=4).
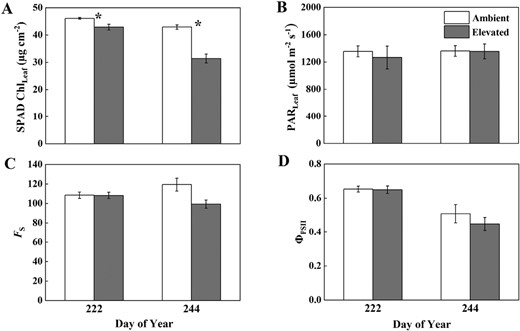
ChlLeaf (A), ambient PAR (B), FS (C), and ΦPSII (D) measured on 10 August and 1 September 2021, in soybean grown in ambient O3 (white bars) and elevated O3 (grey bars). Each bar represents the least squared mean, and the error bars are ±SE of the difference in least square means. The date of measurement is indicated on the x-axis as day of year (DOY). *Significant differences between treatments at each measuring date (P<0.05).
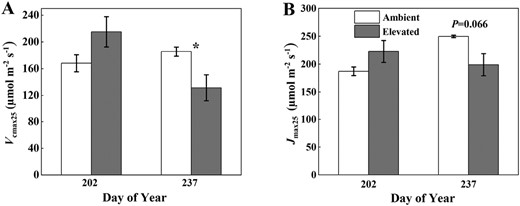
Leaf Vcmax25 (A), Jmax25 (B) on 21 July and 25 August 2021, in soybean grown in ambient O3 (white bars) and elevated O3 (grey bars). Each bar represents the least squared mean, and the error bars are ±SE of the difference in least square means. The date of measurement is indicated on the x-axis as day of year (DOY). *Significant differences between treatments at each measuring date (P<0.05).
Discussion
To our knowledge, this is the first study to investigate the capability of canopy SIF760 to track the effects of elevated O3 on soybean in the field. Consistent with our hypotheses, top-of-canopy (TOC) SIF760 significantly decreased under elevated O3, with a larger decrease observed later in the season. FPARgreen showed the same response to elevated O3 as SIF760, whereas fesc increased under elevated O3 at the late growth stage. The physiological component ΦF,canopy was not significantly affected by elevated O3 in the middle growing season, but it showed a reduction at the late growth stage. The behavior of FPAR was consistent with LAI, and the trend of ΦF,canopy was mostly consistent with leaf-level steady-state fluorescence FS, Vcmax25, and Jmax25, but showed much less variation and smaller sensitivity to elevated O3, indicating that TOC SIF760 integrates both the structural and physiological effects of elevated O3 on soybean.
The effect of elevated O3 on soybean canopy structure has been well studied in previous work (e.g. Dermody et al., 2006; Morgan et al., 2006; Betzelberger et al., 2010; Oikawa and Ainsworth, 2016). A decrease in LAI and leaf area duration is a consistent feature of soybean exposed to elevated O3 from these studies. When grown at elevated O3 conditions, leaves progressively decrease photosynthetic capacity and senesce more quickly, limiting new leaf development (Morgan et al., 2003). Older leaves may not be able to maintain a positive carbon balance, which further leads to the acceleration of senescence and LAI reduction (Miller et al., 1998). In our study, the larger decrease of SIF760, FPARgreen, FPARtotal and LAI at the late growth stage than in middle growing stages was consistent with the acceleration of senescence under elevated O3. The larger decrease in FPARgreen compared with FPARtotal to elevated O3 further indicated that more yellow leaves were developed in the elevated O3 plots compared with ambient plots. We found a 41% decrease in LAI under elevated O3 on DOY 244, which is consistent with the previous study in which LAI decreased by 40% near the end of the growing season at SoyFACE (Dermody et al., 2006). FPARgreen is determined by LAI and ChlLeaf (Viña and Gitelson, 2005) (Viña and Gitelson, 2005); therefore, similar behaviors of FPARgreen and LAI are expected. The structural vegetation index NIRv also significantly decreased under elevated O3 with a 32% decrease at the late growth stage, indicating that NIRv is more sensitive to elevated O3 compared with other vegetation indices such as NDVI, near-infrared/red (NIR/red) (Gray et al., 2010). fesc quantifies the portion of SIF photons escaping from the canopy due to scattering and reabsorption, and it is strongly affected by LAI and ChlLeaf (Yang and van der Tol, 2018). Consistent with previous studies, soybean ChlLeaf significantly decreased with exposure to elevated O3 (Ainsworth et al., 2014). This decrease in LAI and ChlLeaf causes an increase in fesc under elevated O3 at the late growth stage. Overall, TOC SIF760 and its structural component FPARgreen as well as NIRv captured the reduction of LAI and acceleration of senescence of soybean when it was exposed to elevated O3.
The negative impact of elevated O3 on leaf photosynthetic capacity is another important factor causing soybean yield loss under elevated O3 (Morgan et al., 2003, 2006; Ainsworth et al., 2012; Betzelberger et al., 2012). Previous studies have shown that the impact of elevated O3 on crop physiological processes becomes more pronounced as the growing season progresses, with a larger decline in leaf photosynthesis in the late reproductive stage compared with earlier stages (Morgan et al., 2003; Fiscus et al., 2005; Feng et al., 2008; Ainsworth, 2017). This can possibly be attributed to several factors: (i) Rubisco synthesis in newly formed upper canopy leaves may not be significantly affected during the vegetative stage, but it could be affected during the late reproductive stage; (ii) leaves that develop during the early to middle growth stages may not accumulate enough damage to trigger a response, while leaves developed during the late reproductive stages experience prolonged exposure to elevated O3; and (iii) Susceptibility to elevated O3 increases during the late reproductive stage. Morgan et al. (2004) have demonstrated that elevated O3 does not significantly alter soybean Vcmax25 and Jmax25 for young leaves developed during vegetative growth. However, during the late reproductive stage, these values decrease by 20–30%, with Vcmax25 showing a larger decrease compared with Jmax25. This is consistent with our results that no significant differences between Vcmax25 and Jmax25 were shown in the middle growing season on DOY 202 between ambient and elevated O3, but Vcmax25 decreased by 29%, and Jmax25 decreased by 20% under elevated O3 at the late growth stage on DOY 237. The stronger sensitivity of Vcmax25 to elevated O3 compared with Jmax25 in the late growth stage supports the hypothesis that Rubsico activity is one of the most vulnerable parts of the photosynthetic apparatus to elevated O3 (Long and Naidu, 2002).
ΦF,canopy is dependent on the absorbed energy partitioning among photochemistry, fluorescence, and non-photochemical quenching in the light reactions of photosynthesis and is more directly linked to Jmax compared with Vcmax (Porcar-Castell et al., 2021). Therefore, smaller sensitivity of ΦF,canopy to elevated O3 compared with Vcmax is expected. The uncertainty of the fesc calculation additionally contributes to the sensitivity of ΦF,canopy to O3 stress (Meroni et al., 2009; Dechant et al., 2020). ΦF,canopy estimated from FCVI-based fesc exhibited a significant 11% reduction during the late growth stage under elevated O3, whereas ΦF,canopy estimated from NIRv-based fesc showed a non-significant 5% reduction (Figs 3, 4). This difference in response between the two approaches can be attributed to the considerable uncertainty in fesc estimation during the late growth stage when the soil’s contribution to near-infrared reflectance of vegetation becomes more prominent compared with the middle growing season (Zeng et al., 2019; Yang et al., 2020). Both approaches were unable to provide a satisfactory estimation of fesc over sparse canopies (e.g. LAI<1) (Zeng et al., 2019; Yang et al., 2020). In our study, the LAI during the late growth stage under elevated O3 is approximately 2, which is above the practical threshold for using NIRv and FCVI to estimate fesc. However, it is important to note that the relative error in fesc estimation remains substantial compared with the middle growing season when LAI is ≥5. A newly developed framework for estimating the true NIR reflectance of vegetation from hyperspectral measurements (NIRvH), with minimal soil impact, holds the potential to further enhance fesc and ΦF,canopy estimation during the late growth stage (Zeng et al., 2021). Nevertheless, the decline of ΦF,canopy under elevated O3 at the late growth stage is consistent between the two approaches. A previous study reported that ΦF,canopy was more sensitive to the physiological response of plants to temperature stress than vegetation indices (Kimm et al., 2021a). This was because Jmax25 significantly decreased with increasing canopy temperature later in soybean growth, while Vcmax25 showed no trend with an increase in canopy temperature (Kumagai et al., 2022). Strong responses of ΦF,canopy to abiotic stress would be expected if the stressor strongly damages the photochemical reactions of photosynthesis.
We acknowledge that there are three main sources of uncertainty in this study. First, ozone absorption of solar radiation might affect the SIF retrieval. However, here we focused on far-red SIF at 760 nm where the ozone absorption is at least one order of magnitude smaller than that of UV and visible bands (Chou and Lee, 1996; Gorshelev et al., 2014). The QEPRO spectrometer would not be able to detect the ozone absorption effect. Second, the measurement dates of canopy-level and leaf-level measurements were not perfectly matched. While leaf-level measurements were collected on DOY 202 (or 222) and 244, canopy-level measurements were made on DOY 207, 222, and 244. Within the context of this investigation, our primary focus pertained to the comparative analysis of two distinct growth phases: the middle growth stage (DOY 202–222) and the subsequent late growth stage (DOY 244). While variables associated with canopy structure information (FPARgreen and fesc) showed different responses to elevated O3 between DOY 207 and DOY 222 (Figs 2–4), the physiological variable ΦF,canopy, which more closely aligns with leaf-level measurements, displayed similar responses to elevated O3 on both measurement dates in the middle growing season (Figs 3, 4). Consequently, we do not anticipate significant disparities in the response to elevated O3 between DOY 207 and DOY 222 from the leaf-level measurements and the absence of one-time leaf-level measurement in the middle growing season should not exert a substantial impact on the overarching conclusions drawn from this study. Third, the fesc calculation still has large uncertainty. In this study, we tried two commonly used methods, NIRv (Zeng et al., 2019) and FCVI (Yang et al., 2020), to estimate fesc and related ΦF,canopy and SIFtotal. Although the two methods showed different sensitivities to elevated O3 at the later growth stage, their trend to elevated O3 was consistent between the two methods. Therefore, we concluded that these uncertainties did not affect the general conclusions we draw here.
The capability of SIF to track elevated O3 stress provides a rapid and non-destructive way to monitor vegetation dynamics and has the potential for applications at many spatial scales, including site, regional, and global scales (Mohammed et al., 2019). Recently, fine-resolution surface O3 datasets have been produced through the advancement of models, machine learning, and data fusion (Delang et al., 2021; Sun et al., 2022). Combining SIF with high-resolution surface O3 datasets is beneficial for advancing the understanding of O3 impact on vegetation through (i) increasing the coverage of different vegetation types in different regions rather than being limited to the species and regions with O3-FACE experiments (Montes et al., 2022); (ii) improving our understanding of the interactions between elevated O3 and other climate factors such as drought, heat, and rising CO2 (Pollastrini et al., 2014; Hansen et al., 2019; Pellegrini et al., 2019; Ainsworth and Long, 2021); and (iii) advancing the understanding of long-term and gradually increasing surface O3 impact on vegetation (Silva and Pires, 2022). Additionally, the capability of SIF to rapidly survey large populations can be combined with other techniques to select crop genotypes with high O3 tolerance (Wang et al., 2014; Choquette et al., 2019; Begum et al., 2020).
Conclusions
We investigated whether canopy SIF could capture the effects of soybean growth in elevated O3 concentrations (100 ppb) at the SoyFACE facility. We found that TOC SIF760 and structural variables (FPAR, NIRv, and LAI) were significantly decreased under elevated O3. Elevated O3 additionally accelerated senescence, indicated by the larger decrease of TOC SIF760, FPAR, NIRv, and LAI from DOY 222 to DOY 244 under elevated O3 compared with ambient O3. Elevated O3 did not significantly affect ΦF,canopy, Vcmax25, and Jmax25 in the middle growing season, but at the late reproductive stage Vcmax25 and Jmax25 were significantly reduced by 29% and 20% under elevated O3. ΦF,canopy showed much less variation and sensitivity to elevated O3 compared with other variables. It decreased by 5–11% at the late reproductive stage depending on the method used for fesc. These results demonstrate that canopy SIF can track the elevated O3 effect on canopy structure and acceleration of senescence. Combining SIF with surface O3 data could potentially advance our understanding of O3 impact on different vegetation types under various climate conditions.
Supplementary data
The following supplementary data are available at JXB online.
Fig. S1. Daylight hourly mean [O3] for ambient and elevated [O3] treatments.
Fig. S2. Photo of field measurement using the portable spectroscopy system.
Fig. S3. Example spectrums of solar irradiance and canopy radiance collected from HR2000+ and QEPRO spectrometers of the spectroscopic system from ambient and elevated ozone plot.
Acknowledgements
We thank Jesse McGrath for operating the fumigation at SoyFACE and helping maintain the facility. We thank M. Pilar Cendrero-Mateo for sharing the iFLD code for SIF retrieval.
Author contributions
GW, KJ, and EA conceptualized the study. GW, DM, and HK performed data acquisition. XY helped with the design of the spectroscopic system. EA and DM designed and maintained the elevated O3 experiment. GW with the help from EA performed data analysis. GW prepared the initial draft of the manuscript while all the authors contributed to the final version of the manuscript. KG and EA supervised the work and arranged the funds.
Conflict of interest
The authors declare they have no conflict of interest.
Funding
The work was supported by Future Investigators in NASA Earth and Space Science and Technology (FINESST) program (80NSSC20K1660) and United States Department of Agriculture (USDA) National Institute of Food and Agriculture (NIFA) Foundational Program award (2022-68013-37052, 2018-68002-27961). EAA acknowledges the USDA Agricultural Research Service (ARS) for support. Any opinions, findings, and conclusions or recommendations expressed in this publication are those of the author(s) and do not necessarily reflect the views of the U.S. Department of Agriculture. Mention of trade names or commercial products in this publication is solely for the purpose of providing specific information and does not imply recommendation or endorsement by the U.S. Department of Agriculture.
Data availability
The data supporting the findings of this study are available upon reasonable request from the corresponding authors, KG and EAA.

Comments