


Abstract
Crop yield must increase to keep pace with growing global demand. Past increases in crop production have rarely been attributable to an individual innovation but have occurred when technologies and practices combine to form improved farming systems. Inevitably this has involved synergy between genotypic and management improvements. We argue that research focused on developing synergistic systems that overcome clear production constraints will accelerate increases in yield. This offers the opportunity to better focus and multiply the impact of discipline-focused research. Here we use the rainfed grain production systems of south-eastern Australia as a case study of how transformational change in water productivity can be achieved with research focused on genotype × management synergies. In this region, rainfall is low and variable and has declined since 1990. Despite this, growers have maintained yields by implementing synergistic systems combining innovations in (i) soil water conservation, (ii) crop diversity, (iii) earlier sowing, and (iv) matching nitrogen fertilizer to water-limited demand. Further increases are emerging from synergies between genetic improvements to deliver flowering time stability, adjusted sowing times, and potential dual-purpose use. Collaboration between agronomists, physiologists, and crop breeders has led to development of commercial genotypes with stable flowering time that are in early phases of testing and adoption.
Introduction
The staple grain crops wheat, maize, and rice provide the world’s population with two-thirds of metabolic energy requirement, either through direct consumption or indirectly through animal feed (Fischer et al., 2014). The need to sustainably intensify and increase yield of these crops to meet growing demand from world population growth and higher per capita consumption has been clearly articulated by many authors (Fischer and Connor, 2018). The goal of sustainable intensification is to keep staple food supply matched to demand so that prices remain affordable for all the citizens of the world, without increasing agriculture’s broad footprint on the planet’s natural ecosystems. The consequences of demand outstripping staple food supply have been clearly seen in periods of civil unrest during 2007–2008 and the Arab Spring uprisings—both partly attributed to staple food price spikes (FAO et al., 2017). The consequences of increased production at the cost of either further land clearance or intensification with offsite environmental impacts are equally troubling (Yu et al., 2019; Almeida de Souza et al., 2020). With the spectre of civil unrest attached to rises in food price, the world’s farmers are locked into a pattern of declining terms of trade, and they in turn must continue to decrease their costs of production (cost per saleable unit of food produced) to remain profitable. Increasing crop yield without a commensurate increase in input costs has historically been a major pathway to reduce cost of production and will likely be in the future.
The challenge for the world’s farmers and the agricultural researchers that support them is clear—increase crop yield without a commensurate increase in input costs or off-site environmental impacts. Until 1960, increases in global crop production have been attributable to an equal increase in cropped area (Evans, 1998). The increases in staple crop yield seen during the Green Revolution were the first instance where increased production was attributable to an increase in yield rather than cropped area (Evans, 1998). The improvements achieved during this time are rightly seen as being transformational. The challenge before farmers and researchers is to orchestrate a second Green Revolution, without the same level of offsite environmental impacts.
In current research settings, proposed transformational change often focuses on one component of a production system, with each change championed by largely disconnected research disciplines (Sadras et al., 2020). In reality, and throughout history, few individual technologies have been singularly transformational either in the scale or the speed with which they have influenced productivity. Rather, step changes in productivity have come only when combinations of technologies, often a mix of old and new, synergize within a system (Evans, 1998; Kirkegaard and Hunt, 2010). The Green Revolution itself provides a clear example of this; the lodging resistance conferred by semi-dwarf cereal cultivars allowed for an unprecedented increase in use of nitrogen fertilizer and development of irrigation schemes that in combination delivered yield increases (Evans, 1998). Semi-dwarf cultivars themselves were facilitated by the advent of selective herbicides, which lessened the need for the competitive growth habits of tall cultivars (Evans, 1998). It was thus the synergistic combination of genetic technology (semi-dwarf) and management technologies (herbicides, nitrogen fertilizer) and practices (irrigation) that delivered the yield increases of the Green Revolution. The improvement delivered by the sum of the parts was greater than the individual innovations could have delivered alone.
Here we argue that if future transformational change in crop yields on the scale of the Green Revolution are to be achieved, it would be best done by anticipating synergies in management and genetics that overcome clear constraints to production. This will only be achieved if researchers engage closely with farmers and their advisors to understand farming systems, identify constraints, quantify the benefits of overcoming them, and evaluate possible systems solutions, scaling up from in silico evaluation through small plot research experiments to farmers’ fields. Kirkegaard (2019) described this approach as ‘incremental transformation’ and argued that whilst much intellectual energy is wasted arguing about whether improvements in genetics or management have delivered the greatest increases in yield, the reality is that greater improvements can be achieved through synergy between the two. Success requires cross-functional research teams with expertise ranging from generalists with broad farming systems understanding to specialists with narrow discipline-focus. We refer to this research structure and process in crop production as ‘transformational agronomy’, and a more detailed description is provided in Hunt et al. (2019a). This approach satisfies the analysis of Passioura (2020) who argued that if scientific research is to translate into improved crop yields, then knowledge is required of the main features of increasingly higher levels of system organization from genes through cells and plants to the level of a crop. It also contrasts with the strong discipline-based focus that exists in many of our research institutions and funding bodies, which is then reflected in the narrow focus of research that is successfully funded (Bromham et al., 2016), and operation of peer review (Passioura, 2020).
To support our argument, we use the example of water productivity gains achieved in the semi-arid cropping regions of south-eastern Australia as a case study. Whilst not as vast in scope or profound in effect as the Green Revolution, recent increases in production achieved by Australian grain growers in the face of demonstrable climatic adversity have been impressive. Rainfall across the cropping regions declined nationally from 1990, and improvements have been seen as an increase in water productivity (grain produced per unit of rain received) rather than outright yield (grain produced per unit area of land; Hochman et al., 2017). Growers moved from achieving 39% of water-limited potential yield in 1990 to 55% of water-limited potential yield in 2015. Current estimates indicate 57% of water-limited potential yield was achieved in 2019 (Fig. 1), and improvements and a favourable season have helped deliver the largest ever national wheat harvest in 2020.
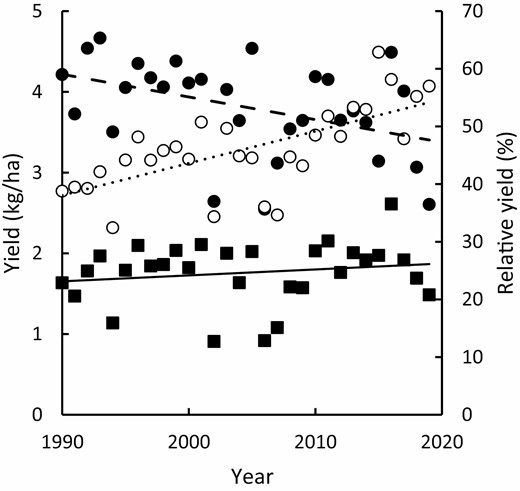
Actual Australian farm wheat yield (■; solid regression line is of form y=0.007x−12.953, R2=0.03), water limited potential yield derived from crop simulation (●, dashed regression line is of form y=−0.028x+60, R2=0.18) and relative yield, which is farm yield expressed as a percentage of water-limited potential yield (○, dotted dashed regression line is of form y=0.556x−1068, R2=0.45). See Hochman et al. (2017) for further details.
Throughout the period, Australian wheat breeders have consistently delivered genetic yield gains of 0.5% per annum expressed relative to contemporary cultivars (Sadras and Lawson, 2011; Kitonyo et al., 2017), although there is evidence that this may have slowed in some regions (Flohr et al., 2018b). Many of the management improvements that have delivered these increases in water productivity have been described in articles published in previous Interdrought special issues including Kirkegaard and Hunt (2010) and Kirkegaard et al. (2014). This article provides a summary and update of these factors and focuses on a deliberate research strategy to capture genotype × management (G×M) synergies to deliver future transformational improvements in farmers’ fields.
The south-eastern Australian environment
The south-eastern Australian cropping zone traverses the states of South Australia, Victoria and the southern half of New South Wales. Grain crops in this region are grown exclusively during the cool half of the year, which begins in April–May. This seasonality is dictated by a hot and relatively dry summer during which potential evapotranspiration greatly exceeds rainfall. Temperatures during the growing season (April to October) are relatively mild (July mean minimum temperature, 1–5 °C; mean maximum temperature, 13–18 °C), and precipitation generally exceeds potential evapotranspiration during the winter months of June, July and August. Annual rainfall varies between 280 and 750 mm (161 to 582 mm for April to October) across the cropping regions (Cann et al., 2020b), and seasonality ranges from strongly Mediterranean in South Australia to equi-seasonal in central New South Wales. Annual precipitation is highly variable compared with other grain producing regions globally and can vary by a factor of four at a single location. This variability generates significant genotype × environment interactions (Rattey and Shorter, 2010; Smith et al., 2015) that reduce selection gains from breeding activities. Almost all crops are rainfed and it is well described that the amount and distribution of rain that falls during the growing season is a strong determinant of farm yield (French and Schultz, 1984; Sadras and Angus, 2006), a resource that has declined by 12% since 1990 (Murphy and Timbal, 2008; Bureau of Meteorology and CSIRO, 2020). Much of the rainfall decline has occurred during the autumn months of April and May (Pook et al., 2009; Cai et al., 2012).
Crop sequences are dominated by wheat (Triticum aestivum), which typically occupies 50% of cropped area. Barley (Hordeum vulgare) and canola (Brassica napus) are next common followed by oats (Avena sativa) and grain legumes including chickpea (Cicer arietinum), lentil (Lens culinaris), lupin (Lupinus spp.), vetch (Vicia sativa), field pea (Pisum sativum), and faba bean (Vicia faba). Almost all crops have a ‘spring’ phenology pattern (i.e. no obligate vernalization requirement) but are sown in autumn and continue to grow and develop vegetatively during autumn and winter where they are resistant to occasional instances of low air temperature. Once crops become reproductive in late winter, they become susceptible to spring radiation frosts, which are common through most of the region and have increased in frequency and severity since the 1960s (Crimp et al., 2016a, b). Frequency of frosts declines during spring as the frequency of air temperatures high enough to reduce yield increases (Hunt et al., 2018).
An agronomically important feature of the region’s climate is the timing of the first rainfall event of the cropping season that is sufficient to allow germination and emergence of grain crops (Flohr et al., 2021). This rain event is referred to as the ‘autumn break’ and has been variously defined as either 25 mm of rainfall within a 3 d period or 30 mm over 7 d (Pook et al., 2009). A more mechanistic definition is provided by Unkovich (2010) who described it as the first week in autumn in which precipitation exceeds pan evaporation. Grain crops may be sown following these rains in late autumn or ‘dry sown’ prior to the autumn break to ensure timely establishment (Fletcher et al., 2015). Pook et al. (2009) demonstrated that the number of days from 1 March until an ‘ideal’ break occurs has increased by 6.3 per decade since the 1890s.
Evolution of farming systems
The evolution of farming systems in the south-eastern Australian cropping zone has been reviewed elsewhere (Kirkegaard et al., 2011; Kirkegaard, 2019), but a brief description up to the late 1990s provides context to the recent developments discussed in this paper. Most soils are either naturally deficient or depleted in the major crop nutrients phosphorous and nitrogen. Due to this and the extreme inter-annual rainfall variability, extensive agricultural production has involved significant attention to the management of business risk, especially with respect to expensive inputs such as fertilizer. The south-eastern zone includes areas in southern New South Wales, Victoria, and South Australia and covers a broad set of soil types (Isbell, 2002). These range from deep acidic loams and heavy clay vertisols in New South Wales and the Wimmera region of Victoria to shallower and lighter textured and highly variable alkaline soils of the Mallee dune-swale system in Victoria and South Australia.
Until the 1980s, the farming system was based largely on extensive dryland mixed livestock–cropping enterprises growing staple annual cereal crops, especially wheat and barley, and annual pastures supporting free-range sheep and cattle. The annual pastures were usually based on a legume, such as subterranean clover (Trifolium subterraneum) on acid soils or annual Medicago spp. on alkaline soils. Sequences of crops were generally grown in rotations with phases (2–5 years) of annual or perennial legume-based pastures (Puckridge and French, 1983). Long fallows (plant-free for ~9 months) were traditionally used in some semi-arid areas such as the Victorian Mallee to conserve water and N for the following crops (Cann et al., 2020a). Most of the cropped area was sown to wheat and other cereals, with full cultivation for weed control and seed-bed preparation and crop residues grazed and/or burnt for ease of sowing. Crops were regularly fertilized with phosphorous, but rarely nitrogen (Angus and Grace, 2017).
The emergence of no-till farming systems from the late 1970s onward was facilitated by a series of technical innovations including (i) the development of knock-down herbicides in the 1960s and 1970s and grass-selective herbicides in the 1980s, (ii) the development and adoption of broad-leaf break crops from the 1980s onward (see below), and (iii) grower-led adaptation of seeding equipment to facilitate successful establishment in uncultivated seedbeds with retained residues. These technical innovations, together with a downturn in livestock profitability during the 1990s following the collapse of the wool price (Bardsley, 1994), instigated an ongoing period of declining pasture area and sheep number, and increased farm size and cropping intensity (Fig. 2), with the cropping enterprise increasingly based on no-till, stubble-retained systems with broadleaf break crops.
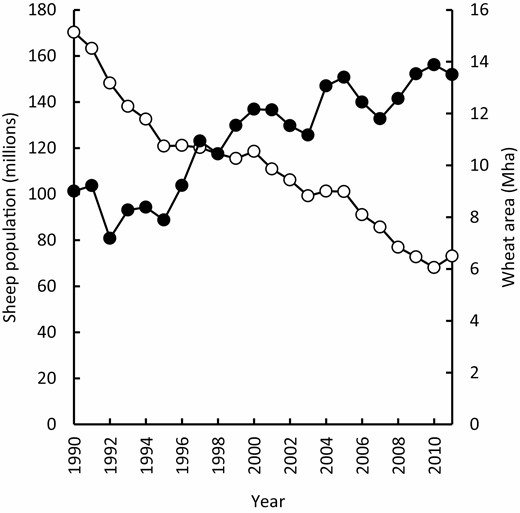
Sheep population (○) and area planted to wheat (●) in Australia from 1990 to 2011 (ABS, 2013).
The relative frequency of crops and pastures, and the rotations practiced, vary greatly between individual farms (Kirkegaard et al., 2011). The predominance of cereals across the cropping zone reflected their contribution to farm profits, low risk, and ease of marketing (Kirkegaard et al., 2011).
Individual innovations
The following innovations that have been developed and adopted over the past 30 years have collectively contributed to the increases in wheat water productivity seen over that time (Fig. 1; Hochman et al., 2017). Some, such as the introduction of canola and grain legume break crops, have been supported by very large public investments over several decades in research, development, and extension (Maaz et al., 2018). Others, such as much of the innovation in machinery, have been the result of grower-driven innovation (Desbiolles et al., 2019). These innovations interact synergistically with each other (Fig. 3), and with previous advances to deliver increases in water productivity that are greater than the sum of the individual parts (Kirkegaard and Hunt, 2010).
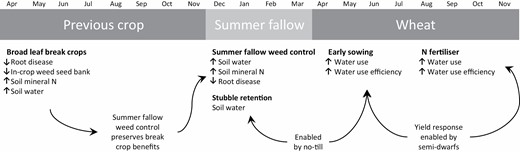
The individual innovations described are implemented in both pre-crop (previous crop and summer fallow) and in-crop periods and collectively increase resources available (soil water and N supply, crop water use) and efficiency of use (reduced root disease, improved water use efficiency). Long arrows indicate examples of positive interactions between current and previous (e.g. no-till, semi-dwarf cultivars) innovations.
Benchmarking water productivity
To achieve their yield potential, while decreasing their cost of production, growers need to know what yields are possible in their environment and what inputs are required to sustainably achieve these yields. A cornerstone of productivity advances in south-eastern Australia has been the practice of benchmarking water productivity and using this to improve agronomic management (Passioura and Angus, 2010). A focus on benchmarking water productivity rather than outright yield is a direct consequence of the highly variable rainfall. Initial efforts focused on empirical boundary relationships between rainfall or estimated evapotranspiration and crop yield (French and Schultz, 1984; Sadras and Angus, 2006). They were later moderated for other climatic and edaphic factors (Rodriguez and Sadras, 2007; Sadras and Rodriguez, 2007; Oliver et al., 2009) and updated to account for genetic improvement (Sadras and Lawson, 2013) along with more comprehensive data and by statistically fitting (non-linear) boundary functions at the 95th percentile to identify the maximum yield values attainable for given values of evapotranspiration and available N (Hochman and Waldner, 2020). In addition to empirical methods, crop simulation models (particularly APSIM; Holzworth et al., 2014) that integrate climate and soil as well as crop physiology and management have increasingly been used to establish water-limited potential yield benchmarks (Hochman et al., 2009, 2017; van Rees et al., 2014; Lawes et al., 2021). APSIM has also been extensively deployed to identify constraints and opportunities to increase water productivity and test possible solutions prior to field experimentation, as well as extrapolating results of field experiments to a wider range of sites and seasons (Hochman and Lilley, 2019).
Water-limited potential yield (Yw) is the benchmark for crop production capacity of rainfed crops. Since Yw is limited primarily by water supply, it is influenced by soil type (water holding capacity and rooting depth) and field topography (runoff). It is also determined by solar radiation, temperature, atmospheric CO2, and genetic traits that govern length of growing period, crop morphology, and photosynthetic features. Yw is calculated for optimum or recommended sowing dates, planting density, cultivar (including maturity class) and within the dominant cropping system. Actual yield (Ya) is defined as yield achieved by farmers. A robust estimate of Ya and Yw will need to cover sufficient years’ data to capture the variability in rainfall but not so long as to include significant technology and/or climate change trends. The yield gap (Yg) is the difference between Yw and Ya (van Ittersum et al., 2013). For the Australian cropping zone, Yw, Ya, and Yg have been determined at high resolution for all dominant soil types (Hochman et al., 2016). The Yield Gap Australia website (http://www.yieldgapaustralia.com.au) enables farmers to benchmark the performance of all major crops on their farm relative to both Yw and Ya in their local area and on their soil types.
A revelation of early benchmarking efforts was that many farmers’ crops were achieving yields well below water-limited potential, especially in higher rainfall years (French and Schultz, 1984; Cornish and Murray, 1989). It was only very good farmers whose yields were genuinely limited, contrary to the widely held perception that wheat yields were universally limited by water supply. This focused efforts to improve yield by achieving high water use efficiency (i.e. growing the highest yielding crop possible for the available water supply) rather than outright drought resistance.
Diversity of crops
Since 1990 farming practices have moved away from traditional mixed crop–livestock systems with long-term pastures to more intensive cropping (Kirkegaard et al., 2011). Whilst this initially led to an increase in wheat area (Fig. 2), growers rapidly found that continuous cereal production was not sustainable due to a rise in the prevalence of herbicide-resistant weed species (Angus et al., 2015) and decline in soil N reserves. Since that realization, the functional roles previously played by pastures and long fallows have been replaced by broadleaf break crops (Collins and Norton, 2019). Improvements in crop agronomy combined with substantial grower and public investment in genetic improvement as well as favourable market prices has supported this change (Maaz et al., 2018).
In particular, canola has become a significant part of farming systems in medium and higher rainfall areas of south-east Australia (Kirkegaard et al., 2016b). This was driven by genetic resistance to blackleg (Leptosphaeria maculans) and the incorporation of herbicide tolerance traits that allowed effective control of broadleaf weeds. Adoption was supported by a large publicly funded extension programme, and canola is now the third largest crop in south-eastern Australia by area (Fig. 4) behind wheat and barley (ABARES, 2018). Similarly, the area planted to high value pulses intended for human consumption, such as chickpea, faba bean and lentil, steadily increased after the end of the millennium drought in 2010 (ABARES, 2018). Growers have also been innovative in how they incorporate annual grain legume break crops into their farming systems to minimize production risks and maximize benefit to subsequent crops. This has included using grain legumes for hay production (Evans et al., 2003; Kirkegaard and Hunt, 2010; Browne et al., 2012; Swan et al., 2015), livestock grazing (Bell et al., 2017), cover cropping, and brown manure (Peoples et al., 2017; Armstrong et al., 2019) and intercropping systems (Fletcher et al., 2016b).
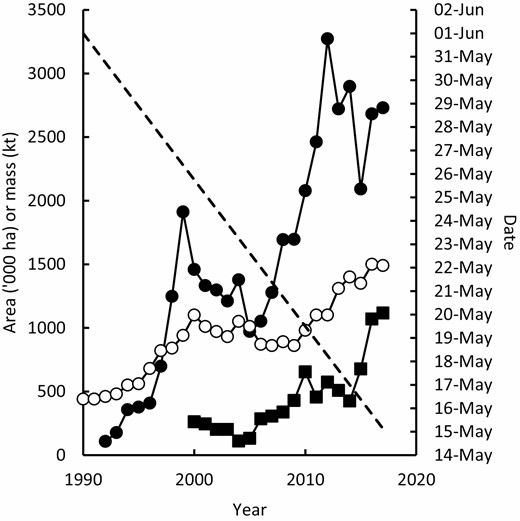
National area planted to the most widely grown break crops, canola (●), and chickpea (■) (from ABARES, 2018); linear trend in mean midpoint of sowing date (dashed line, Anderson et al., 2016); and annual national application of fertiliser N (○) (from fertilizer.org.au).
The decision to grow broad-leaf crops is often based on their benefits to the following cereal crops (e.g. weed and disease control, N contribution) rather than their profitability per se (Kirkegaard et al., 2008a; Robertson et al., 2010). Wheat crops grown after broadleaf break crops are consistently higher yielding than continuous wheat, with mean yield increases of 1.1–1.8 t ha−1 when grown following a legume and an additional 0.8 t ha−1 when grown after canola. Relative wheat yield increases are driven by impacts on disease cycles, soil nutrient (particularly N) supply and demand, soil structure, and water supply, and more recently by weed control and management of herbicide resistance risk (Bajwa, 2014). Whilst broadleaf break crops can be highly profitable, it is the combination of outright profitability and yield advantage conferred to subsequent cereal crops (and hence system profitability) that has continued to drive their adoption.
Increased adoption of break crop species has undoubtedly made an important contribution to the increases in water productivity of wheat observed since 1990. The change has been driven in equal measure by world market forces and improvements in genetic and management technologies. Use of break crops also interacts positively with all the individual innovations discussed in subsequent sections.
Water capture, storage, and use
The period between harvesting of one cool season crop and sowing of the next is known as the summer fallow. Rain that falls during this time is sporadic and unpredictable, and historically has not been valued by growers or researchers as a resource for crop production because it falls when there are no growing crops (French, 1978; Freebairn et al., 2006) and it was thought that soil water could not be stored without loss from evaporation during the hot and dry summer. Many Australian grain farms also have a livestock enterprise, and ephemeral summer-growing weeds and crop volunteers that germinate in response to summer fallow rain (Hunt et al., 2009) were commonly valued as a source of grazed forage (Fisher et al., 2012; Allan et al., 2016).
This thinking changed during the millennium drought period (1996–2009), when growing season rainfall was low and summer fallow rain increased as a proportion of annual rainfall (Hunt and Kirkegaard, 2011). As had long been known in the north of Australia and other parts of the world (Schillinger and Young, 2014), summer fallow rain that infiltrates below the surface layers of soil from which water can evaporate can be stored for many months and then used by crops in the subsequent growing season. The only threat to safe storage of this resource is summer growing weeds whose roots access deeper layers of soil and transpire water stored there (Fischer et al., 1990). Growers who conserved summer fallow rain by controlling summer fallow weeds were rewarded with substantial yield increases, and crop simulation predicted that approximately one-third of water-limited potential yield in south-east Australia was attributable to summer fallow rain (Hunt and Kirkegaard, 2011). A network of field experiments verified this possible yield gain as 32% (Kirkegaard et al., 2014). Experiments with a mechanistic focus revealed that yield gains from summer fallow weed control were not entirely due to water conservation, but that provision of additional soil mineral N was equally important (Hunt et al., 2013), reflecting the co-limitation imposed by water and N in semi-arid environments (Sadras et al., 2012).
Adoption of summer fallow weed control with herbicides such as glyphosate and 2,4-D has been widespread from the 2000s onward and is almost certainly a large contributor to the closing of the yield gap reported by Hochman et al. (2017). Whilst it is difficult to quantify the extent of practice change, some evidence is provided by the increasing frequency of extensive offsite herbicide damage to nearby irrigated summer crops due to growers spraying summer weeds during temperature inversions (Davies, 2018). This negative and unintended consequence has required changes to herbicide application legislation (Heard, 2018) and applicator training. Salinization of mid-slopes of sand dunes in Mallee regions is also a likely negative consequence (Oxborrow, 2017), and efforts are being made to rectify this by incorporating perennials and summer growing species in the landscape.
The benefits of retaining crop residues on preserving summer fallow rainfall in south-east Australia are less clear. Kirkegaard et al. (2014) report that of 29 field experiments that had retention versus removal of crop residue during the summer fallow period as a factor, 17 showed no significant effect of residue retention on crop yield, three showed a positive effect (mean 9%) and seven a negative effect (mean −12%). It was concluded that whilst residue cover had a strong effect on soil water infiltration (Hunt et al., 2016b), residues were less effective at slowing evaporation (Verburg et al., 2012). Yield benefits only ensued where summer fallow rain was intense, and residues improved infiltration and thus soil water storage. More detailed experiments determined that a threshold amount of residues were required to ensure rainfall infiltration, but beyond this there was little benefit (Hunt et al., 2016b). C rich residues also immobilized N (Nasrollahi et al., 2021), and removing some through grazing increased N uptake (Hunt et al., 2016a, b). Adoption of residue retention in the cropping zone is near complete (Llewellyn et al., 2012), primarily due to operational advantages of not having to remove stubble and/or cultivate, and the clear benefits in reduced wind and water erosion.
Strategic soil modification has shown great potential to improve capture and storage of rainfall in some areas. Physicochemical constraints such as water repellence, compaction, poor structure, and chemical imbalances are common across the grain growing regions of Australia and can severely limit crop production (Davies et al., 2019b). In many cases these problems are naturally occurring and are due to the inherent properties of the soil, but other issues such as compaction and non-wetting topsoils are exacerbated by agricultural practices. Strategies to ameliorate these constraints generally involve mechanical deep tillage, often with mixing or inversion of the profile and the incorporation of amendments such as gypsum, nutrients, or clay (Davies et al., 2019b). Although costly, strategic deep tillage for targeted amelioration has resulted in significant yield gains on water repellent surface soils (Davies et al., 2019a), compacted sandy soils (Hamza and Anderson, 2003), and poorly structured texture contrast soils (Hamilton et al., 2017) due to improvements in water infiltration, water holding capacity, and subsoil water access by plant roots. The responsiveness to, and longevity of, strategic deep tillage interventions vary considerably, but tend to be greatest on lighter-textured soils (Kirkegaard et al., 2008b; Davies et al., 2019b). Controlled traffic farming is thought to extend the longevity of any benefits derived and is increasingly practiced.
Aligning crop development with seasonal conditions
One of the basic tenets of crop adaptation and crop agronomy is the alignment of plant life cycle with seasonal conditions most conducive for growth. The physiological basis of this principle is now well understood. Grain yield is primarily determined by grain number (grains m−1) and annual grain crop species have a period within their life cycle during which growth rate (accumulation of dry matter) is highly related to grain number and thus yield (Sadras et al., 2019). Any form of stress during this period will reduce yield. This is referred to as the critical period, and this has been quantitatively determined for all grain crop species important in south-east Australia including wheat (Fischer, 1985), barley (Arisnabarreta and Miralles, 2008), oat (Mahadevan et al., 2016), canola (Kirkegaard et al., 2018), lupin, field pea (Sandaña and Calderini, 2012), and chickpea (Lake and Sadras, 2014). The timing of the critical period within the life cycle of different species varies (Sadras and Dreccer, 2015). In determinate cereals such as wheat and barley it occurs prior to anthesis (flowering) while for indeterminate dicots such as canola and grain legumes, it occurs shortly after flowering. In all cases, flowering is a useful indicator for the timing of the critical period, and is relatively easy for researchers, advisors, and growers to observe in the field.
All crop species have a range of tolerances to environmental conditions of temperature, solar radiation, and water availability. Temperature affects development (progression through crop lifecycle) and growth by governing rates of photosynthesis and respiration. Most cool season crops grow and develop most rapidly at 20–25 °C. However, rapid growth and development do not necessarily translate into optimal yield. Yield is determined by growth during the critical period. Rapid crop development through the critical period means that insufficient growth is accumulated, and yield potential is limited. Yield is maximized when air temperatures during the critical period are relatively low (~14 °C, Stapper and Fischer, 1990b) which slows development without overly compromising growth. The balance between rate of development (primarily a function of temperature) and growth (a function of radiation and radiation interception) is encapsulated in the concept of photothermal quotient (Fischer, 1985; Rawson, 1988).
In Mediterranean environments, temperature, radiation, and water supply change markedly throughout the year as seasons progress. This also means that there is usually a discrete period of the year when the growth rate for a crop species is maximized. The confluence of species-specific physiology with environmental patterns of radiation, temperature, and water supply determines the seasonal fit of different crop species within a given environment. This interaction is encapsulated in the concept of the optimal flowering period developed by Anderson et al. (1996) and later Flohr et al. (2017) in wheat and applied to canola by Lilley et al. (2019) and barley by Liu et al. (2020). Optimal flowering periods have been defined spatially by Chen et al. (2020).
The optimal flowering period is the period during which a crop must flower for grain yield to be maximized in the long-term. Optimal flowering periods are determined by seasonal patterns of water supply, temperature (average as well as lethal) and solar radiation. Whilst their precise timing does vary seasonally, it is consistent enough to be a useful concept for farm management. The optimal period represents the period of ‘least damage’ due to the abiotic factors of water stress, insufficient radiation, accelerated development, frost induced sterility, and heat shock. Biotic factors can be important as well, e.g. aerial blackleg in canola, which causes more severe yield loss in early-flowering crops (Sprague et al., 2017).
Optimal flowering periods can be experimentally defined using time of sowing × cultivar experiments that straddle the optimum period (Anderson et al., 1996) but crop simulation modelling is a far more cost effective and robust method to achieve this (Flohr et al., 2017). Comparisons of modelled and experimental optimal flowering windows give good agreement (Flohr et al., 2018c, 2020).
In southern Australia, optimal flowering periods have been a useful concept to allow growers to better align crop development to seasonal conditions. Timing of crop flowering is a function of genotype (development), environment (temperature, daylength), and management (sowing date), and optimal flowering periods can be used to look for combinations of G×M that ensure flowering coincides with favourable seasonal conditions for a given environment. Barriers to achieving optimal flowering periods are a classic constraint for transformational agronomy to overcome.
Many of the iconic advances in agronomic practice in southern Australia achieved yield increases by better aligning crop life cycle to seasonal conditions (Fig. 5). These include improved varietal adaptation, such as Federation wheat and the first semi-dwarfs with their shorter life cycle and higher yield potential (Pugsley, 1983) as well as improved farming systems, such as the adoption of no-till, which allowed earlier and faster sowing (Anderson and Smith, 1990; Stephens and Lyons, 1998; Anderson et al., 2016). Over the past 30 years, breeders have been progressively selecting for quicker developing cultivars (Eagles et al., 2009) and growers sowing progressively earlier (Fig. 4) (Flohr et al., 2018c). This has included a large increase in ‘dry’ sowing, the practice of sowing into dry soil prior to the season-breaking rain. This practice is only feasible in no-till systems (due to improved soil structure and seeding equipment) and has been very important to better match life cycle to seasonal conditions (Fletcher et al., 2015, 2016a, 2019).
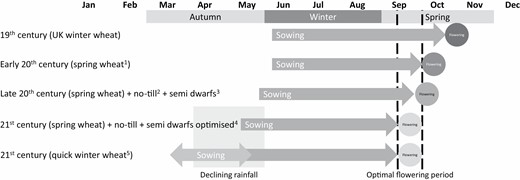
A schematic diagram illustrating how advances in agronomic practice (both management and genetic) have better aligned wheat crop development with seasonal conditions. aPugsley (1983); bStephens and Lyons (1998), cAnderson and Smith (1990); dFlohr et al. (2018c); eHunt et al. (2019b).
Given the large yield penalties incurred by delayed flowering in south-eastern Australia, the shift to earlier sowing has likely contributed substantially to the improvements in water productivity observed since 1990. However, based on sowing time data analysed by Flohr et al. (2018c), sowing time practised by growers is optimal for currently favoured spring cultivars, and it is unlikely that further gains will be achieved by moving sowing earlier, unless slower developing genotypes are available (Hunt, 2017) or if climate change related shifts in the OFP means earlier sowing better suits existing spring cultivars (Collins and Chenu, 2021).
This research approach taken in southern Australia, to define optimal flowering periods and search for G×M combinations to achieve them is applicable to other production systems with rapidly changing environmental conditions during critical periods globally (e.g. Ortiz-Monasterio et al., 1994; Cann et al., 2020b). However, it is important to note that not all environments have such strongly defined optimal flowering periods, which is peculiar to seasonal patterns in semi-arid Mediterranean climates and the concept may have less utility in temperate and tropical climates.
Increased applications of nitrogen fertilizer
From the 1950s to the 1990s, most grain crops were grown in rotation with legume-based pasture that supported the dominant wool-sheep enterprises. Nitrogen input from these pastures was roughly equivalent to export in grain, and as a result adoption of N fertilizer in Australian cropping systems was slower than it was in many other parts of the world (Angus and Peoples, 2012; Angus and Grace, 2017). As the area of legume-based pastures and the related N contribution declined, grain crop production became more reliant on inputs of fertilizer N (Angus and Grace, 2017), and usage increased substantially (Fig. 4). Crop N demand is a function of yield, and as yields have increased in response to genetic yield gain and the management innovations outlined above, then so too has crop N demand. Recent increases in water productivity have outstripped growers’ use of N fertilizer, to the point where N deficiency is the single biggest cause of the national yield gap (Hochman and Horan, 2018). This is in part due to variable rainfall, which makes matching N fertilizer inputs to crop N demand difficult. Complex decision support tools have been developed to assist growers in managing N inputs to seasonal demand, but even leading growers who use such tools suffer N deficiency in seasons of high yield potential (van Rees et al., 2014; Lawes et al., 2021). Simpler systems such as the N bank strategy have recently been tested and show promise to further close the yield gap, albeit at higher rates of fertilizer N than are currently applied (Smith et al., 2019; Meier et al., 2021). As rates of fertilizer N increase, environmental losses will likely also increase with potential to worsen the currently modest greenhouse footprint of grain production in the region (Schwenke et al., 2014; Mielenz et al., 2016). However, modelling suggests the increases in yield will offset increased losses such that N loss intensity (N pollution per tonne of grain) will remain stable (Mielenz et al., 2016; Simmons et al., 2020).
Early sowing systems—an opportunity to capture increases in water productivity from genotype × management synergies
The definition of optimal flowering periods described in the section ‘Aligning crop development with seasonal conditions’ clarified that growers were unable to achieve these with current cultivars for several reasons. Firstly, autumn rainfall had declined since 1990 meaning the chances of receiving rainfall sufficient to germinate seeds at the optimal time of establishment for spring cultivars had reduced. Currently favoured spring cultivars of wheat, barley, and canola must be sown within a 2-week period in autumn (~early May) to flower during the optimal period. Secondly, farm sizes have continued to increase in a search for economies of scale to offset declining terms of trade, and cropped area has increased as area of pastures has declined. Greater areas of crop per farm make achieving timely sowing across the farm difficult (Fletcher et al., 2016a).
These changes, and the realization that late summer rain had not declined, inspired a body of research into early sowing systems for wheat, canola, and barley. Late summer and early autumn rain (now valued and conserved with summer fallow management, see section ‘Water capture, storage, and use’) could be used opportunistically to establish crops prior to the traditional period to allow more cropped area to be sown on time. Access to slower developing (longer life cycle) cultivars and/or cultivars with stable flowering time was essential for success so that the earlier sown crops would flower during the optimal period in their environment.
Wheat
At the time research into early sowing systems for wheat commenced, the literature was divided as to whether longer life cycle wheat cultivars sown earlier yielded more or less than short cycle cultivars sown later. Penrose (1993) and Coventry et al. (1993) showed yield advantages using breeding populations and released cultivars, respectively. Riffkin et al. (2003), Stapper and Fischer (1990a), and Gomez-Macpherson and Richards (1995) showed disadvantages or at best, equivalence. Peake et al. (2018) highlighted that the results from all of these experiments were confounded by nitrogen deficiency, and that modelled studies with adequate N predicted a clear yield advantage of a long cycle (Moore, 2009; van Rees et al., 2014). More recent experiments used pre-experimental modelling to define sowing times for different life cycle genotypes to ensure concurrent flowering during the optimal period. These experiments were initially promising, and long cycle cultivars sown earlier had a yield advantage over elite short cycle cultivars sown later (Hunt et al., 2012). As more experiments were conducted, responses became more variable. Modelling by Lilley and Kirkegaard (2016) followed by field experiments reported by Kirkegaard et al. (2015) and Flohr et al. (2020) deduced that long cycle cultivars had a yield advantage in environments where there was both stored soil water at depth and a spring drought. This yield advantage was the result of greater root depth in the long cycle cultivars. When these conditions were not met, yields were equivalent. In situations where yields were equivalent, long cycle treatments often partitioned more water to transpiration rather than evaporation and had higher transpiration efficiency for dry matter, but this traded off against harvest index (Flohr et al., 2020).
Having established that there was at least no yield penalty associated with long cycle cultivars sown earlier, research began to focus on how best to achieve long life cycle duration in wheat—by increased vernalization sensitivity, increased photoperiod sensitivity, or greater thermal time requirement/less earliness per se (Hyles et al., 2020). Whilst photoperiod and greater thermal time requirement delay development under limiting conditions, vernalization has the added advantage of stabilizing flowering time (Hunt, 2017; Flohr et al., 2018c). Fischer (2011) identified the utility to growers of wheat cultivars that had a stable flowering time across a broad range of sowing dates. Operationally for growers, this means that they only need one cultivar to suit a broad range of sowing dates, rather than multiple cultivars to suit different sowing opportunities. Extensive experiments using near-isogenic lines of wheat that varied for major development alleles confirmed the broad sowing window of winter cultivars that extended for over 1 month earlier than optimal planting times for current quick spring cultivars (Hunt et al., 2019b). It was also revealed that the genotypes most suitable for early sowing systems were not commercially available to growers (Flohr et al., 2018c). Low rainfall environments where most wheat is grown in southern Australia required a quick winter wheat development pattern—a genotype that had a large vernalization requirement—but once this was satisfied, the wheat progressed rapidly through the remainder of the lifecycle with little photoperiod sensitivity.
Whilst this ideotype did not exist in adapted Australian wheat germplasm, due to the peculiarity of wheat genetics, it was possible for breeding programmes to generate it rapidly from crosses of elite spring cultivars. For wheat to express winter phenotype, it must have winter alleles (v or w by the nomenclature of Bloomfield et al. (2018)) at vernalization loci across its three sub-genomes—Vrn-A1, Vrn-B1, Vrn-D1 (Hyles et al., 2020). Many high yielding Australian spring wheats carry one or two winter alleles at these loci, with the presence of at least one spring allele (a or b) conferring spring habit. It was therefore possible with targeted cross-optimization to design crosses between spring wheat parents that produced a proportion of winter progeny. In the example given in Fig. 6, cultivars Scepter and Beckom, which are currently two of the highest yielding cultivars in south-eastern Australia, will produce 25% winter progeny after segregation. Winter progeny can be easily phenotyped during segregating generations under non-vernalizing conditions in the glasshouse or field or identified using molecular markers for vernalization alleles. Phenotyping for winter habit lines and selecting them early in the breeding pipeline will ensure sufficient genetic variation for selection gains of other commercially important traits.
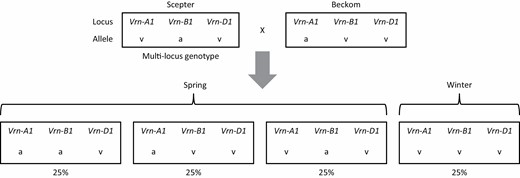
A biparental cross between high yielding spring cultivars well adapted to south-eastern Australia will after segregation produce on average 25% winter progeny. Nomenclature is after Bloomfield et al. (2018) where v represents the vernalisation-sensitive (winter—wild type) allele and a represents the vernalisation-insensitive (spring) allele.
This peculiarity has been exploited by both commercial breeders and researchers to rapidly develop quick winter cultivars adapted to Australian conditions. A recent cultivar, Longsword, conformed to the quick winter ideotype and initially performed well in experiments (Flohr et al., 2018c). Unfortunately, it was unable to achieve milling accreditation, which limited its commercial uptake, and was also revealed to be susceptible to floret sterility (Porker et al., 2019). Further, targeted crosses involving spring cultivars can produce slow developing genotypes suitable for early sowing, such as DS Bennett, which has the spring cultivar Drysdale as a parent. This large phenotypic variation amongst progeny lines selected from targeted crosses involving one or two spring parents is currently progressing through multiple commercial breeding programmes, with releases possible soon provided all other commercially relevant traits (such as milling accreditation) are achieved. However, the longevity of this potential improvement is called into question by a recent simulation analysis that suggested increased temperatures will jeopardise the adaptation of quick winter cultivars to south-eastern Australia (Collins and Chenu, 2021).
A possible negative consequence of vernalization as a mechanism to slow development and stabilize flowering is an extended vegetative period at cost of shortened yield formation period (Acuña et al., 2019). In addition to delaying development, presence of the winter allele of Vrn-B1 has also been shown to have a negative effect on biomass accumulation (Harris et al., 2017). These have the potential to result in poor partitioning that results in poor harvest index (Porker et al., 2020). Cann et al. (2019) compared winter and spring siblings from a spring × spring cross at consistent flowering times and demonstrated that winter phenotypes exhibited lower harvest index compared with their spring counterparts. Long life cycle duration does increase biomass accumulation and Flohr et al. (2018b) suggest that harvest index is uncoupled from phase duration. This is further supported by the observation that relationship between harvest index and the ratio of pre- and post-anthesis water-use identified by (Passioura, 1977) did not explain inferior harvest index in long cycle cultivars (Flohr et al., 2020). This gives hope that further yield gains can rapidly be made by improving harvest index in winter cultivars. This can possibly be accelerated by direct selection for harvest index in early generation (F3) single spaced plants (Fischer and Rebetzke, 2018).
Such acceleration in breeding will be required as breeding programmes for winter wheat cannot use summer nurseries to achieve multiple generations a year, a common practice in spring cereal breeding programmes. We propose that early generation selection and ‘speed breeding’, including the harvesting of premature seed (Ghosh et al., 2018; Watson et al., 2018) techniques could be combined to accelerate genetic gain (Table 1). This would reduce breeding time to ~8 years from initial cross to cultivar release, which is comparable to current Australian spring wheat breeding programmes and faster than reported international winter wheat programmes.
Outline of a breeding programme for quick winter cultivars derived from adapted spring/spring crosses using early generating selection in single spaced plants and rapid generation cycling
| Year | Generation | Activity | Environment | Duration |
|---|---|---|---|---|
| 1 | F0 | Spring parents crossed and F1 seed harvested | Light supplemented glasshouse, 23 °C, 22 h light/2 h dark | 5 months |
| F1 | F1 plants grown and F2 seed harvested | Light supplemented glasshouse, 23 °C, 22 h light/2 h dark | 3 months | |
| F2 | F2 plants grown and phenotyped for winter habit. Selections vernalized then seed harvested | Light supplemented glasshouse, 23 °C, 22 h light/2 h dark Vernalization chamber, 8 °C, 22 h light/2 h dark | 2 months 5 weeks | |
| 2 | F3 | F3 single spaced plants grown and phenotyped for harvest index, height, flowering time | Field | 8 months |
| 3 | F4 | F4 plants grown in plots in partially replicated experiments in two environments. | Field | 8 months |
| 4 | F5 | Replicated yield and quality plots in multiple environments. Disease testing | Field | 8 months |
| 5 | F6 | Yield and quality plots in replicated experiments. Disease testing. Commence pure seed production | Field | 8 months |
| 6 | F7 | Yield and quality plots in replicated experiments and NVT. Continued pure seed production | Field | 8 months |
| 7 | F8 | Yield and quality plots in replicated experiments and NVT. Quality accreditation. Continued disease testing and pure seed production for commercial release | Field | 8 months |
| 8 | Commercial release |
NVT, National Variety Trials.
Data from the Grains Research and Development Corporation’s National Variety Trials (NVT—https://www.nvtonline.com.au/) are presented here as a case study of the potential impact that long cycle cultivars can have in farming system improvements. NVTs are grown in numerous locations per year within pre-defined zones based on geographical regions and environmental constraints (more details of NVT are provided in Smith et al., 2015). Across south-east and south-west New South Wales, NVTs have two sowing dates (early and main) at up to six (south-east) and eight (south-west) individual locations per year across 2011–2020. Data across all lines in these trials (unreleased breeding lines and commercially available cultivars) are used here, whereas publicly available data includes only commercially available cultivars. Data presented are from 96 paired orthogonal contrasts (192 trials in total), where both Early and Main series data at a location were released. No further analyses have been undertaken on these data; rather, they have been used to detect trends.
These NVT data (Table 2) highlight trends in response to growing industry demand for integrated systems to fully capture the opportunity earlier sowing offers. Firstly, NVTs are being sown earlier in the year, especially for Early series trials. Next, as a ratio to Main series trials, more lines are being evaluated in Early series trials across the period. Thirdly, across the 96 orthogonal contrasts (Table 2), Early series trials had higher yield than Main series trials on 62 occasions (66%). When each NVT (individual NVT site data not shown) is empirically divided into above or below overall mean yield (~4.5 t ha−1), Early series trials out-yielded Main series trials with more frequency in higher yield sites (36/48, 75%) than lower yielding sites (26/48, 54%) (Table 2).
Mean sowing date, number of lines entered and mean yields from orthogonal contrast pairs of early and main series National Variety Trials (NVT—https://www.nvtonline.com.au/) across 96 location–year combinations from south-east and south-west New South Wales in the period 2011–2020
| Year | Locations | Mean sowing date | Number of lines | Mean yield | Frequency of yield Early > Main | |||
|---|---|---|---|---|---|---|---|---|
| Early | Main | Early | Main | Early | Main | |||
| 2011 | 13 | 7 May | 26 May | 48 | 98 | 3.9 | 3.9 | 46% |
| 2012 | 12 | 5 May | 23 May | 45 | 66 | 4.3 | 3.7 | 92% |
| 2013 | 11 | 14 May | 20 May | 36 | 69 | 3.6 | 3.7 | 27% |
| 2014 | 11 | 26 Apr | 15 May | 43 | 60 | 4.1 | 4.2 | 36% |
| 2015 | 11 | 30 Apr | 15 May | 54 | 82 | 4.5 | 4.3 | 82% |
| 2016 | 12 | 4 May | 20 May | 56 | 83 | 5.9 | 5.5 | 75% |
| 2017 a | 4 | 3 May | 15 May | 42 | 73 | 5.6 | 5.2 | 100% |
| 2018 a | 4 | 10 May | 20 May | 46 | 58 | 4.8 | 4.9 | 50% |
| 2019 | 5 | 5 May | 20 May | 44 | 64 | 4.5 | 4.3 | 80% |
| 2020 | 13 | 27 Apr | 16 May | 50 | 68 | 5.9 | 5.7 | 77% |
a Numerous trials were lost in these years due to combinations of frost and/or drought.
These data demonstrate a change in breeding and evaluation of new cultivars by commercial companies. The trend across years for earlier sowing of NVT is in response to growers planting earlier. Also, Early trials have an increasing number of entries relative to Main, demonstrating commercial breeding companies are increasing their investment for slower developing genotypes to fit with industry shifts toward earlier sowing.
A complimentary genetic trait to stabilize flowering time is the ability for seeds to emerge from deep within the soil. This allows them to be sown into residual soil water and removes reliance on the autumn break for establishment (Kirkegaard and Hunt, 2010; Flohr et al., 2021). This presents a classic G×M interaction to overcome the constraint imposed by declining autumn rainfall. Just as yield increases attributable to early sowing required genetic, management, and technological synergies, successful deep sowing of wheat will require genotypes with the ability to emerge from depth (ostensibly through increased coleoptile length) (G), innovations in sowing machinery to facilitate deep seed placement while minimizing soil disturbance (M), and changes to farm management, including early sowing, summer fallow weed management, and the inclusion of long fallow in crop sequences (M) (Cann et al., 2020b). Some of these synergies are already used by growers in the Pacific North West USA and northern Australia. Research into the genetic component of this innovation is well under way in Australia (Rebetzke et al., 2004, 2007, 2011; Bovill et al., 2019), and material has entered breeding programmes. All currently grown cultivars contain the Green Revolution dwarfing genes Rht-B1b and Rht-D1d which shorten coleoptile length, and alternate dwarfing genes such as Rht13 show promise for allowing emergence from depth without increasing plant height (Rebetzke et al., 2011). There has been little field research into the management components of this innovation, and this represents an opportunity for further productivity increases. A modelling analysis by Flohr et al. (2018a) indicated that vernalization and the ability to emerge from depth could be complementary traits when matched with appropriate management of soil water conservation and sowing depth.
Barley
A recent example of an interaction between agronomy and genetics in barley has been the shift to earlier sowing times, facilitated by the introduction of new seed dressings for early disease prevention, increased foliar fungicide applications, and new cultivars with greater yield potential. Despite the trend towards earlier sowing of all crops and the release of slower developing wheat cultivars described above, there is a lack of commercial barley cultivars that have suitable development patterns capable of earlier sowing. The lack of diversity in development patterns in barley has been a result of direct ‘ideotype’ selection pressure by Australian breeding programmes that now needs to change to adapt to modern farming systems. Boyd et al. (2003) concluded best adapted barley cultivars for Australian low–medium rainfall environments are quick developing spring types, which combine a short vegetative phase, a strong photoperiod response, and limited vernalization requirement. New developmental gene combinations will be necessary to adapt to the evolving farming system and in particular we discuss the reintroduction of vernalization (Vrn) alleles from winter cultivars to slow development, stabilize flowering, and improve yield in earlier sown barley crops.
Early sowing evaluation experiments were conducted on the southern coast of Western Australia by Portmann and Young (1987), as they recognized that suitable material was not being generated out of the traditional germplasm in breeding programmes. They concluded that winter lines showed promise for early sowing but were unsuitable for malting, and they did not progress further. Portmann and Young (1987) noted the first winter cultivars introduced to Australia were too slow, had poor early vigour, and reduced dry matter accumulation during winter compared with spring lines and concluded the task confronting breeders was to select less temperature sensitive winter types. Ulandra was the first ‘modern’ winter barley released in Australia in 1987 (Read and Macdonald, 1987). Ulandra was then crossed with a well-adapted quick developing spring cultivar, Yagan, which led to release of Urambie in 2005, a semi-dwarf feed barley suited to early March to mid-May sowing in New South Wales. Whilst Urambie was a successful cultivar for dual purpose use (Sprague et al., 2018) and is still used by growers, there has been no further winter barley cultivars released since.
It is understandable that there has been limited selection for winter cultivars within Australian barley breeding programmes, given their use of summer nurseries, glasshouse or growth room environments to speed up and select early generations. Under these breeding methods the Australian spring ‘ideotype’ was easy to select based on selection for early flowering and limited tillering. In these selection environments true winter cultivars still require a vernalization period, which may only be unfulfilled or only partially fulfilled, meaning any lines possessing winter Vrn-H1 alleles do not progress to yield evaluation experiments.
Selection of adapted winter barley will require a targeted breeding effort. Justification of such an effort has been demonstrated as near isogenic lines with winter Vrn1-H1 and Vrn-H2 alleles were capable of flowering at a similar time to quick developing spring cultivars from autumn plantings (Porker et al., 2017) and produced yields comparable to current spring cultivars despite no selection for yield. Development of winter barley cultivars is also more complicated than wheat because they cannot be derived from adapted spring/spring crosses as outlined in wheat in Fig. 6. Spring/winter crosses will be the most expedient way to achieve better adapted winter cultivars, where winter parents have been pre-vernalized. Introgression of new development alleles from wild barley to reduce cold requirement and improve adaptation (Pham et al., 2020) is also required. Breeders could adopt more expensive doubled haploid systems or ensure seedlings receive sufficient cold treatment to satisfy vernalization requirements during segregating phases of spring/winter crosses. Otherwise, the system will be selecting genotypes with a bias towards low vernalization requirements.
There are further barriers to the development of winter barley that have led to market failure. As with wheat, different winter cultivars will be required for different environments (Porker et al., 2019). In addition, malting barley cultivars are segregated at point of receival based on cultivar, and gaining malt accreditation is slow and expensive. Breeding companies understandably spend most breeding and market effort on developing malt cultivars that are widely adapted to the majority of cropping systems, so developing cultivars with specific winter adaptation comes at significant extra cost to breeding companies. Barley needs to adapt to a changing climate along with an expected increased global demand for feed grains over the next decade (Newton et al., 2011). Thus, faster genetic gain for yield maybe possible by increased selection for new adaptation traits, such as winter habit, that have previously been constrained by selection for high malt quality.
Compared to wheat, earlier sown barley crops are more prone to lodging in the higher rainfall zones and have reduced pre-emergent weed control options, and barley foliar diseases (net blotches, scald, barley leaf rust, etc.) are some of the major biotic stress factors attributed to yield and quality losses (Angessa and Li, 2016). The other limitations of winter barley was lower harvest index (Porker, 2018). These constraints could be managed and transformation of barley systems achieved by combining new genetics with adaptive management.
Canola
The same system and climate drivers that underpin the trend for earlier sowing in cereals also operate in canola. Earlier sowing of canola can improve water productivity and reduce the risks associated with canola production, provided cultivars and hybrids with appropriate phenology are matched with the optimum flowering dates. Recent research has identified the potential to move traditional sowing dates for spring canola from late April–early May into earlier in April by matching varietal phenology to sowing dates to achieve optimal flowering periods across different Australian environments (Kirkegaard et al., 2016a). Key to this was an understanding of the drivers of canola phenology, especially the key role of vernalization in slowing development of earlier sown cultivars (Whish et al., 2020), and the identification of the critical period of grain number determination for canola, which extends for 400 °Cd and is centred around 300 °Cd after the start of flowering (Kirkegaard et al., 2018). These physiological insights allowed optimum flowering periods to be predicted, and matched sowing times for cultivars and hybrids of different phenology to be identified across Australian growing regions (Lilley et al., 2019). In some cases, this has led to recommendations to shift sowing windows up to 3 weeks earlier than previously recommended for typical mid-quick spring cultivars. Further agronomic modifications for success with earlier sowing systems have included a switch to hybrids, larger seed size, reduced plant density, and increased N rates (Brill et al., 2016) to capitalize on the higher yield potential, and this package of genotypic and agronomic adjustments has also proved successful in lower rainfall areas (McBeath et al., 2020). In those areas reliable early establishment is critical and hybrids must demonstrate ~20% yield advantage to justify the higher seed costs (Zhang et al., 2016; McBeath et al., 2020). In the cooler higher rainfall zones, very slow phenology winter canola hybrids and cultivars suitable for sowing in February and March were first released commercially in 2011 for grain and dual-purpose use (Lilley et al., 2015; Sprague et al., 2018), but no commercial genotypes with an intermediate quick winter phenology (as now available in wheat) have been commercialized to date. The potential benefits of these genotypes are predicted to be significant for both grain yield and dual-purpose use (Christy et al. 2013; Lilley et al. 2015) and breeding companies have started to investigate winter–spring crosses to fill this current phenology gap in Australian canola germplasm.
Synergies at farm scale
On large farms in Australia, the benefits of earlier sowing systems at the paddock scale are accompanied by important flow-on benefits at the whole farm level. The large farm size in Australia means that an entire farm sowing programme may take upward of 30 d. A combination of changing patterns of seasonal rainfall events that enable earlier crop establishment (Flohr et al., 2021), the capacity to start sowing some crops early with long cycle cultivars of suitable phenology, and improved pre-crop management means that all cropping paddocks on the farm will potentially move into an earlier sowing window, and derive yield benefits accordingly. A recent simulation study that accounted for these factors examined the benefits of earlier sowing at the farm level across all wheat-growing areas in Australia over a 20-year period (1996–2015) and predicted the areas where yield benefits from earlier sowing were likely, and the benefit at a national scale (Hunt et al., 2019b). The study predicted an average wheat yield benefit across Australia of 0.54 t ha−1, equivalent to an extra 7.6 million tonnes of wheat per annum. The benefits were variable across seasons and occurred mostly in the southern temperate and Mediterranean regions with sharply defined optimal flowering periods, while mean yield losses were predicted in northern, summer dominant rainfall regions. Yield benefits were generally increased in areas of high rainfall due to increased chances of early sowing and the higher yield potential, but even in the drier areas whole-farm yield increases were generally >0.5 t ha−1, and predicted yield losses were rare. While this study predicted the benefits to wheat yield, other crops such as canola also produce higher yields when long season cultivars are sown early (Kirkegaard et al., 2016a; Kirkegaard, 2019). Much of this remarkable benefit from the earlier sowing system has been shown to derive from better access to subsoil water in earlier sown crops (Flohr et al., 2020), a longer period of resource capture and biomass accumulation leading to increased yield potential, as well as the farm-scale benefits of the entire sowing programme moving into a more favourable sowing window (Fletcher et al., 2019).
Long cycle crops are likely to leave the soil in a drier state that potentially reduces water availability to subsequent crops (Lilley and Kirkegaard, 2016). These legacy effects are particularly important in lower rainfall areas where subsoil profiles are less likely to refill. Adaptive management of the crop sequence within a particular paddock will consider water availability as well as traditional disease and weed break rotations and commodity price (Angus et al., 2015) and management of risk across the whole farm. Long-season crops also offer animal fodder through dual-purpose systems where animals graze the crop during the vegetative stage (see next section).
Dual purpose systems
The inclusion of these dual-purpose crops in mixed farming enterprises provide significant synergistic benefits across the whole farm enterprise, filling feed-gaps, increasing ground cover (Lilley and Moore, 2009), increasing productivity, and managing business risk in a variable climate (Bell et al., 2014). Traditionally cereals such as oats and feed wheat were used in this way, but more recently both milling wheat (Simmonds, 1989; Virgona et al., 2006) and canola (Kirkegaard et al., 2008c) have been developed for dual-purpose grain and graze systems. Early sowing combined with slow developing cultivars results in a longer vegetative stage and greater biomass accumulation to fill the winter feed gap (McCormick et al., 2012; Bell et al., 2015b; Frischke et al., 2015). Provided the livestock are removed prior to stem elongation in both cereal (Virgona et al., 2006) and canola (Kirkegaard et al., 2012; Sprague et al., 2015) the crops can recover after grazing to produce grain yields that either match those of ungrazed crops, or can provide a higher combined income (forage plus grain) than grain-only crops (Bell et al., 2014). Recent increases in meat:grain price ratios have improved chances of an economically favourable outcome even when grain yields are reduced by grazing. Earlier sowing increases grazing potential by 200–250 sheep grazing days per hectare for each week prior to 28 June (Bell et al., 2015b).
The development of dual-purpose crops has been a truly interdisciplinary exercise combining aspects of crop phenology and vigour (Davidson et al., 1990; Lilley et al., 2015), physiology of yield recovery after grazing (Harrison et al., 2011a, b, 2012a, b; Kirkegaard et al., 2012; McCormick et al., 2012), grazing animal management (Dove and Kirkegaard, 2014), and interactions between grazing and crop disease (Sprague et al., 2013). Newly developed herbicide and disease resistant, dual-purpose winter hybrid canola can achieve in excess of 2000 sheep grazing days per hectare (e.g. 40 sheep per ha grazing for 50 d) and recover to yield up to 3–4 t ha−1 of high oil canola seed in the medium/high rainfall zones of southern Australia (Sprague et al., 2014). Rotational benefits flow from canola to succeeding wheat crops and assist intractable grass weed control (e.g. serrated tussock grass) in perennial pastures. Typically crop growth rates are significantly higher than pasture growth rates in winter providing opportunities to rest pastures while animals graze the crops (Dove et al., 2015).
At the farm scale, field experiments (McGrath et al., 2021) and simulation (Bell et al., 2015a) as well as recent commercial experience has demonstrated that the integration of dual-purpose wheat and canola into traditional grazing enterprises (with no cropping) at 10–20% of farm area can lift farm profits by $100–200 per farm hectare. The benefits arise through increased winter grazing and reduced supplementary feeding costs as well as the income from grain, so that animal and crop production increase simultaneously.
Conclusion
Compared with single innovations, greater advances in water productivity have ensued when synergies are achieved between multiple management and genetic factors. Increases in yield could be accelerated if research institutions and funding bodies were better structured to anticipate and capture these synergies. We propose ‘transformational agronomy’ as a framework for the structure and process of research, whereby constraints to farming systems production are identified and addressed by cross-functional teams working closely with growers and their advisors. Recent water productivity research in south-eastern Australia provides a case study of how this can be achieved within a water limited environment that has already suffered adverse effects of climate change.
Acknowledgements
Most of the research described here has been possible through investment of grower and public funds by the Grains Research and Development Corporation and we recognize their contribution and are grateful for their ongoing support. We would also like to specifically acknowledge the National Variety Trials (NVT) programme as the source of data presented in Table 2.
Author contributions
JRH: conceptualization; JAK: conceptualization of review structure; JRH, JAK, FAJH, KDP, ARR, MJC, CC, DJC, JML, and ZH: writing—original draft; JAK, FAJH, KDP, ARR, MJC, CC, DJC, ZH, and BMF: reviewed and edited the complete manuscript; ARR and ZH: investigation; ARR, MJC, and ZH data curation; ARR and ZH: formal analysis; JRH, ARR, and ZH: visualization of figures/data.

Comments