


Abstract
The primary root is critical for early seedling growth and survival. To understand the molecular mechanisms governing primary root development, we performed a dynamic transcriptome analysis of two maize (Zea mays) inbred lines with contrasting primary root length at nine time points over a 12-day period. A total of 18 702 genes were differentially expressed between two lines or different time points. Gene enrichment, phytohormone content determination, and metabolomics analysis showed that auxin biosynthesis and signal transduction, as well as the phenylpropanoid and flavonoid biosynthesis pathways, were associated with root development. Co-expression network analysis revealed that eight modules were associated with lines/stages, as well as primary or lateral root length. In root-related modules, flavonoid metabolism accompanied by auxin biosynthesis and signal transduction constituted a complex gene regulatory network during primary root development. Two candidate genes (rootless concerning crown and seminal roots, rtcs and Zm00001d012781) involved in auxin signaling and flavonoid biosynthesis were identified by co-expression network analysis, QTL-seq and functional annotation. These results increase our understanding of the regulatory network controlling the development of primary and lateral root length, and provide a valuable genetic resource for improvement of root performance in maize.
Introduction
Maize (Zea mays L.) is among the most important crops worldwide, and has multiple uses. For example, it is used to produce grain-based food and feed, and corn silage provides a bioenergy source. Currently, the annual global production of maize is approximately one billion tonnes (Yan and Tan, 2019). However, increases in population size will place considerable pressure on maize growers to produce greater yields in the future (Yan and Tan, 2019). Drought stress (Comas et al., 2013; Chen et al., 2014) and low nitrogen use efficiency (Chen et al., 2014) are the major obstacles to increasing maize production. The root is an important plant organ because it directly affects the uptake of water and nutrients from the soil. In addition, the root system anchors the plant in the soil and serves as a sensor enabling plants to respond to various environmental stresses (Petricka et al., 2012; Villordon et al., 2014). Thus, improving the ability of the root system to take up water and nutrients is a promising strategy for breeders to increase maize productivity. Maize has a complex root system architecture (RSA) comprising embryonic and post-embryonic roots, that are formed during different developmental phases (Hochholdinger et al., 2004; 2018). Embryonic roots, consisting of a primary root and several seminal roots, are produced in the first few weeks after germination. The post-embryonic root system is composed of shoot-borne roots and lateral roots (Hochholdinger, 2009). Maize root traits are quantitatively controlled by several genes. Elucidating the molecular mechanisms and identifying the genes controlling maize RSA are essential to improve water and nutrient uptake.
The molecular basis of root formation has been most extensively studied in the model plant species Arabidopsis. More than 70 Arabidopsis mutants with lateral root defects have been identified. The mutations affect genes related to auxin signaling (AUXIN RESISTANT 1, AXR1; TRANSPORT INHIBITOR RESPONSE 1, TIR1; INDOLE-3-ACETIC ACID 1, IAA1; IAA3; and NAM, ATAF1/2, and CUC2 1, NAC1) and transport (AUXIN 1, AUX1; PIN-FORMED 1, PIN1; PIN3; PIN4; PIN7; and TIR3), as well as cytokinin-related genes (TYPE-A RESPONSE REGULATOR 3, ARR3; ARR5; and ARR6) and other genes affecting the number of lateral roots (ENHANCED RESPONSE TO ABA 1, ERA1; CYTOKININ DEHYDROGENASE 1, CKX1; CKX3; and WALL-ASSOCIATED RECEPTOR-LIKE KINASE 4, WAK4;De Smet et al., 2006). An increasing number of cereal mutants have also been identified. In rice, the mutants short root mutant 1 (rm1) and rm2 (Ishikawa, 1997), reduced root length 1 (rrl1), rrl2 (Inukai et al., 2001), short-root (srt5;Yao et al., 2002), and srt6 (Yao et al., 2003) exhibit defects only in primary root elongation. In contrast to the root systems of Arabidopsis and rice roots, the maize root system comprises structurally and functionally different root types. Several maize root formation-related genes have been cloned and characterized (Yu et al., 2016; Hochholdinger et al., 2018), including ROOTLESS 1 (RT1), RTCS, LATERAL ROOTLESS 1 (LRT1), ROOTLESS WITH UNDETECTABLE MERISTEMS 1 (RUM1), SHORT LATERAL ROOTS 1 (SLR1), SLR2, ROOTHAIRLESS 1 (RTH1), RTH2, and RTH3. However, the RSA is controlled by various interacting loci (Zurek et al., 2015). Analyses of monogenic maize mutants have been insufficient to elucidate the complex mechanisms underlying RSA development. Quantitative trait loci (QTL) mapping and genome-wide association studies have detected many QTL associated with the RSA (Hund et al., 2011; Bray and Topp, 2018; Sertse et al., 2019), but only a small number of genes that control RSA have been identified. In maize, two major QTL, rtcs and rum1, control the number of seminal roots (Salvi et al., 2016). Although these studies have advanced our understanding of the genetic basis of complex root phenotypes, determining the molecular mechanisms underlying specific root traits based on the associated genetic markers remains difficult (Coudert et al., 2010; Meng et al., 2019). The development of next-generation sequencing technology has enabled researchers to study whole transcriptomes in multiple samples (Secco et al., 2013). Investigations of transcriptome dynamics have helped to reveal the transcriptional network and candidate genes associated with plant traits. Garg et al. (2017) identified cultivar-specific molecular signatures associated with seed development and seed size determination in chickpea via global transcriptome and co-expression network analyses. Shinozaki et al. (2018) conducted a spatiotemporal transcriptome analysis of tomato fruit ontogeny using a RNA-seq (RNA sequencing) approach, and uncovered previously unknown regulatory phenomena and relationships. Yi et al. (2019) clarified maize seed development based on a high-temporal-resolution transcriptome landscape, and Martínez-López et al. (2014) detected the transcriptome changes occurring during the development and ripening of chili pepper fruit. These studies provide new functional insights that may help to unravel the molecular mechanisms regulating plant development.
Auxin is a plant hormone that serves as a key regulator of maize root development. Auxin regulates the formation of shoot-borne roots in maize by activating the auxin-responsive genes rtcs, ROOTLESS CONCERNING CROWN AND SEMINAL ROOTS LIKE (rtcl), and AUXIN RESPONSE FACTOR 34 (arf34; (Xu et al., 2015). The auxin signaling-related gene rum1 controls seminal root and lateral root initiation (Woll et al., 2005; Zhang et al., 2015). Hormones such as cytokinin (CK), brassinosteroids (BR), abscisic acid (ABA), jasmonic acid (JA), gibberellin (GA), ethylene, polyamines (PAs), and strigolactones (SLs) can affect auxin biosynthesis, transport, and signaling related to root development. Specifically, CK modifies the expression of PIN-FORMED (PIN) genes and regulates cell-to-cell auxin transport, thereby influencing cellular auxin concentrations. In addition, CK–auxin interaction coordinates the maintenance of root meristem size and ensures root growth (Saini et al., 2013; Zhang et al., 2013). In contrast, JA induces the expression of auxin efflux carrier genes (Monzon et al., 2012), resulting in a loss of root apical dominance and decreased root elongation in Arabidopsis (Vellosillo et al., 2007). Furthermore, lateral root development is inextricably linked to plant hormones. For example, BR and PAs positively regulate lateral root development, whereas ABA, GA, JA, ethylene, and CK have the opposite effect (Saini et al., 2013). In addition to phytohormones, exogenously applied metabolites also affect root development. In sorghum, exogenous flavonoids inhibit primary root growth and promote lateral root development (Franco et al., 2015). Previous research proved that L-3,4-dihydroxyphenylalanine, the precursor of flavonoids and phenylpropanoids, enhances phenylalanine ammonia-lyase (PAL), tyrosine ammonia-lyase, and peroxidase (POD) activities, while also increasing phenylalanine, tyrosine, and lignin concentrations, which inhibit maize root growth (Siqueira-Soares et al., 2013). Dickinson et al. (2019) observed that β-cyclocitral promotes cell division in root meristems and stimulates lateral root branching. The secondary metabolites involved in root development of maize need to be more thoroughly characterized in future studies.
To provide a global overview of maize primary root development, we applied RNA-seq to compare the gene expression patterns of two maize inbred lines with contrasting primary root length (PRL). This study aimed to (i) clarify the transcriptome dynamics during primary root development and the key differences that determine PRL and lateral root length (LRL) in maize; (ii) examine the co-expressed genes associated with PRL and LRL that are predominantly expressed at different primary root development stages between the two maize inbred lines; and (iii) integrate QTL-seq and RNA-seq analyses to identify candidate genes responsible for controlling PRL and LRL in maize.
Materials and methods
Plant materials and tissue preparation
Two maize inbred lines with contrasting phenotypes for PRL, A39 (long primary root) and A142 (short primary root), were used in this study. Maize plants were cultured hydroponically in a phytotron (14 h light, 28 °C and 10 h night, 26 °C; 80% humidity) in Yangzhou University. Briefly, maize seeds were sterilized for 20 min in a 10% solution of H2O2, washed with distilled water, soaked in saturated CaSO4 for 6 h, and then germinated in the dark on moist filter paper at 28 °C for 2 d. Meanwhile, the germination rate was recorded every 2 h. Every eight germinated seeds were rolled in two-layer brown germination roll paper (Anchor Paper Company, St Paul, MN, USA). Six paper rolls were placed in 16 × 14 × 13 cm white incubators containing 1 l nutrient solution which was renewed every two days (H. Wang et al., 2019). The maize seedlings were collected in two biological replicates at nine time points within a 12 d period (0 h, 12 h, 28 h, 48 h, 4 d, 6 d, 8 d, 10 d and 12 d) after 2 d germination, representing S1, S2, S3, S4, S5, S6, S7, S8 and S9, respectively. At least six seeds from each stage were used for measuring PRL and LRL. The PRL was measured with a ruler. Total length of primary root (TPRL) was obtained using the WinRHIZO root analysis system (Pro 2004b, Canada), and LRL values were obtained by subtracting PRL from TPRL. At least 10–30 primary roots were collected for each biological replicate, immediately frozen in liquid nitrogen, and stored at –80 °C.
Library construction and sequencing
Thirty-six samples from maize roots were used for RNA-seq using NEBNext® UltraTM RNA Library Prep Kit for Illumina® (NEB, USA) following the manufacturer’s recommendations, and index codes were added to attribute sequences; a total of 1.5 μg RNA per sample was used as input material for RNA sample preparations. The library preparations were sequenced on an Illumina Hiseq platform and paired-end reads were generated. All raw reads from this study have been deposited in the NCBI Sequence Read Archive (SRA, http:www.ncbi.nlm.nih.gov/sra/) under accession number SRP266689. Clean reads were obtained by removing reads containing adapter, reads containing poly-N, and low quality reads from raw reads.
Transcript profiling and analysis of differential gene expression
The high-quality cleaned reads were aligned to the maize reference genome sequence version 4 (RefGen_v4) using HISAT2 (Kim et al., 2015). These reads for each sample were processed using featureCounts (http://subread.sourceforge.net/) to determine the normalized expression as fragments per kilobase of transcript length per million mapped reads (FPKM) of each transcript (Liao et al., 2014). Correlation and hierarchical clustering analysis were performed using Pearson correlation and pheatmap in R package. Differentially expressed genes (DEGs) among two conditions was performed using an exact test provided in the DESeq R package (Wang et al., 2010). Genes with an adjusted P value <0.05 and a |log2 (foldchange)| ≥ 1 found by DESeq were assigned as differentially expressed. Kyoto Encyclopedia od Genes and Genomes (KEGG) enrichment analysis of the DEGs was carried out using the KOBAS software (Kanehisa et al., 2007). In addition, pathway enrichment analysis of DEGs was performed using MapMan tools (Usadel et al., 2009).
Quantitative RT–PCR
Nine genes associated with the auxin and flavonoids pathway were chosen for qRT–PCR with gene-specific primers (Supplementary Table S1). Root tissues were collected at S1, S4, S5, and S9 time points. Total RNA was extracted using RNAsimple Total RNA Kit (Tiangen, Beijing, China) and purified using the gDNA wiper Mix (Vazyme, Nanjing, China). cDNA was reverse transcribed using qRT SuperMix II (Vazyme, Nanjing, China). The qRT–PCR reaction were performed in a CFX96 Real-Time System (Bio-Rad, Munich, Germany) for three replicates. The gene ZmTubulin1 (Zm00001d013367) was used as an endogenous control to calculate the relative expression using the 2-ΔΔCT method.
Weighted gene co-expression network analysis
The co-expressed genes were identified using averaged FPKM values and the WGCNA package in R (Langfelder and Horvath, 2008). All DEGs (18 487 genes) were used to generate an adjacency matrix of pairwise relationships between all pairs of genes. The co-expression network was obtained using pickSoftThreshold function in R, and the soft threshold (power) was 28. Twenty-one modules were identified by blockwiseModules function with the following setting, minModuleSize was 30, mergeCutHeight was 0.25, TOMType was unsigned. A module eigengene (ME) value, which summarized the gene expression profiles of a module as the first principal component, was calculated by moduleEigengenes function for each individual module. The KME (ME based gene connectivity) was obtained using signed KME function between the FPKM of each gene and the ME of modules. The gene networks were visualized using Cytoscape v3.6.1 (Shannon et al., 2003).
Quantification of hormones
Primary roots were collected in three biological replicates at S1, S4, S5, and S9 time points in two maize inbred lines. A sample of approximately 0.5 g was frozen in liquid nitrogen. The methods for extraction and purification of indole-3-acetic acid (IAA), zeatin (ZR), brassinosteroids (BR), and jasmonic acid (JA) were performed as previously described (Yang et al., 2001). The root sample was ground in a mortar with 5 ml methanol extraction medium which contain 1 mmol·l-1 butylated hydroxytoluence. The supernatant was passed through Chromosep C18 columns and prewashed with 10 ml of 100% (w/v) and 5 ml of 80% (v/v) methanol. The hormone fractions were dried under N2 and dissolved in 1 ml of phosphate-buffered saline. The quantification method for hormones by ELISA has been described by Lin (2015). The kit used in the determination of hormone concentrations was prepared by the Chemical Control Research Center of China Agricultural University.
Metabolomics
The primary roots were collected in three biological replicates at the S9 stage. The six samples were snap-frozen in liquid nitrogen, and kept at −80 °C until further analysis. For extraction procedure, about 50 mg of each sample was applied and extracted with 800 μl of 80% methanol and 5 μl internal standard (2.8 mg ml-1 DL-o-Chlorophenylalanine). All samples were ground to a fine power using a grinding mill (Tissuelyser-96L, Shanghai, China) at 65 Hz for 90 s, and then ultrasonicated at 40 KHz on an ice bath for 30 min. The samples were centrifuged at 13 543 × g at 4 °C for 15 min. A sample of 200 μl of the supernatant was transferred to a vial for LC-MS analysis. The samples were used for untargeted metabolomic analysis on a LC-MS platform (Thermo, Ultimate 3000LC, Orbitrap Elite, USA).
QTL analysis using QTL-seq
A cross was made between A39 and A142 to create F1, which was self-pollinated to generate the F2 progeny. The 635 F2 segregating plants were cultured hydroponically in the phytotron (H. Wang et al., 2019). The primary roots were collected after 12 days of germination and the PRL of each plant measured. We selected 50 F2 progenies with longer PRL to make highest bulk and 50 progenies with shorter PRL to make lowest bulk. The two RNA pools were constructed by mixing equal amounts of RNA-seq. Equal amounts of genomic RNA were then used for paired-end sequencing library construction. The two libraries were subjected to whole-genome sequencing on an Illumina HiSeq2000 platform (NEBNext® Ultra™ RNA Library Prep Kit for Illumina®, NEB, USA). After filtering, the high-quality reads were mapped onto the B73 reference genome (RefGen_V4) using the Burrows-Wheeler-Alignment (BWA) tool (Jo, 2016) and Genome Analysis Toolkit (GATK 4.0; Van der Auwera et al., 2013). Those single nucleotide polymorphisms (SNPs) with read depth higher than ten and base quality value higher than 20 were retained for QTL analysis. Only the QTL region with the loess-fitted values of the markers above the threshold of the 95% confidence interval was considered.
Exogenous auxin treatments
Two maize inbred lines were cultured hydronically in the phytotron as described above. Two-day-old maize seedlings were placed in nutrient solution supplemented with 1-naphthalene acetic acid (NAA). The final concentrations were 0.1, 0.5, 1, 2.5 and 5 nM for NAA. These compounds were dissolved in dimethyl sulfoxide (DMSO). The corresponding control seedlings contained absolute DMSO dissolved in water. Each treatment consisted of three biological replicates, and at least six plants of each biological replicate. The treated plants were analyzed for root architectural responses seven days later. Six uniform seedlings from each biological replicate were harvested to measure primary root lengths with a ruler.
Root gravitropism assay
The maize seeds were germinated in the dark on moist filter paper at 28 ºC for 2 d, as described above. The two-day-old seedlings were transferred to a petri dish with moist filter paper and fixed with tape. Then, the petri dish was gravistimulated with 90° rotation. Photographs were collected for at least ten seedlings at 8 h, 16 h, 24 h, and 32 h after the gravity stimulus. The root angles were analyzed using Image J software (http://imagej.net/).
Results
Morphological analysis of two maize inbred lines with contrasting primary root lengths
The PRL varied considerably among 297 maize inbred lines (Supplementary Fig. S1A). Two maize inbred lines with contrasting PRL were selected from these lines (Li et al., 2019; H. Wang et al., 2019). Specifically, line A39 (average PRL 35.98 cm) and line A142 (average PRL 22.17 cm) were analyzed in this study. Except for total root volume (TRV), no significant differences were observed between A39 and A142 among the other root traits recorded (Supplementary Fig. S1B).
To characterize the primary root development of A39 and A142, a time-course experiment was performed between day 2 and 14 after pre-germination (Fig. 1A). The PRL and LRL were measured at nine time points (0, 12, 28, and 48 h as well as 4, 6, 8, 10, and 12 days). The PRL continuously increased from S1 (2.27 and 1.29 cm in A39 and A142, respectively) to S9 (42.58 and 24.25 cm in A39 and A142, respectively). The PRL of the two maize inbred lines differed significantly (P<0.05) at all time points (Fig. 1C, D). Lateral roots were initiated from the pericycle and endodermal cells at the S4 time point, and the LRL was 1.92 and 0.08 cm in A39 and A142, respectively (Fig. 1E). The lateral roots of A39 were longer than those of A142 from S4 to S9. To determine whether the primary root differences between the two lines were related to the germination rate, we calculated the germination rate every 2 h during seed germination. For A142 and A39, a 50% germination rate required approximately 13 h and 17 h, respectively. Over time, the germination rate did not differ significantly between the two lines (Fig. 1F, G).
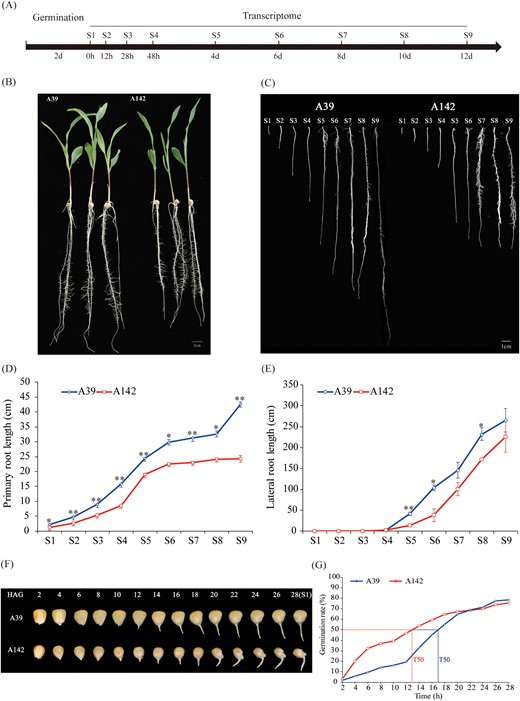
Experimental design and phenotype at different time-points of primary root development in A39 and A142. (A) Diagram of the experimental design. Maize seeds were germinated in water for 2 d and then transferred to moist filter paper to cultivate. The plants were collected at 0 h, 12 h, 28 h, 48 h, 4 d, 6 d, 8 d, 10 d, and 12 d after germination (representing S1, S2, S3, S4, S5, S6, S7, S8 and S9, respectively) for phenotyping and transcriptome sequencing. (B) Photos of the two genotypes used in this study. Bar =2 cm. (C) Close-up views of A39 and A142 primary roots at nine time-points. Bar =1cm. Primary root length (D) and lateral root length (E) at different time-points in A39 and A142, respectively. Error bars indicate standard error. (F) Dynamic photographs of seed every two hours during maize seed germination and (G) seed germination (%) of A39 and A142. T50 = time it takes for 50% of the seeds to germinate. HAG, hours after germination.
Global transcriptome analysis of primary root development
The transcriptome dynamics of maize lines A39 and A142 were studied at nine time points of primary root development. For all tissues, the analysis was conducted with two biological replicates (36 samples in total). The RNA-seq experiments yielded 41–67 million clean reads per sample, which were used for further analyses. Between 75.51% and 84.49% of the clean reads were mapped to the B73 reference genome (RefGen_V4; Supplementary Table S2). A total of 27 050 genes were expressed in the 36 analyzed samples (Supplementary Table S3). For each time point, more genes were expressed in A39 than in A142 (Supplementary Fig. S2A). Approximately 10% of the genes were very highly expressed (FPKM ≥50) in all samples. About 55% and 35% of the genes were moderately (1 ≤ FPKM ≤10) and highly (10 ≤ FPKM ≤50) expressed, respectively (Supplementary Fig. S2B). These results reflected sufficient coverage of the transcriptome during primary root development of the two maize inbred lines.
Global transcriptome analysis reveals two distinct stages during primary root development
Pearson’s correlation coefficients (r) between the two biological replicates for the different time points ranged from 0.93 to 0.99, which was indicative of the high quality of the replicates (Supplementary Fig. S3A, B). To investigate the global differences in the transcriptome dynamics of A39 and A142 during primary root development, we performed a hierarchical cluster analysis and a principal component analysis (PCA) based on the average FPKM values for the expressed genes (Fig. 2). These analyses revealed a relatively high correlation between the two lines at the same time point. The close correlation within and between the maize lines at the first four primary root development time points (S1 to S4) indicated that the transcriptional programs were highly similar. The samples of both maize lines from stages S5 to S9 were tightly clustered, indicating that the transcriptional programs showed high similarity. The PCA revealed that the nine time points could be clearly divided into two distinct stages (i.e. S1–S4 and S5–S9). These results suggested that there were major differences in the transcriptional programs of each line during the early (S1–S4) and late (S5–S9) primary root development stages.
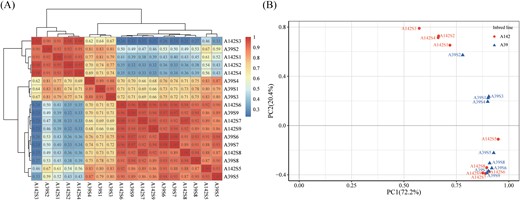
Global gene expression profiling during primary root development. (A) Pearson correlation analysis of nine stages of primary root development in A39 and A142. The color scale on the right represents the Pearson’s correlation coefficients (r). The values of r >0.5 were indicated by red, while r<0.5 were indicated by blue. (B) Principal component analysis (PCA) of the RNA-seq data.
Differential expression of genes between the two maize inbred lines
Comparison of gene expression in A39 and A142 at the nine primary root development time points revealed 16 392 differentially expressed genes (DEGs) between the two maize inbred lines (Fig. 3A). The S7 and S2 time points showed the most (8370) and fewest (2641) DEGs, respectively. A total of 1093 transcription factor (TF)-encoding genes from 50 families were differentially expressed between the two lines. These TFs included members of families involved in hormone signal transduction (ARF, type-B response regulators, ARR-B; and ethylene-responsive transcription factor, ERF). The members of the basic helix-loop-helix (bHLH), basic leucine zipper (bZIP), MYB, MYB-related, NAC, and WRKY TF families were also highly represented in these lines (Fig. 3B).
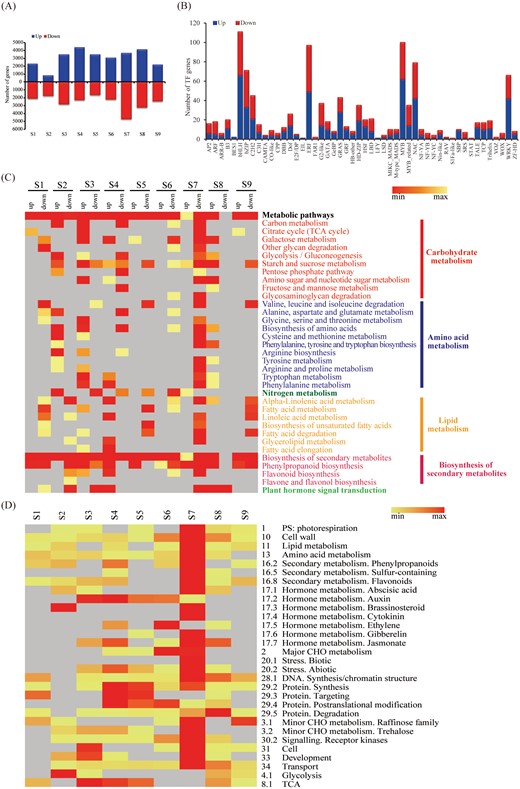
Genes differentially expressed (DEGs) between the maize inbred lines. (A) The number of different expressed genes (up-regulated genes highlighted in blue box and down-regulated genes highlighted in red box) during primary root development in A39 and A142. (B) The number of genes encoding TFs up- or down-regulated between A39 and A142 during primary root development.(C) KEGG pathways at different time-points of primary root development in up- and down-regulated genes between A39 and A142. Only P values <0.05 are shown by the shade of colors. (D) The enriched functions of DEGs between two maize lines at every time-point for MapMan categories. The number of mapped genes was shown by the shade of colors in heatmap.
The KEGG pathways enriched among the DEGs revealed several biological processes that were uniquely or commonly overrepresented at various time points (Fig. 3C). Specifically, the DEGs were associated with the following seven major categories: metabolic pathways, carbohydrate, amino acid, nitrogen, and lipid metabolism, biosynthesis of secondary metabolites, and plant hormone signal transduction. Furthermore, the KEGG pathway enrichment analysis indicated that genes related to phenylpropanoid biosynthesis and plant hormone signal transduction were overrepresented among the DEGs between A39 and A142 at multiple time points, implying that these two pathways may contribute to primary root development.
To investigate how gene expression and metabolic pathways changed during primary root development, we compared the enriched functions of the two genotypes at each time point using the MapMan tool. The analysis of the functional enrichment of the DEGs indicated that the genes were related to reproductive processes, cell wall organisation, lipid, amino acid, and hormone metabolism, protein synthesis and degradation, major carbohydrates, and stress responses (Fig. 3D). The functional annotation of the DEGs indicated that terms related to the metabolism of various hormones, including auxin and JA, were significantly enriched (P<0.05) at most stages and many of the genes were common to both maize lines, especially between S3 and S8. The enrichment analysis also indicated that genes affecting secondary metabolites (e.g. phenylpropanoids and flavonoids) were overrepresented during primary root development.
Differential expression of genes during primary root development
To gain insights into the transcriptional differences that characterized different time points of primary root development in both maize inbred lines, we identified preferentially or specifically expressed genes in A39 (Fig. 4A) and A142 (Fig. 4B). A total of 15 235 and 13 134 DEGs were identified in A39 and A142, respectively, of which 10 976 were common to both inbred lines. The number of stage-specific genes ranged from 105 (S5 versus S6) to 10 401 (S7 versus S8) for A39, and from 129 (S4 versus S5) to 7531 (S6 versus S7) for A142. Thus, the number of stage-specific genes differed significantly among the examined time points (P<0.05). The variable number and proportion of preferentially/specifically expressed genes suggested that the developmental processes differed among the stages.
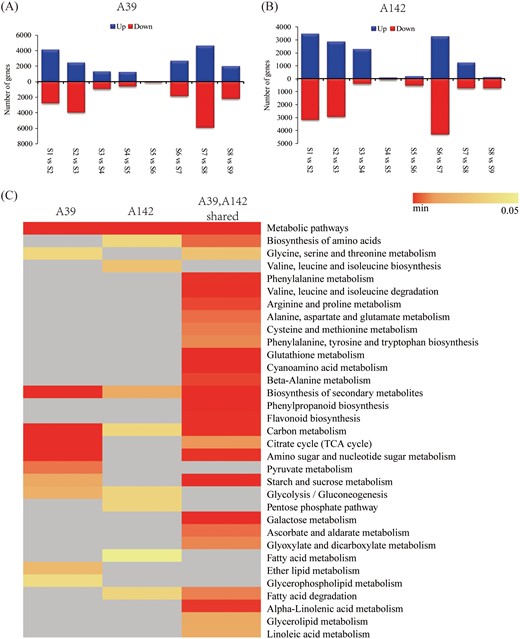
Overview of DEGs in maize inbred lines for each interval. Numbers of DEGs in A39 (A) and A142 (B) based on eight time-point comparisons: S1 versus S2, S2 versus S3, S3 versus S4, S4 versus S5, S5 versus S6, S6 versus S7, S7 versus S8, and S8 versus S9. (C) KEGG pathways of the DEGs specific and common to A39 and A142 (P<0.05).
An analysis of overlapping enriched KEGG pathways revealed that several pathways were either specifically enriched in one maize inbred line or were commonly enriched in both lines (Fig. 4C). The three enriched pathways among the A39-specific DEGs were pyruvate metabolism, ether lipid metabolism, and glycerophospholipid metabolism. In contrast, valine, leucine, and isoleucine biosynthesis, the pentose phosphate pathway, and fatty acid metabolism were the enriched pathways among the A142-specific DEGs. In addition, 26 pathways were enriched among the common DEGs, including phenylalanine, glutathione, and cyanoamino acid metabolism, phenylpropanoid biosynthesis, flavonoid biosynthesis, starch and sucrose metabolism, and galactose metabolism.
Differentially expressed genes associated with auxin biosynthesis and signal transduction
The functional annotation of DEGs indicated that primary root development was mediated by pathways involving hormone metabolism and signaling. The enriched KEGG pathways for the DEGs between the two inbred lines were mainly related to plant hormone signal transduction. In addition, MapMan enrichment analyses identified functions associated with the metabolism of hormones, including auxin, CK, ABA, BR, GA, JA, and ethylene. Therefore, we profiled the changes in phytohormone concentrations in A39 and A142. The indole-3-acetic acid (IAA) concentrations in A39 and A142 were 46.89–52.42 and 32.50–40.68 ng·g-1 fresh weight, respectively (Fig. 5A). The IAA concentrations were significantly higher (P<0.05) in A39 than in A142 at all time points. To test the response of the two inbred lines to exogenous auxin treatment, various concentrations of NAA (0, 0.1, 0.5, 1, 2.5 and 5 nM) were applied to A39 and A142. The effect of exogenous auxin on root elongation was dose-dependent in both maize lines. Root elongation was enhanced under a low NAA concentration, but was inhibited under a high NAA concentration. Compared with A39, A142 was more sensitive to exogenous NAA. Application of 0.1 nM NAA increased the PRL and, furthermore, the PRL and LRL of A142 were partly rescued to A39 levels (Fig. 5B-D). A time course of root gravitropic curvature was compiled for the two lines. The A142 roots displayed faster rates of curvature after a 90º reorientation, compared with those of A39 (Fig. 5E). Significant differences in root angles were observed at 8 h and 24 h after 90º rotation (Fig. 5F). The ZR concentrations differed significantly (P<0.05) between the two lines at the S4 and S9 time points (Fig. 5A). No differences were observed in the BR concentrations of A39 and A142 at any time point (Fig. 5A). However, JA concentration differed significantly (P<0.05) between the two lines at the S1 and S4 time points (Fig. 5A).

Hormone concentrations in primary roots and the effect of exogenous NAA treatment on primary root development. (A) The IAA, ZR, BR, and JA concentrations of A39 and A142. The vertical bars represent the standard error of the mean (n=3). (B) Phenotypes of A39 and A142 seedlings treated with different concentration of NAA. Scale bars =5 cm. The primary root length (C) and lateral root length (D) measured from maize seedlings treated with different concentrations of exogenous NAA. Error bars indicate standard error. Different letters represent statistically different means (P<0.05) in a LSD post-hoc test. (E) The representative maize root images of A39 and A142 after 90º gravistimulation. Scale bars =1 cm. (F) The root angle of A39 (blue line) and A142 (red line). Error bars indicate standard error. Student’s t-test was used for statistical analysis. *, P<0.05.
To further investigate the involvement of auxin-related genes in the primary root development of A39 and A142, we analyzed the temporal expression patterns of DEGs associated with auxin biosynthesis and signal transduction (Fig. 6; Supplementary Table S4). Of the identified DEGs, 25 and 88 genes were related to auxin biosynthesis and signal transduction, respectively. Six gene families were involved in auxin biosynthesis (KEGG pathway: tryptophan metabolism). The expression patterns for these genes varied between A39 and A142. Five YUCCA (YUC) genes (ZmYUC6, ZmYUC4, ZmYUC2, Zm00001d005602, and ZmYUC9) were more highly expressed in A39 than in A142. The expression of these genes was higher at S1–S4 than at S5–S9. We identified five gene families (AUX1, AUX/IAA, ARF, SMALL AUXIN UP RNAS, SAUR; and GRETCHEN HAGEN 3, GH3) related to the auxin signal transduction pathway, as well as members of the PIN families. The AUX1 and PIN families include genes that encode the major auxin influx and efflux carriers. Four AUX1 genes (ZmAIC1, ZmAIC2, ZmAIC3, and ZmAIC4) and eight PIN genes (ZmPIN2, ZmPIN3, ZmPIN4, ZmPIN5, ZmPIN7, ZmPIN8, ZmPIN9, and ZmPIN11) were significantly differentially expressed between the two analyzed maize lines (P<0.05). Moreover, the expression of these genes differed between S1–S4 and S5–S9. Accordingly, auxin biosynthesis and signal transduction may influence primary root development.
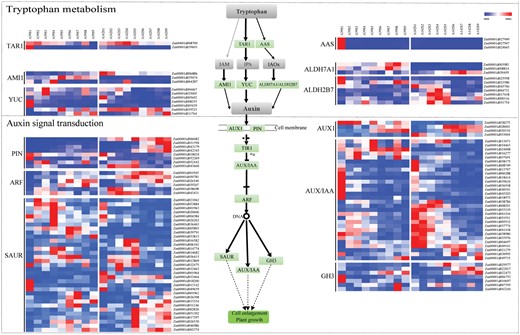
The DEGs related to auxin biosynthesis and signal transduction. Heatmap shows expression of DEGs related to auxin biosynthesis and signal transduction.
Differentially expressed genes related to the phenylpropanoid and flavonoid biosynthesis pathways
Flavonoids are a diverse group of phenolic compounds and are widely distributed among plants. Flavonoids display tissue-specific expression patterns and notably accumulate in the root elongation zone. Mutants that are defective in flavonoid biosynthesis exhibit a variety of root architecture phenotypes, indicating that flavonoids play important roles in regulating root growth and development (Buer et al., 2013). The present enrichment analyses confirmed that the phenylpropanoid and flavonoid pathways were significantly enriched among the DEGs. A total of 230 biochemicals were detected by LC-MS, including 23 with quantities that differed significantly at the S9 time point between A39 and A142 (P<0.05; Fig. 7A). These biochemicals were divided into the following 12 major categories: amino acids, phenylpropanoids, flavonoids, phenols, fatty acids, lipids, plant hormones, alkaloids, peptides, nucleotides, organic compounds, and other biochemicals. The L-phenylalanine, warfarin, hypoxanthine, lauric acid, and lysoPC (15:0) concentrations were significantly higher in A142 than in A39 (P<0.05). In contrast, the other biochemicals were more abundant in A39 than in A142.
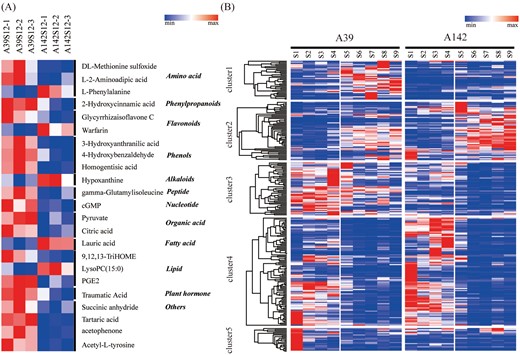
The DEGs related to phenylpropanoid and flavonoid pathways. (A) Comparison of differential metabolites between A39 and A142 at S9 stage. The concentration of metabolites are shown by the shade of colors. (B) All DEGs related to phenylpropanoid and flavonoid biosynthesis pathways. According to the expression patterns, these genes were divided into five clusters.
A total of 261 genes related to phenylpropanoid and flavonoid biosynthesis were differentially expressed significantly (P<0.05) between A39 and A142 (Fig. 7B; Supplementary Table S5). These genes encoded major enzymes in the phenylpropanoid and flavonoid biosynthesis pathways, including PAL, 4-coumarate-CoA ligase (4CL), chalcone isomerase, chalcone synthase (CHS), flavonol synthase, phlorizin synthase (PGT1), and POD. We divided these genes into five clusters based on their expression patterns. These results indicated that the genes were differentially expressed significantly between the two maize inbred lines, but also between root developmental stages, implying that phenylpropanoid and flavonoid pathways may be involved in primary root development.
A quantitative real-time PCR (qRT–PCR) analysis of nine genes associated with the auxin and flavonoid pathways at four time points (S1, S4, S5, and S9) were conducted to validate the RNA-seq results. The Pearson’s correlation coefficient (r) for each gene between the RNA-seq and qRT–PCR analyses ranged from 0.831 to 0.988 (Supplementary Fig. S4). The expression of the tested genes revealed by qRT–PCR were significantly correlated with those observed in the RNA-seq analysis (P<0.05).
Identification of gene co-expression network modules highly associated with PRL in maize inbred lines
A weighted gene co-expression network analysis (WGCNA) was conducted for all DEGs to thoroughly characterize the expression of genes associated with primary root development. A total of 21 vivid modules (comprising 18 459 genes) were identified by WGCNA (Fig. 8A; Supplementary Table S6). A module–line correlation analysis revealed four modules (blue, black, brown, and greenyellow) significantly associated with the two inbred lines (Fig. 8B). The ‘blue’ and ‘black’ modules were significantly positively correlated with A39 [r=0.92 (P=5 × 10⁻⁸) and r=0.58 (P=0.01), respectively]. The genes in these modules were more highly expressed in A39 than in A142. In addition, the genes in the ‘blue’ module were mainly associated with metabolic pathways, the biosynthesis of secondary metabolites, and sulfur metabolism, whereas the genes in the ‘black’ module were primarily involved in glycerolipid, glutathione, and fatty acid metabolism, phenylpropanoid biosynthesis, and peroxisomes. In contrast, the ‘brown’ and ‘greenyellow’ modules were significantly positively correlated with A142 [r=0.96 (P=6 × 10⁻¹⁰) and r=0.63 (P=0.006), respectively]. The enriched pathways among the genes in the ‘brown’ module were associated with carbon metabolism, the pentose phosphate pathway, biosynthesis of amino acids, fatty acid biosynthesis, and secondary metabolism. The genes in the ‘greenyellow’ module were mainly involved in zeatin biosynthesis, nitrogen metabolism, selenocompound metabolism, photosynthesis, and metabolic pathways (Supplementary Table S7).
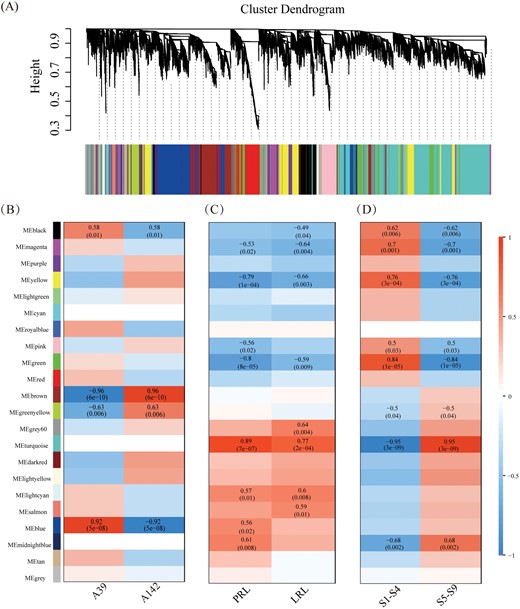
Weighted gene co-expression network analysis (WGCNA) of all DEGs. (A) Hierarchical cluster tree shows twenty-one modules of co-expressed genes. The lower heatmap shows modules in designated colors. The module grey is for unassigned genes. Heatmaps showing the correlation of module-line (B), module-trait (C) and module-stage (D). The Pearson correlation coefficient and P values of significant modules are given.
A module–trait correlation analysis indicated that the ‘blue’ module was positively associated with PRL, whereas the ‘black’ module was negatively associated with LRL (Fig. 8C, D). To identify candidate genes related to PRL and LRL, the top ten genes regarding maximum edge number (degree) and intra-modular connectivity (KME) were considered to be hub genes (Supplementary Table S8). In the ‘blue’ module (Fig. 9A), the functional annotation of seven hub genes suggested that these genes encoded the following proteins: Ras-related protein (Zm00001d039546), nucleic acid-binding protein (Zm00001d047690), peptidase M20/M25/M40 family protein (Zm00001d004637), nuclear pore complex protein (Zm00001d036825), adrenodoxin oxidoreductase (Zm00001d053301), pentatricopeptide repeat- containing protein (Zm00001d021708), and CLIP-associated protein (Zm00001d007821). These hub genes were highly correlated with other genes (weight >0.15). In the correlation network, Zm00001d053301 was highly correlated with the following six genes related to auxin biosynthesis and signal transduction: ZmIAA42, two genes encoding a SAUR family protein (Zm00001d005803 and Zm00001d039791), two aldehyde dehydrogenase family 7 members (Zm00001d008814 and Zm00001d003983), and one amidase-encoding gene (Zm00001d039474; Fig. 9B). In addition, Zm00001d053301 was also correlated with the following seven genes encoding enzymes active in the phenylpropanoid and flavonoid pathways: POD (Zm00001d019387), two beta-glucosidase genes (Zm00001d033651 and Zm00001d050490), CAD (Zm00001d046322), 4CL (Zm00001d015417), flavonoid 3’-monooxygenase (Zm00001d050955), and CHS (Zm00001d052916). The hub genes were situated at the network nodes and may be expressed upstream of metabolic pathway genes. Changes to the expression of hub genes may modulate the expression of other genes.
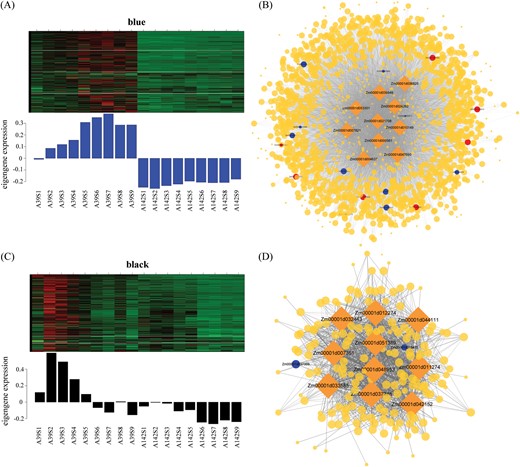
Expression profile and co-expressed gene network of modules associated with PRL and LRL between maize inbred lines. (A) Heatmap shows the expression profile of all genes in ‘blue’ module. The lower bar graph shows the consensus expression pattern of the co-expressed genes in ‘blue’ module. (B) Co-expressed network of genes in ‘blue’ module. The rhombic nodes represent hub genes. The blue nodes represent genes related to phenylpropanoid and flavonoid pathways, and the red nodes are genes related to auxin biosynthesis and signal transduction. The size of the nodes indicates the degree of connectively of the genes. Edges (weight ≥0.15) represent known interactions between hub genes and other genes. (C) The expression profile and (D) co-expressed network in ‘black’ module.
In the ‘black’ module for lateral root development, the ten hub genes encoded synthases and transferases (Supplementary Table S8). Seven of the hub genes were correlated with the same two genes associated with phenylpropanoid and flavonoid biosynthesis, namely Zm00001d037359 and Zm00001d019478 (Fig. 9D).
Gene co-expression network modules highly associated with PRL and LRL during primary root development
A module-stage correlation analysis revealed eight modules that were relatively highly correlated (P<0.05) with stages of primary root development (Fig. 8D). The expression patterns for the genes in these modules exhibited the opposite trends in the S1–S4 and S5–S9 stages. An analysis of the module–trait correlation indicated that seven modules were highly correlated with PRL and/or LRL (Figs 8D; 10A), of which four modules (magenta, yellow, green, and turquoise) were significantly correlated with PRL and LRL. The ‘pink’ module was negatively correlated with PRL, whereas the ‘midnightblue’ module was positively correlated with PRL (Supplementary Fig. S5). Many functional categories were enriched among the genes in these modules. The genes in the ‘yellow’ module mainly affected metabolic pathways, the biosynthesis of secondary metabolites, carbon metabolism, tryptophan metabolism, phenylalanine metabolism, phenylpropanoid biosynthesis, and plant hormone signal transduction. The enriched pathways among the genes in the ‘turquoise’ module were associated with metabolic pathways, biosynthesis of secondary metabolites, carbon metabolism, and biosynthesis of amino acids. The genes corresponding to the ‘magenta’ module were primarily involved in metabolic pathways, the biosynthesis of secondary metabolites, phenylpropanoid biosynthesis, and glycerophospholipid metabolism. In the ‘green’ module, metabolic pathways, biosynthesis of secondary metabolites, biosynthesis of amino acids, starch and sucrose metabolism, phenylalanine metabolism, phenylpropanoid biosynthesis and plant hormone signal transduction, citrate cycle (TCA cycle), as well as phenylalanine, tyrosine, and tryptophan biosynthesis, were the main enriched pathways (Fig. 10B; Supplementary Table S7).

Expression profile of the modules highly associated with PRL and LRL during primary root development. (A) The expression profile of the co-expressed genes in ‘yellow’, ‘turquoise’ ‘magenta’ and ‘green’ modules. (B) The KEGG pathways enriched in these modules.
The expression of the genes in the ‘turquoise’ module was higher between S5 and S9 than from S1 to S4. The ten functionally annotated hub genes included four TF-encoding genes (ZmGATA26, ZmHSF2, ZmbHLH84, and ZmNAC124), and genes encoding ATP-dependent DNA helicase (Zm00001d007417), arogenate dehydrogenase (Zm00001d046168), a HSP20-like chaperone superfamily protein (Zm00001d033484), a homeodomain leucine zipper family IV protein (Zm00001d018225), a nuclear pore complex protein (Zm00001d010684), and Zm00001d030698. In the correlation network (Fig. 11A), the hub genes were highly correlated with the following 14 genes related to auxin biosynthesis and signal transduction: indole-3-pyruvate monooxygenase (ZmYUC8), five genes encoding auxin-responsive proteins (ZmIAA10, ZmIAA33, Zm00001d052188, Zm00001d048233, and Zm00001d033616), two auxin influx carrier genes (ZmAIC3 and ZmAIC1), three auxin response factor genes (ZmARF4, ZmARF16, and ZmARF29), two genes encoding SAUR family proteins (Zm00001d015354 and Zm00001d002374), and one gene encoding a GH3 family protein (ZmAAS9). Moreover, 19 genes involved in phenylpropanoid and flavonoid biosynthesis were also highly correlated with the hub genes. These genes encoded important enzymes for phenylpropanoid and flavonoid biosynthesis, including CADs (Zm00001d049169 and Zm00001d002250), 4CL (Zm00001d046915), PAL (Zm00001d003016), flavonol-3-O-glucoside L-rhamnosyltransferase (Zm00001d042740), PGT1 (Zm00001d038765), ten PODs (Zm00001d041827, Zm00001d002004, Zm00001d028349, Zm00001d040578, Zm00001d047066, Zm00001d043938, Zm00001d016443, Zm00001d030002, Zm00001d018619, and Zm00001d046186), and beta-glucosidases (Zm00001d033649, Zm00001d043110, and Zm00001d038271).

Network of the hub genes in the modules associated with PRL and LRL. The gene correlation network of the ‘turquoise’ (A), ‘yellow’ (B), ‘green’ (C) and ‘magenta’ (D) modules. The top ten hub genes in these modules and edge weight higher than 0.15 are visualized by Cytoscape.
In the ‘yellow’ module, the proteins encoded by the seven functionally annotated hub genes were as follows: 3-hydroxyisobutyryl-CoA hydrolase (Zm00001d043490), anthranilate synthase (Zm00001d033788), O-fucosyltransferase family protein (Zm00001d046182), NAC domain-containing protein (Zm00001d043921), homocysteine methyltransferase (Zm00001d013644), acyl-CoA oxidase (Zm00001d042884), and spermidine synthase (Zm00001d053404). In the correlation network, six genes corresponded to auxin biosynthesis and signal transduction, whereas 18 genes were related to the phenylpropanoid and flavonoid pathways (Fig. 11B). These genes included three encoding auxin-responsive proteins (ZmIAA18, ZmIAA28, and ZmIAA11), two 4CL genes (ZmKNOX1 and Zm00001d027711), two CAD genes (Zm00001d020401 and ZmBM1), two HCT genes (ZmHCT6 and ZmHCT3), and one PGT1 gene (Zm00001d043752). The Zm00001d027679 gene, rootless concerning crown and seminal roots 1 (rtcs;Taramino et al., 2007), was highly correlated with five hub genes (Zm00001d033788, Zm00001d017845, Zm00001d001989, Zm00001d043490, and Zm00001d046182).
In the ‘green’ module, nine hub genes were functionally annotated. In addition, ZmPAL9 (Zm00001d017275), which encodes the PAL enzyme that catalyzes the first step of the phenylpropanoid pathway, was identified as a central hub gene in this module (Fig. 11C). In the correlation network, ZmPAL9 was highly correlated with 210 genes, of which ten are involved in auxin biosynthesis and signal transduction, or the phenylpropanoid and flavonoid pathways. These ten genes included two encoding auxin-responsive proteins (ZmIAA8 and ZmIAA9), ZmHCT1, ZmBM3, a caffeoyl-CoA O-methyltransferase gene (Zm00001d036293), a ferulate-5-hydroxylase gene (Zm00001d013862), and four POD genes (Zm00001d021965, Zm00001d009373, Zm00001d025402, and Zm00001d040364).
Regarding the ‘magenta’ module, nine hub genes were annotated as transferase and kinase genes encoding the following proteins: tubulin alpha (Zm00001d021891), peptide-O-fucosyltransferase (Zm00001d006640), phosphoribosyltransferase family protein (Zm00001d002939), glycosyltransferase family 61 protein (Zm00001d040075), protein kinase superfamily protein (Zm00001d028386), putative leucine-rich repeat receptor-like protein kinase family protein (Zm00001d048390), RNA-binding protein (Zm00001d037209), protein enhanced disease resistance (Zm00001d014641), and POD (Zm00001d022458). The POD encoded by Zm00001d022458 catalyzes the final reaction of the phenylpropanoid pathway. Moreover, Zm00001d022458 was highly correlated with 21 genes, including two genes (Zm00001d010064 and Zm00001d041168) related to phenylpropanoid biosynthesis (Fig. 11D). In addition, four genes involved in the phenylpropanoid and flavonoid pathways were highly correlated with other hub genes, including two POD-encoding genes (Zm00001d018618 and Zm00001d020808), one gene encoding a beta-glucosidase (Zm00001d048099), and one PGT1-encoding gene (Zm00001d012781).
Gene mapping via QTL-seq
To assess the genetic basis of primary root development, an F2 population comprising 635 plants was generated from the cross between A39 and A142. The frequency distribution of PRL among the F2 plants revealed continuous variation and an almost normal distribution, suggesting that PRL is a quantitatively inherited trait (Fig. 12A). We selected 50 plants with a long primary root (highest bulk) as well as 50 plants with a short primary root (lowest bulk) from the F2 population, to produce two RNA pools. The subsequent Illumina high-throughput sequencing generated 2177 and 2339 Mb clean bases in the highest and lowest bulks, respectively. In addition, 91.82% and 86.51% of the reads from the lowest and highest bulks, respectively, were mapped to the B73 reference genome (RefGen_V4). We identified 840 210 single nucleotide polymorphisms (SNPs) between the lowest and highest bulks. To detect SNPs associated with PRL, we calculated Δ(SNP index) and G prime based on the QTL-seq data to integrate the SNP index values of the two bulks. Six QTL were identified in the 95% confidence interval (Fig. 12B; Supplementary Table S9).
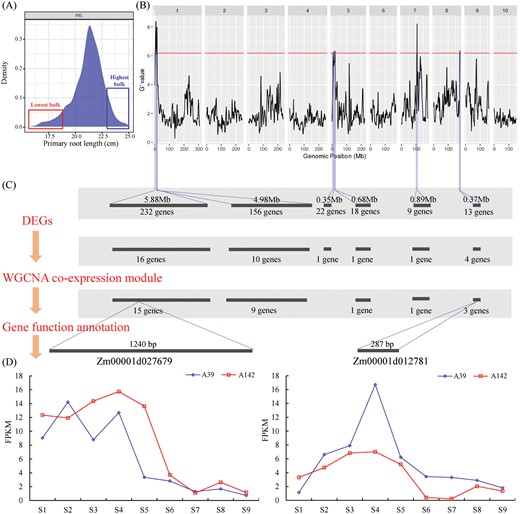
Identification of candidate genes by global transcriptome, coexpression network and QTL-seq. (A) Frequency distribution of primary root lengths of 635 individuals in F2 population. The x-axis corresponds to the PRL. We selected 50 shorter F2 progenies to make lowest bulk and 50 longer progenies to make highest bulk. (B) G value plot of maize genome with 95% statistical confidence intervals by QTL-seq. (C) The candidate genes were identified by integrating DEGs between lowest bulk and highest bulk, the WGCNA co-expression modules and gene function annotation. (D) The expression of the two candidate genes (Zm00001d027679 and Zm00001d012781) in A39 and A142, at nine time-points.
Two QTL were identified in the 2.78–8.66 (qPRL1.1) and 10.52–15.5 (qPRL1.2) Mb regions on chromosome 1, with 232 and 156 annotated genes located in these intervals, respectively. These annotated genes included 16 and ten DEGs between the highest and lowest bulks, respectively. Two QTL were detected on chromosome 5, with the 0.35 (qPRL5.1) and 0.68 (qPRL5.2) Mb intervals containing 22 and 18 functionally annotated genes, respectively. Each interval included one gene that was differentially expressed between the two bulks. One QTL (qPRL7) was identified in a 0.89 Mb interval on chromosome 7. This interval contained nine annotated genes, only one of which was differentially expressed between the two bulks. We also identified one QTL (qPRL8) in the 180.53–180.90 Mb region of chromosome 8. Of the 13 annotated genes in this region, four were DEGs. A total of 29 genes were detected in the co-expression modules. On the basis of annotated functions, two genes (Zm00001d027679 and Zm00001d012781) were identified as promising candidates (Fig. 12C).
The rtcs (Zm00001d027679) gene in qPRL1.1 encodes a member of the plant-specific LATERAL ORGAN BOUNDARIES domain (LBD) family of TFs (Taramino et al., 2007). The maize rtcs mutant forms a primary root with lateral roots but lacks seminal and crown roots (Hetz et al., 1996). In the current study, the rtcs gene was more highly expressed between the S1 and S5 stages than during the last four stages, and its expression differed significantly (P<0.05) between A39 and A142 (Fig. 12D). The candidate gene Zm00001d012781 in qPRL8 encodes phlorizin synthase (PGT1), which functions in a branch of the flavonoid biosynthesis pathway. Expression of Zm00001d012781 increased from S1 to S4, after which it decreased. In both maize inbred lines, Zm00001d012781 expression peaked at the S4 stage. We predict that Zm00001d012781 is involved in lateral root initiation.
Discussion
Transcriptome-based identification of genes related to primary root development
The primary root is the basic component of the maize root system, and it is crucial for early seedling growth and survival. In this study, we investigated the dynamic transcriptome-level changes during maize primary root development at nine time points within a 12-day period (Fig. 1A). The RNA-seq data were highly reproducible for both maize inbred lines and at all time points (Fig. 2A). The PCA revealed distinct gene expression changes between stages (Fig. 2B). Functional analysis of the DEGs clarified the differences between the two analyzed maize inbred lines across the nine time points. Some of the DEGs encoded TFs belonging to the bHLH, MYB, NAC, and WRKY families (Fig. 3B). Previous studies have proved that TFs are key regulators of root development. For example, Devaiah et al. (2007) identified WRKY75 as the first member of the WRKY TF family involved in regulating Arabidopsis root development. The OsbHLH120 gene, which encodes a bHLH TF, controls root length (Li et al., 2015). In addition, OsMYB1, which encodes a R2R3-type TF, regulates primary root elongation (Gu et al., 2017). The AtMYB93 TF is a negative regulator of lateral root development in Arabidopsis (Gibbs et al., 2014). It was also reported that OsNAC2, which encodes a NAC TF, increases the PRL (Mao et al., 2020). T. Wang et al. (2019) confirmed that overexpression of PeGATA26 significantly decreases the PRL of transgenic Arabidopsis plants.
To characterize more precisely the process underlying primary root development, we performed a co-expression network analysis of all DEGs. We identified ZmGATA26 (Zm00001d009668), ZmNAC124 (Zm00001d046126), and ZmbHLH84 (Zm00001d027859) as three TF-encoding hub genes in the network for the ‘turquoise’ module (Fig. 11A). These genes, which were significantly correlated with PRL and LRL, were more highly expressed between S5 and S9 than between S1 and S4. Thus, the TFs encoded by these genes may control primary and lateral root development. However, the specific regulatory mechanism remains to be experimentally verified.
Crosstalk between the auxin and cytokinin pathways in the mechanisms controlling lateral root initiation
It is well known that auxin plays a crucial role in root development. Previous studies have thoroughly elucidated the complex relationship between auxin and root development (Saini et al., 2013). Auxin biosynthesis genes affect all aspects of root development. Overexpression of TaTAR2.1-3A in Arabidopsis causes auxin to accumulate at the primary root tip, lateral root tip, and lateral root primordia, while also increasing the PRL (Shao et al., 2017). The TAA1 gene, which encodes a tryptophan aminotransferase, regulates local auxin biosynthesis in roots and inhibits root growth in Arabidopsis (Yang et al., 2014). Plants expressing antisense YUCCA1 (OsYUC1) exhibit inhibited root formation and elongation (Yamamoto et al., 2007). Auxin transport and signal transduction are crucial for root development (Peret et al., 2009; Saini et al., 2013; Meng et al., 2019). Teixeira and Tusscher (2019) precisely described the auxin signaling molecules involved in all stages of lateral root development. In the present study, quantification of phytohormones showed that the IAA content in A39 was higher compared with A142 (Fig. 5A). Interestingly, A142 was more sensitive to exogenous NAA application, The PRL of A142 could be partially restored to that of A39 under low doses of NAA (Fig. 5B). Sun et al. (2020) found that Ye478 was more sensitive to low NAA application even if auxin content in Ye478 was lower than Wu312. The dynamic change of NAA treatment was consistent with the present study. Furthermore, A142 responded faster to a gravity vector compared with A39 (Fig. 5E, F). Substantial differences were observed in the transcription of the DEGs between A39 and A142 during the S1–S4 and S5–S9 stages. The KEGG pathways enriched among the DEGs were auxin biosynthesis and signal transduction, suggesting that these two pathways are important to primary and lateral root development. We detected 25 and 88 genes involved in auxin biosynthesis and signal transduction, respectively (Fig. 6). These genes were differentially expressed between two maize inbred lines, as well as between primary root development stages (S1–S4 and S5–S9). Furthermore, we detected 29 highly correlated genes in modules significantly associated with PRL and LRL. Additionally, we identified rtcs (Zm00001d027679) by integrating WGCNA and QTL-seq data (Fig. 12). The rtcs gene, which encodes a LATERAL ORGAN BOUNDARIES (LOB) domain protein, is an auxin-responsive gene (Taramino et al., 2007).
In addition to auxin, CK also regulates root development (Laplaze et al., 2007; Liu et al., 2017). These two phytohormones have antagonistic effects on root development (Chaiwanon and Wang, 2015; Jing and Strader, 2019). Auxin biosynthesis, transport, and signaling promotes root development, whereas CK inhibits the auxin response by disrupting auxin transport, thereby restricting lateral root development (Laplaze et al., 2007). Accordingly, the complex crosstalk between the auxin and CK pathways is a critical determinant of root development. Previous evaluation of this crosstalk revealed multiple direct or indirect links between the auxin and CK pathways (Liu et al., 2017; Pacifici et al., 2015). For example, SHY2 functions in both auxin and CK pathways (El-Showk et al., 2013). Additionally, as the upstream integrator of auxin and CK signals, OsNAC2 directly targets the promoters of auxin- and CK-related genes to modulate rice root development (Mao et al., 2020).
In the current study, auxin and CK concentrations exhibited opposite trends in the two maize inbred lines, suggesting that these phytohormones may have contrasting regulatory effects on primary root development. A total of 25 and 21 genes involved in CK signal transduction and biosynthesis (zeatin biosynthesis), respectively, were differentially expressed between A39 and A142 during primary root development. To investigate the link between auxin and CK, we constructed transcriptional regulatory networks in the modules significantly associated with PRL and LRL (Fig. 8C). Genes related to the auxin and CK pathways were highly correlated with hub genes in the ‘blue’ and ‘turquoise’ modules. The Zm00001d019555 gene, encoding a type-A ARR3 protein, was detected in the ‘blue’ module (Supplementary Fig. S6A). Seven hub genes (Zm00001d036825, Zm00001d024262, Zm00001d010149, Zm00001d053301, Zm00001d047690, Zm00001d039546, and Zm00001d004637) were expressed upstream of one CK-related gene (Zm00001d019555) and six auxin-related genes (Zm00001d024008, Zm00001d008814, Zm00001d039791, Zm00001d005803, Zm00001d039474, and Zm00001d003983). The ‘turquoise’ module included one CK-related gene, Zm00001d023242, which encodes a type-A ARR9 protein (Supplementary Fig. S6B). The hub gene Zm00001d033484, encoding an HSP20-like chaperone superfamily protein, was expressed upstream of Zm00001d023242 and three auxin-related genes (Zm00001d015354, Zm00001d048233, and Zm00001d052188). These results suggested that the hub genes functioned as the link between the auxin and CK pathways. The encoded proteins may directly up-regulate the expression of genes related to auxin and CK, thereby regulating auxin and CK transport and distribution, with implications for root development. These findings provide new insights into how auxin and CK coordinately regulate root development.
Importance of flavonoid-regulated auxin transport in developing roots
Flavonoids form a diverse class of secondary metabolites that inhibit or promote plant development. Notably, flavonoids can influence the polar transport of auxin, leading to modified root growth (Franco et al., 2015). The biological activities of flavonoid components affect the acropetal pattern and lateral movement of auxin during root development (Krishnamurthy and Rathinasabapathi, 2013). Flavonoids are produced via the phenylpropanoid pathway. The accumulation of these compounds in the root elongation zone modulates auxin transport and influences the architecture of Arabidopsis plants (Buer et al., 2013). Mutations in the flavonoid pathway result in abnormal lateral root initiation patterns. The tt4 mutant, which harbors a mutation in the gene encoding CHS involved in flavonoid biosynthesis, is unable to accumulate flavonoids, leading to increased secondary root development (Brown et al., 2001). Tan et al. (2019) determined that GA promotes root growth by directly inhibiting flavonol biosynthesis. Xu et al. (2019) revealed that the flavonoid-induced transcriptional changes to genes involved in auxin signaling decrease cell elongation in the elongation zone of rice roots. Maloney et al. (2014) proved that flavonols modulate auxin transport in tomato to positively and negatively affect lateral root formation and root hair formation, respectively. However, relatively few studies have investigated flavonoid-regulated root development in maize.
In the current study, KEGG and MapMan enrichment analyses indicated that some of the DEGs between A39 and A142 during primary root development are involved in phenylpropanoid and flavonoid biosynthesis (Fig. 3C, D). In the transcriptional network, we detected several genes associated with the phenylpropanoid and flavonoid biosynthesis pathways, including two genes identified as hub genes. The ZmPAL9 gene, which encodes a PAL, is expressed upstream of the two auxin-related genes (ZmIAA8 and ZmIAA9) in the ‘green’ module, implying that ZmPAL9 may regulate primary root growth by up-regulating the expression of ZmIAA8 and ZmIAA9. The POD-encoding Zm00001d022458 gene was detected as a hub gene in the ‘magenta’ module (Fig. 11D). Furthermore, we identified Zm00001d012781 as a candidate gene based on the integrated WGCNA and QTL-seq data (Fig. 12). This gene encodes PGT1, which is the key enzyme for phlorizin synthesis. The phlorizin biosynthesis pathway is a side branch of the phenylpropanoid pathway. Moreover, PGT1 glycosylates phloretin to produce phlorizin (Gosch et al., 2010b). Dare et al. (2017) suggested that auxin transport is altered in the phloretin-specific glycosyltransferase gene (UGT88F1) knockdown lines. Phlorizin substantially accumulates in apple trees (Malus spp.), whereas it has been detected at relatively low levels in certain other plant species (Gosch et al., 2010a). To the best of our knowledge, there are no reports regarding phlorizin in maize. The present results imply that PGT1 may be a critical regulator that modulates the phenylpropanoid pathway, and establishes appropriate auxin content and distribution to mediate primary root development in maize.
Supplementary data
The following supplementary data are available at JXB online.
Table S1. Primer sequences used for qRT–PCR analysis.
Table S2. Summary of read data generated, quality control and mapping on the B73 genome (RefGen_v4) for all samples.
Table S3. List of 27 050 genes with averaged FPKM among replicates ≥1 that were considered expressed.
Table S4. List of genes related to auxin biosynthesis and signal transduction.
Table S5. List of genes related to phenylpropanoid and flavonoid pathways.
Table S6. Module assignment and KME for the 18 459 genes selected for WGCNA.
Table S7. The KEGG pathway for genes in co-expression WGCNA modules.
Table S8. Hub genes in co-expression WGCNA modules.
Table S9. The list of genes located within regions of the identified QTL.
Fig. S1. Root phenotype in 297 maize inbred lines.
Fig. S2. Global gene expression in A39 and A142.
Fig. S3. Pearson’s correlations between two biological replicates of each root sample.
Fig. S4. Correlation between expression profiles of nine tested genes revealed from RNA-seq and qRT–PCR.
Fig. S5. Network of the hub genes in ‘pink’ and ‘midnightblue’ modules.
Fig. S6. The crosstalk network between auxin and cytokinin.
Acknowledgements
This work was supported by grants from the National Key Technology Research and Development Program of Ministry of Science and Technology of the People’s Republic of China (2016YFD0100303), the National Natural Science Foundations (31972487 and 31902101), the Natural Science Foundations of Jiangsu Province (BK20180920), the Key Technology Research and Development Program of Jiangsu (BE2018325), and the project funded by the Priority Academic Program Development of Jiangsu Higher Education Institutions (PAPD).
Author contributions
CX, PL and ZY conceived and designed the study; YW, PL and CX designed the experiments; YW, HS and XY conducted experiments; YW, PL, HW, and YX analyzed the data; YW and PL wrote the paper. All the authors have read and approved the manuscript.
Conflict of interest
The authors declare that they have no conflicts of interest.
Data availability
The datasets supporting the results of this article are included within the article and its supplementary data. Raw reads of all samples have been deposited in the NCBI Sequence Read Archive (SRA, http:www.ncbi.nlm.nih.gov/sra/) under accession number SRP266689.

Comments