


Abstract
Aliphatic compounds on plant surfaces, called epicuticular waxes, are the first line of defense against pathogens and pests, contribute to reducing water loss and determine other important phenotypes. Aliphatics can form crystals affecting light refraction, resulting in a color change and allowing identification of mutants in their synthesis or transport. The present study discloses three such Eceriferum (cer) genes in barley – Cer-c, Cer-q and Cer-u – known to be tightly linked and functioning in a biochemical pathway forming dominating amounts of β-diketone and hydroxy-β-diketones plus some esterified alkan-2-ols. These aliphatics are present in many Triticeae as well as dicotyledons such as Eucalyptus and Dianthus. Recently developed genomic resources and mapping populations in barley defined these genes to a small region on chromosome arm 2HS. Exploiting Cer-c and -u potential functions pinpointed five candidates, of which three were missing in apparent cer-cqu triple mutants. Sequencing more than 50 independent mutants for each gene confirmed their identification. Cer-c is a chalcone synthase-like polyketide synthase, designated diketone synthase (DKS), Cer-q is a lipase/carboxyl transferase and Cer-u is a P450 enzyme. All were highly expressed in pertinent leaf sheath tissue of wild type. A physical map revealed the order Cer-c, Cer-u, Cer-q with the flanking genes 101kb apart, confirming they are a gene cluster, Cer-cqu. Homology-based modeling suggests that many of the mutant alleles affect overall protein structure or specific active site residues. The rich diversity of identified mutations will facilitate future studies of three key enzymes involved in synthesis of plant apoplast waxes.
Introduction
The outermost surface of the plant's cuticular apoplast consists of one or more of a variety of compounds. Frequently these are a mixture of very long chain aliphatics that can include various combinations of hydrocarbons, ketones, primary and secondary alcohols, aldehydes, esters and free fatty acids. They originate from 16 and 18 carbon fatty acyl chains synthesized in plastids which are transported to the endoplasmic reticulum (ER) where they can be further elongated by a fatty acyl elongase (FAE) complex consisting of a β-ketoacyl-CoA synthase (KCS) that adds a new C2-unit plus three additional enzymes that remove the β-oxygen to give an acyl chain which can accept another C2-unit. Reiteration by the FAE complex gives 20–34 acyl chains (Fig. 1A), which can then enter either a decarb pathway giving odd chain wax aliphatics or a reductive pathway yielding those with even chains that together with the remaining fatty acyl chains are transported into and/or onto the plant surface where, in some instances, crystal structures are formed (Haslam and Kunst, 2013; Yeats and Rose, 2013; Lee and Suh, 2015).
![Two elongation pathways. (A). The β-ketoacyl-CoA synthase (KCS) moiety of a fatty acid elongase (FAE) complex in the endoplasmic reticulum adds C2-units to an acyl chain synthesized by fatty acid synthase (FAS) in a plastid. Both FAS and FAE are type II enzyme complexes as their components are coded for by distinct genes. Three subsequent reactions by the other FAE moieties [β-ketoacyl-CoA ketoreductase (KCR), β-hydroxyacyl-CoA dehydratase (HCD), β-enoyl-CoA reductase (ECR)] remove the β-oxygen. Reiteration yields C20-C34 acyl chains that serve as precursors of the reductive (R) and decarb (-C) derived FAE aliphatics. *, CoA. (B) Deduced elongation pathway giving rise to a carbon skeleton decorated with two oxygens. Addition of two C2-units to a β-ketoC18-CoA by a chalcone synthase (CHS)-like polyketide synthase (PKS) results in an acyl chain with four oxygens. That on the β-carbon is then removed by the successive action of a KCR, an HCD and an ECR. Six additional elongations of the FAE type results in a C32 acyl chain with oxygens on carbons 16 and 18. A decarb reaction yields the β-diketone, hentriacontan-14,16-dione.](https://oup.silverchair-cdn.com/oup/backfile/Content_public/Journal/jxb/67/9/10.1093_jxb_erw105/2/m_exbotj_erw105_f0001.jpeg?Expires=1750271445&Signature=UBIyZQ2flKZE7KsUhdVpwVezgB~vSPYkyTSkrUC2B-ChHjpNogTQ1wQwQgChN4vWsyPO5cwpvoqAI1Vr3r9Ob2ZH4bs1TeWxk-iSbhO8jlE9WlnloYlfU9pqMzKnNlq7xnpgfeCGWMe~bp99K~bSdI8XGjTH26HCD1rYZuGNp~YgGVm0mIULCmIKTgExhYzJxUN1FtYe-KqxaDKgsKIM7-JhHYf1b1neXWca3WyHK-qAgvQisMb~XVyFZd3WMCBbFF86AlsV7seRNB1UntVCKQzHUwj1VwolMGsGvHCrFHkWNVFcnqg0hn-r4mjkG77GjXnsNu-MnelkLfczSIN7KQ__&Key-Pair-Id=APKAIE5G5CRDK6RD3PGA)
Two elongation pathways. (A). The β-ketoacyl-CoA synthase (KCS) moiety of a fatty acid elongase (FAE) complex in the endoplasmic reticulum adds C2-units to an acyl chain synthesized by fatty acid synthase (FAS) in a plastid. Both FAS and FAE are type II enzyme complexes as their components are coded for by distinct genes. Three subsequent reactions by the other FAE moieties [β-ketoacyl-CoA ketoreductase (KCR), β-hydroxyacyl-CoA dehydratase (HCD), β-enoyl-CoA reductase (ECR)] remove the β-oxygen. Reiteration yields C20-C34 acyl chains that serve as precursors of the reductive (R) and decarb (-C) derived FAE aliphatics. *, CoA. (B) Deduced elongation pathway giving rise to a carbon skeleton decorated with two oxygens. Addition of two C2-units to a β-ketoC18-CoA by a chalcone synthase (CHS)-like polyketide synthase (PKS) results in an acyl chain with four oxygens. That on the β-carbon is then removed by the successive action of a KCR, an HCD and an ECR. Six additional elongations of the FAE type results in a C32 acyl chain with oxygens on carbons 16 and 18. A decarb reaction yields the β-diketone, hentriacontan-14,16-dione.
The presence of crystals on the apoplast surface contributes to the cuticle's phenotype, which can be altered by mutations interfering with their synthesis or transport to the cuticle surface. Such mutants in barley designated eceriferum (cer) have been assigned to more than 75 complementation groups (Lundqvist and Lundqvist, 1988). The three with the most mutations are cer-c, -q and -u with 215, 167 and 160 alleles, respectively, representing more than one quarter of the Nordic Genetic Resource Center cer mutant collection. The cer-c, -q and -u mutations affect the wax crystals on the uppermost leaf sheaths and exposed internodes plus the spikes (glumes and lemmas), but not those on the leaf blades. While in most cer-c and -q mutants the noted cuticle surfaces are bright green (non-glaucous) in contrast to the blue (glaucous) of the wild type, those of the cer-u mutants have an intermediate phenotype. Included in the cer mutant collection are 13 apparent multiple mutants encompassing all pairwise combinations as well as seven triples. Test crosses with one of the latter (cer-cqu.420) revealed that any pair were within 0.0012 map units of each other implying that they were very tightly linked, forming the Cer-cqu gene cluster (von Wettstein-Knowles and Søgaard, 1980).
Comparisons among the waxes of the wild-type and those on the respective cer-c, -q and -u apoplast surfaces revealed the presence of three additional types of aliphatics to those specified above, namely β-diketones, hydroxy-β-diketones and short esterified alkan-2-ols. In addition, the mutations did not affect the wax components derived from the KCS-FAE elongation system (von Wettstein-Knowles and Søgaard, 1980). β-diketones were first identified in Eucalyptus, Acacia, Dianthus and Festuca (Horn and Lamberton, 1962), and shortly thereafter associated with long thin, crystalline tubes on the glaucous leaf surfaces (Horn et al., 1964). A comprehensive survey of the β-diketones and their derivatives (hydroxyl- and oxo-β-diketones) correlated with wax ultrastructure in the Triticeae revealed their widespread distribution in this tribe (Baum et al., 1980; Tulloch et al., 1980). β-diketones have also been identified in Buxus (Dierickx, 1973), Rhododendron (Evans et al., 1975) and Hosta lancifolia waxes (Jenks et al., 2002). While the β-diketone aliphatics account for 50% of the wild-type spike wax load, they are absent if not dramatically reduced in the cer-c and -q mutants. In cer-u mutants the absence of hydroxy-β-diketones is accompanied by a compensatory increase of β-diketones (von Wettstein-Knowles, 1976). By comparison, the alkan-2-ol esters account for only ~3.7% of wild-type spike wax. They are, however, a predominant aliphatic in some cer-c mutants (von Wettstein-Knowles, 1971). Short esterified alkan-2-ols (C9–C17) are also found in some Eucalyptus waxes containing β-diketones (Horn et al., 1964). As in barley, the β-diketones in three Agropyron species are accompanied by esterified 2-ols (primarily C13 and C15) (Tulloch, 1983). In the absence of β-diketones, short esterified alkan-2-ols occur in sorghum leaf waxes (C9) and in some Papaver fruit capsule waxes (C11–C17) (von Wettstein-Knowles et al., 1984; Jetter and Riederer, 1996). With the exception of the Papaver waxes the above observations suggest an intimate biochemical relationship between β-diketone aliphatics and esterified alkan-2-ols.
The β-diketones noted above comprise C29–C33 homologs. Most frequently C31 predominates, accompanied by C29 and sometimes minor amounts of C33 homologs. Carbonyl positions can vary from 6,8 to 16,18 (von Wettstein-Knowles, 1986). In barley exploitation of cer mutants, radioactive precursor and inhibitor studies established that the oxygens are inserted into the carbon chains during elongation (Mikkelsen, 1979). This demonstrated that acyl chain elongation is carried out by a different system from the FAE one described above. The direction of elongation is opposite to that required for nomenclature (Fig. 1B). For example, the oxygens on carbons 14 and 16 of the predominating C31 homolog in barley correspond to carbons 16 and 18, respectively, during synthesis. By comparison, the associated esterified alkan-2-ols are much shorter, ranging from C9 to C17. The hydroxy groups of the esterified C13- and C15-2-ols in barley correspond to carbons 12 and 14 during synthesis, respectively (von Wettstein-Knowles, 1986).
That oxygens are present on carbons 16 and 18 during carbon skeleton formation of the β-diketones implies that the oxygen could have been on the β-carbon after the addition of a C2-unit to a growing acyl chain that was not removed from carbon 16 before the addition of the next C2-unit. This is the hallmark of polyketide synthases (PKSs; Fig. 1B). Should the same occur in the subsequent elongation then a second oxygen would be introduced on carbon 18. If followed by six elongations of the FAE type to give a C32 acyl chain, which is then subjected to a decarb step as in the synthesis of alkanes, the result would be the β-diketone, hentricontane-14,16-dione (Mikkelsen, 1979). PKSs are similar to FAS complexes except that they leave out one or more of the three reactions removing the β-oxygen after given elongation steps. While type I and II function as part of enzyme complexes, type III or chalcone synthase (CHS)-like PKSs are individual enzymes exhibiting substrate specificity, chain elongation and cyclization activities, all of which are attributable to the shape and size of the substrate binding pocket (Austin and Noel, 2003; Abe and Morita, 2010). That all three reactions to remove the β-oxygen are lacking in two elongation cycles of β-diketone skeleton formation suggests that a type III PKS may participate in their synthesis. Interestingly, in β-diketone synthesis only two successive elongations take place whereas most type III PKSs carry out three. Identifying the Cer-c, Cer-q and Cer-u genes would be a major step in determining if CER-C is indeed a CHS-like PKS and CER-U is a P450 hydroxylase as has been suggested (von Wettstein-Knowles, 2012) and would give a first indication as to the nature of CER-Q.
Materials and methods
Plant material and growth conditions
A set of barley cultivars Barke, Bonus, Bowman, Foma, Kristina, Maja, Morex and Quench; near-isogenic lines BW409 (carrying the gsh6.s allele of Cer-c), BW404 (gsh1.a allele of Cer-q) and BW411 (gsh8.ag allele of Cer-u); and eceriferum mutants (Supplementary Data, available at JXB online) were ordered from Nordic Genetic Resource Center, Alnarp, Sweden (www.nordgen.org, accessed 31 December 2015). BW409, BW404 and BW411 were each crossed to Bowman, Barke, Morex and Quench from which ten F2-mapping populations were produced (crosses BW404×Morex and BW411×Barke were unsuccessful). All plants and F2-mapping populations were planted in one liter pots and grown in a greenhouse at 18 °C under a cycle of 16-h light/8-h dark. Phenotyping was done by visual inspection of leaf sheaths at heading stage.
DNA extraction
Leaf segments were sampled and DNA extracted using published protocols (Pallotta et al., 2003) or the REDExtract-N-Amp™ Plant PCR Kit (Sigma Aldrich) using manufacturer's instructions.
PCR amplification and SNP marker analyses
Genetic mapping
PCR amplifications were performed according to the manufacturer's protocol by using REDExtract-N-Amp PCR ReadyMix. PCR was performed at 95 °C for 3min; at (95 °C for 45s, 52–62 °C for 45s; 72 °C for 90sec) ×34 cycles; and finally at 72 °C for 5min, and gradients were run to optimize annealing temperatures (Supplementary Data). PCR products were analyzed on 2% agarose gels and PCR products selected for sequencing were purified using the NucleoSpin Extract II Kit (Macherey-Nagel, REF 740609). Purified PCR products were sequenced by Eurofins (www.eurofins.com, accessed 31 December 2015). Restriction endonucleases used for SNP marker analyses were identified using the NEBcutter tool (www.neb.com, accessed 31 December 2015). PCR products were digested using one unit of the appropriate restriction enzyme for up to 3h, after which samples were loaded on 2% agarose gels. SNP marker 2_1377 was analyzed with BtsCI, 2_0563 with Tsp509I, 2_0724 with StuI, 3_1446 with BsaHI and 1_0718 with Hpy166II.
Candidate gene analysis
PCR was performed using Phusion® High-Fidelity DNA Polymerase (New England Biolabs; M0530) and recommended protocol [i.e. primer concentration 500nM, 200 µM dNTPs, at 98 °C for 3min; at (98 °C for 15s, 54.5-63 °C as specified in Supplementary Table S2 and in the following for 30s; 72 °C for 90 sec] ×40 cycles; 72 °C for 5 min]. Annealing temperature was calculated using the NEB calculator (http://tmcalculator.neb.com/#!/, accessed 31 December 2015). A 2391bp fragment containing MLOC_59804 was amplified using primer pair 59804-1-A and 59804-5-2 (63 °C); a 2215bp fragment containing MLOC_13397 was amplified with primers 13397-01-A and 13397-3-1 (61 °C); whereas five overlapping fragments across each exon were amplified for AK373499 (Supplementary Data). PCR products were visualized on 2% agarose gels, bands excised and the DNA recovered using Qiagen Gel Extraction kit (Cat. No. 28704). The BigDye® Terminator v3.1 Cycle Sequencing Kit (Cat. No. 4337456) was used to sequence the amplicons with overlapping primers (Supplementary Data).
Bioinformatics analysis of the Cer-cqu region
SNP marker sequences were checked at the PGSB barley genome database (http://pgsb.helmholtz-muenchen.de/plant/barley, accessed 31 December 2015). SNP sequence positions and their corresponding Morex contigs were searched at the IPK barley BLAST server (http://webblast.ipk-gatersleben.de/barley/viroblast.php, accessed 31 December 2015). A list of all putative genes in the region between SNP marker 1_0718 and 1_1059 were found by searching the Barlex Draft Genome Explorer (http://barlex.barleysequence.org, accessed 31 December 2015). Six candidate gene models were selected based on possible gene function and were selected across the region. DNA sequences were analyzed with BioEdit (http://www.mbio.ncsu.edu/bioedit, accessed 31 December 2015), and the NCBI and Phytozome BLAST tools. Multiple polypeptide sequence alignments were performed by the Multiple Sequence Alignment program Clustal Omega (http://www.ebi.ac.uk/Tools/msa/clustalo, accessed 31 December 2015).
BAC extraction, library preparation and sequencing
BAC HVVMRXALLrA0066C06 was identified at Centre National de Ressources Génomiques Végétales (CNRGV) Toulouse in a BAC library of barley cultivar Morex (Schulte et al., 2011) via PCR using the primer pair 59804_2_F and 59804_2_R (Supplementary Data). Single colonies were picked and plasmid DNA extracted using Nucleobond Xtra Midi Kit from Macherey Nagel (Cat. No. 740410.100). The plasmid DNA (2 µg) was pooled with additional BAC clones and a single library was generated from this pooled DNA (40 µg) using the standard PacBio library preparation protocol (10kb libraries). This library was sequenced in one PacBio RS II SMRT Cell using the P6 polymerase in combination with C4 chemistry at the Institute for Genomic Medicine (IGM) in San Diego, USA.
BAC assembly and annotation
The BAC assembly was performed following the HGAP workflow (https://github.com/PacificBiosciences/Bioinformatics-Training/wiki/HGAP, accessed 31 December 2015). The raw data were first cleaned from Escherichia coli contamination and low quality reads (read quality <0.80 and read length <500bp). The vector sequence (pSMART BAC 2.0) was cleaned after the preassembly step of the workflow. The assembly resulted in a single contig of 181kb with a mean coverage of 325× at a mean quality value of 48.54. The size of the BAC was estimated to be 180kb using gel electrophoresis, which agrees with the size of the assembly. The size of the BAC is larger than the average BAC insert size of this library (92kb), but consistent with the high variation in insert size found in this library (see Fig. 1 in Schulte et al., 2011). The assembly was deposited in GenBank (accession number KU721941).
Contigs were first annotated for repetitive regions using the Triticeae Repeat Sequence Database (TREP) as well as the NCBI Nucleotide collection (nr/nt). Transposable elements were manually annotated to precisely define their features including target site duplications, long terminal repeats and short inverted terminal repeats. Regions with no hits to these repeat databases were further assessed using the Fgenesh gene prediction algorithm; the resulting predicted proteins were compared to the NCBI non-redundant protein database using blastP. Only one of the putative predicted proteins (Hv_66C06_HlyIII) had significant hits to previously annotated proteins.
MLOC_12151/AK373499 gene model analysis
Candidate gene MLOC_12151 was predicted to start at the edge of a genomic contig (morex_contig_1562667), suggesting that the gene model could possibly be incomplete. A full-length cDNA, AK373499, with sequence similarity of 99.3% (1219/1227) to MLOC_12151 was identified (Matsumoto et al., 2011). This cDNA has an additional exon compared to MLOC_12151 and was sequenced from barley cultivar ‘Haruna Nijo’, which explains the difference to the Morex sequence. A BLAST analysis showed that the next best hit for AK373499 after MLOC_12151 has a sequence similarity of 84%, suggesting that AK373499 is allelic to MLOC_12151. This was further supported by the BAC sequence assembly and the RNA-seq transcriptome data, which suggests that the longer gene model (AK373499) is the correct one. For this reason AK373499 instead of MLOC_12151 was used throughout.
RNA-Seq analysis
The publicly available dataset PRJEB12101 was obtained from the NCBI short read archive. A cDNA reference of Morex was obtained from the EnsemblPlants website (Hordeum_vulgare.082214v1.29.cdna.all.fa). As detailed above, the cDNA sequence of MLOC_12151 was exchanged for the full-length cDNA sequence of AK373499 in the reference and also added the sequence of the newly predicted gene Hv_66C06_HlyIII. The kallisto program (v-0.42.3) was used to build an index (default settings), map the sequence reads to the modified cDNA reference (default settings) and the accompanying program sleuth was used to quantify transcript abundance using 100 bootstraps (default settings).
Analysis of the CER-C, CER-Q and CER-U proteins
Phylogenetic analysis:
The barley MLOC_59804, MLOC_13397 and AK373499 proteins were used as queries against the Phytozome and EnsemblPlants databases for orthologous proteins via blastp. Specifically, the Phytozome database was queried for proteins from Brachypodium distachyon, Brassica rapa, Eucalyptus grandis, Medicago truncatula, Oryza sativa, Panicum virgatum, and Zea mays. The EnsemblPlants database was queried for proteins from Aegilops tauschii, Arabidopsis thaliana, Hordeum vulgare, Musa acuminata, Setaria italica, Sorghum bicolor, Triticum aestivum and T. urartu. An unrelated barley protein (MLOC_66074; Photosystem I reaction center subunit III) was added to each tree to act as a root. The protein sequences were aligned using ClustalOmega (default settings) and a neighbor-joining tree was constructed using ClustalW2 (default settings; www.ebi.ac.uk/Tools/msa/clustalo, accessed 31 December 2015). Each tree was downloaded as a text file in Newick format and loaded into the Fig Tree program (v.1.4.2) for visualization.
Modeling
Models of the predicted protein sequences were generated by comparative modeling using the ROBETTA web-server (http://robetta.bakerlab.org/, accessed 31 December 2015). Homologous structures were identified for all three proteins and used to thread the modeling algorithm. The quality of the models was assessed by manual inspection of the models and comparison to structures of homologous proteins to verify that known folds, active sites, dimer interfaces and binding pockets had been recovered realistically in the models. In addition, the distribution of the estimated errors was evaluated and verified to be located in non-core areas of the protein. The effect of the individual mutants was assessed by manual inspection of the models using PYMOL software. Mutations that substantially disturbed the integrity of the structure (e.g. by introducing clashes, hydrophilic residues in hydrophobic environments or removing stabilizing interactions) or directly interfered with the function of the protein (e.g. by substituting catalytic residues or destabilizing areas involved in binding, catalysis or homodimerisation) were annotated as having an either ‘structural’ or a more specific effect such as ‘close to binding pocket’ ‘close to catalytic site’ or ‘involved in dimer formation’. Mutations with no obvious effects on the structure or activity of the proteins were annotated as ‘Unexplained’ (e.g. a hydrophilic for hydrophilic substitution in a solvent exposed area of the protein).
Results
Mapping the Cer-cqu locus to a discrete location on chromosome arm 2HS
The Cer-c, Cer-q and Cer-u genes have previously been mapped to the short arm of chromosome 2H, 27.1 cM proximal to the RFLP marker MWG064 and 5.4 cM distal to MWG048 (Schondelmaier et al., 1992). This genetic position was used together with the information of the introgression regions from three near-isogenic lines carrying mutations in Cer-c, Cer-q and Cer-u (Franckowiak et al., 1985). Near-isogenic line BW409 carries a Cer-c introgression between SNP markers 1_0326 and 2_0563, BW404 carries a Cer-q introgression between markers 2_0112 and 1_0943, and BW411 carries a Cer-u introgression between markers 2_1377 and 1_0919 (Close et al., 2009; Druka et al., 2010). The three introgressed regions are partly overlapping (Fig. 2A). Six SNP markers polymorphic across the introgressed regions (Fig. 2B) were used in the analyses of ten F2-mapping populations, which were created from crosses of the three near-isogenic lines to barley cultivars Bowman, Barke, Morex and Quench.
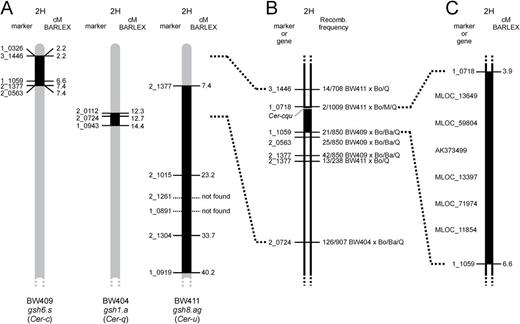
Location of Cer-c, Cer-q and Cer-u on barley chromosome arm 2HS. (A) Comparison of introgression regions in three different barley near-isogenic lines (Druka et al., 2010). BW409 carries the gsh6.s allele, which is a mutation in the Cer-c gene (Franckowiak and Lundqvist, 2012). BW404 and BW411 contain gsh1.a (Cer-q) and gsh8.ag (Cer-u), respectively. Map positions follow the BARLEX Draft Genome Explorer (Colmsee et al., 2015). (B) Mapping of the Cer-c, Cer-q and Cer-u loci using six SNP markers. Recombination frequency for each marker is given as number of recombinants/total progeny. The F2-mapping populations were made from crosses between the three near-isogenic lines and barley cultivars Bowman (Bo), Barke (Ba), Morex (M) and Quench (Q). (C) Cer-c, Cer-q and Cer-u were mapped between SNP markers 1_0718 and 1_1059. Six genes of unknown order were selected as Cer-c, Cer-q and Cer-u candidates for further analysis.
That the three genes are located extremely close to each other (von Wettstein-Knowles and Søgaard, 1980) infers that the different mapping populations could be pooled to identify a unique position for them on chromosome arm 2HS. More than 3000 F2 plants were grown, phenotyped and subsequently analyzed with the six SNP markers. The results from the SNP marker analyses of the F2-mapping populations defined the location of Cer-c, Cer-q and Cer-u to an interval flanked by distal marker 1_0718 and proximal marker 1_1059 (Fig. 2C).
These two markers are located on morex_contig_6591 and morex_contig_276408, respectively, corresponding to a region of 2.68 cM based on the barley POPSEQ map (Mascher et al., 2013). The region contains 582 gene models according to EnsemblPlants (Bolser et al., 2015) while 194 gene models are predicted in the BARLEX Draft Genome Explorer (Colmsee et al., 2015), 72 of which have been annotated. Based on these putative functions and the previous predictions from von Wettstein-Knowles (2012), five genes were selected as likely candidates for Cer-c and Cer-u; MLOC_11854 predicted to encode a transferase, MLOC_59804 which contains a type III polyketide-synthase domain, and MLOC_13649, MLOC_12151/AK373499 (see methods) and MLOC_71974 which belong to the cytochrome P450 family.
To test the five candidate genes for the likelihood of them being Cer-c or Cer-u, the seven apparent triple cer-cqu mutants were exploited. Six of them had been induced by fast neutrons and one (cer-cqu.124) by gamma rays suggesting their potential to be deletions (von Wettstein-Knowles and Søgaard, 1980). Two genes (MLOC_59804 and AK373499) could not be amplified in six of the seven triple mutants. An additional gene, encoding a lipase (MLOC_13397), was selected as a putative candidate for Cer-q based on its proximity to the Cer-c and Cer-u candidates in the POPSEQ map. This gene also failed to amplify in the same six triple mutants as MLOC_59804 and AK373499. It is worth noting that the three genes were amplified in the triple mutant cer-cqu.733. This inconsistency is most likely explained by a low degree of seed mix-up which inevitably occurs in historic mutant collections over the years (Zakhrabekova et al., 2012; Dockter et al., 2014). Taken together, the deletion analysis of the cer-cqu mutants, along with their predicted functions, pinpointed these three genes as candidates for Cer-c, Cer-q and Cer-u (Fig. 3A).
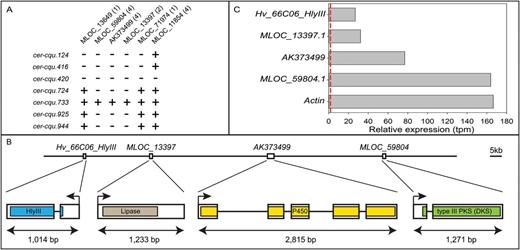
Cer-cqu candidate genes, barley BAC sequence and gene expression. (A) PCR amplification of six candidate genes using DNAs from barley cer-cqu triple mutants as templates. The inability to amplify MLOC_59804, MLOC_13397 and AK373499 from six mutants pinpointed these as Cer-c, Cer-q and Cer-u candidates. The number of primer pairs used with each gene is in parenthesis. +, gene amplified; -, gene not amplified. (B) Proposed order and gene models of the four genes identified on barley BAC HVVMRXALLrA0066C06. Regions encoding conserved domains are colored. Bar, 5kb. (C) Relative expression of the four genes based on RNA-seq analysis of barley flag leaf sheath (SRA PRJEB12101). Actin (MLOC_54382.1) is included as a reference gene. The dashed red line corresponds to a transcripts per million (tpm) value of 2, commonly used as the cut-off for real expression over noise.
BAC and candidate gene annotation
To determine the proximity of the three candidate genes within the barley physical sequence, we screened a barley bacterial artificial chromosome (BAC) library of cultivar Morex via PCR (see ‘Materials and methods’). We identified BAC clone HVVMRXALLrA0066C06 and successfully amplified all three candidate genes from the BAC template. Using PacBio reads we performed a sequence assembly of BAC HVVMRXALLrA0066C06, thus obtaining a single contig of 181,647 base pairs in size (GenBank accession KU721941). We first annotated the repetitive portion of the BAC using publicly available databases (TREP, NCBI). Approximately 67% of the BAC sequence (122067bp) consisted of transposable elements (TEs), which is lower than the estimated average of ~85%, suggesting a gene-rich region. Among the TEs present on the BAC are three complete long terminal repeat (LTR) retrotransposons belonging to the Ty1-copia family. These elements are over 97% identical to each other, suggesting very recent local duplications.
We used gene prediction algorithms to identify open reading frames on the BAC (Solovyev et al., 2006). In addition to the three candidate genes MLOC_59804, MLOC_13397 and AK373499, we identified a fourth gene that encodes a member of the haemolysin III family predicted to function as an integral membrane channel protein. This fourth gene, named Hv_66C06_HlyIII hereafter, appears to be novel as no matching barley gene model or full-length cDNAs could be detected in public databases. No other genes were predicted on the BAC.
The order of the four genes was determined to be Hv_66C06_HlyIII, MLOC_13397, AK373499 and MLOC_59804, with 27.3, 49.2 and 46.5kb, respectively, between the termination codon of the preceding and the start codon of the following gene (Fig. 3B). By disregarding TEs, the physical interval between the four genes was 13.7, 12.7 and 13.7kb, respectively. The accumulated distance between the Cer-cqu genes was 101kb and 31.7kb without TEs.
We surveyed the expression of the genes identified on the BAC using publicly available transcriptome data (PRJEB12101) of leaf sheath tissue from barley cultivar Foma collected at growth stage 43 (flag leaf sheath just visibly swollen). At this developmental stage barley has visible wax deposition on the leaf sheath. We used the kallisto-sleuth package (Bray et al., 2015) to map reads and quantify transcript abundance. Analysis of the RNA-seq data confirmed the gene models for MLOC_59804, MLOC_13397 and Hv_66C06_HlyIII as well as the full-length cDNA model AK373499 including exon 1, which is missing from the Morex whole genome sequence assembly (MLOC_12151; see ‘Materials and methods’) (Fig. 3B). All three candidate genes as well as Hv_66C06_HlyIII are highly expressed in flag leaf sheaths, with MLOC_59804 being almost as highly expressed as Actin (MLOC_54382; Fig. 3C). These results agree with the expected expression patterns of candidate genes for Cer-c, -q and -u.
Independent validation of Cer-c, -q and -u candidate genes
To validate the three candidate genes we examined 57, 57 and 54 additional cer-c, -q and -u mutants, respectively. Each candidate gene, including >400bp upstream of the start codon and >100bp downstream of the termination codon, were amplified and sequenced. Mutations were identified in 53, 52 and 54 cer-c, -q and -u mutants for the candidate genes MLOC_59804, MLOC_13397 and AK373499, respectively (Tables 1–3). In the majority of cases, these mutations led to a non-synonymous amino acid change (46 cer-c, 37 cer-q and 32 cer-u), while only a small number resulted in premature termination codons (two, five and nine) or caused a frameshift in the protein (three, six and four). Mutations in canonical splice sites were only observed in four cer-u mutants, consistent with the fact that MLOC_59804 (Cer-c) has only two exons and that MLOC_13397 (Cer-q) lacks an intron altogether. No amplicons could be obtained for the corresponding gene in two cer-c, four cer-q, and two cer-u mutants, although the other genes could be amplified, suggesting that these are single gene deletions.
Mutations in barley MLOC_59804 (Cer-c) organized on the basis of their position in the gene
| cer | Mutagena | Year | Cb | CDS position | Protein | Effect on enzyme |
|---|---|---|---|---|---|---|
| 1131c | EMS | 1969 | K | G(−18)A | 5’ UTR | --- |
| 36 | γ-rays | 1956 | B | 1bp del (78) | frame (26>) | --- |
| 511 | PMS | 1963 | F | C121T | P41S | Near active site pocket |
| 902 | iPMS | 1970 | B | A128G | Y43C | Near substrate binding tunnel |
| 1334 | NaN3 | 1975 | B | C143T | T48I | Near substrate binding tunnel |
| 945 | EMS | 1969 | B | A145T | K49* | --- |
| 987 | ethylene oxide | 1971 | B | T178A | F60I | Near substrate binding tunnel |
| 544 | NMUN | 1965 | F | G191A | C64Y | Near active site pocket |
| 890 | ethylene oxide | 1970 | B | C214T | R72C | Near substrate binding tunnel |
| 223 | ethylene imine | 1959 | F | T221C | F74S | Near substrate binding tunnel |
| 171 | PDADE | 1965 | B | T305A | V102E | Near substrate binding tunnel |
| 999 | iPMS | 1977 | B | A310T | K104* | --- |
| 469 | EMS + neutrons | 1963 | F | C404T | T135I | Near active site pocket |
| 760 | ethylene oxide | 1968 | B | C431A | A144D | Structural |
| 405 | nBMS | 1962 | F | C478T | R160C | Dimerization |
| 379 | nBMS | 1962 | F | T494A | L165H | Near active site pocket |
| 1329 | EMS | 1975 | B | G508A; A986G | A170T; K329R | Near active site pocket |
| 1348 | NaN3 | 1976 | B | C518T | S173F | Near active site pocket |
| 73 | ethylene imine | 1958 | B | 5bp del (522–526) | frame (175>) | --- |
| 95 | γ-rays | 1961 | B | 5bp del (522–526) | frame (175>) | --- |
| 361 | EMS | 1962 | F | T590A | L197H | Near substrate binding tunnel |
| 1386 | EMS | 1975 | B | G611A | S204N | Near substrate binding tunnel |
| 915 | iPMS | 1970 | B | G664A | D222N | Near substrate binding tunnel |
| 881 | EMS | 1968 | B | G668A | G223E | Near substrate binding tunnel |
| 502 | ethylene imine | 1964 | F | A682T | I228F | Structural |
| 471 | EMS + neutrons | 1963 | F | A682T | I228F | Structural |
| 44 | X-rays | 1957 | B | A713T | E238V | Structural |
| 206 | X-rays | 1959 | F | A713T | E238V | Structural |
| 703 | Neutrons | 1967 | B | A746G | Q249R | Dimerization |
| 7 | Spontaneous | 1950 | B | A747T | Q249H | Dimerization |
| 3 | X-rays | 1943 | B | A747T | Q249H | Dimerization |
| 3353 | EMS | 1962 | F | A747T | Q249H | Dimerization |
| 1359 | EMS | 1976 | B | C775T | L259F | Near active site pocket |
| 61 | ethylene imine | 1958 | B | T776A | L259H | Near active site pocket |
| 673 | ethylene imine | 1966 | B | T836A | L279Q | Near active site pocket |
| 89 | γ-rays | 1958 | B | T839A | V280E | Near active site pocket |
| 1448 | NaN3 | 1977 | B | G841A | A281T | Near substrate binding tunnel |
| 1757 | NaN3 | 1980 | B | G841A | A281T | Near substrate binding tunnel |
| 748 | ethylene oxide | 1967 | B | T916A | W306R | Structural |
| 1703 | NaN3 | 1979 | B | C929T | P310L | Near active site pocket |
| 499 | EMS | 1964 | F | G941A | G314D | Near substrate binding tunnel |
| 596 | ENU | 1967 | F | A943T | I315F | Near active site pocket |
| 270 | EMS | 1962 | F | T947G | M316R | Near active site pocket |
| 332 | γ-rays + EMS | 1961 | F | T947G | M316R | Near active site pocket |
| 238 | alpha-epichlorohydrine | 1959 | F | T1010A | V337E | Near active site pocket |
| 240 | Glycidol | 1959 | F | T1010A | V337E | Near active site pocket |
| 1533 | ethylene oxide | 1970 | B | T1010A | V337E | Near active site pocket |
| 635 | ethylene imine | 1970 | B | A1016T | N339I | Structural |
| 698 | ethylene imine | 1966 | B | T1020A | F340L | Structural |
| 413 | γ-rays | 1963 | F | C1026A; A1027C | N342K | Active site (Catalytic residue) |
| 284 | EMS | 1960 | F | T1102A | W368R | Dimerization |
| 520 | EMS | 1965 | F | C1136T | T379I | Dimerization |
| 455 | EMS | 1963 | F | C1153T | L385F | Structural |
| 609 | EMS | 1963 | F | C1153T | L385F | Structural |
| 115 | γ-rays | 1957 | E | deletion | --- | --- |
| 870 | Neutrons | 1969 | B | deletion | --- | --- |
a EMS, ethyl methanesulfonate; PMS, n-propyl methanesulfonate; iPMS, isopropyl methanesulfonate; hPMS, hydroxy-propyl methanesulfonate; NaN3, sodium azide; MNU, N-methyl-N-nitrosourea; nBMS, n-butyl methanesulfonate; ENU, N-ethyl-N-nitrosourea; ENUR, N-ethyl-N-nitrosourethane; NMUN, N-methyl-N-nitrosourethane; PDADE, propane disulfonic acid diethyl ester.
b Cultivar (B, Bonus; E, erectoides-a.23; F, Foma, K, Kristina).
c Accessions originally classified as cer-q mutants.
Mutations in barley MLOC_13397 (Cer-q) organized on the basis of their position in the gene
| cer | Mutagena | Year | Cb | CDS position | Protein | Effect on enzymec |
|---|---|---|---|---|---|---|
| 1238 | iPMS | 1972 | K | T2A | M1K | --- |
| 295 | EMS | 1960 | F | C38T | A13V | Unexplained |
| 128 | γ-rays | 1964 | B | 1bp del (42) | frame (14>) | --- |
| 1320 | X-rays | 1975 | B | A65G | Y22C | Unexplained, but Cys |
| 42 | X-rays | 1957 | B | 1bp del (68) | frame (23>) | --- |
| 1375 | NaN3 | 1976 | B | G92A | G31D | Unexplained (surface) |
| 1439d | EMS | 1976 | B | G92A | G31D | Unexplained (surface) |
| 1143 | EHMS | 1969 | K | A101G | E34G | Unexplained (surface) |
| 82 | X-rays | 1948 | B | 1bp del (202) | frame (68>) | --- |
| 900 | iPMS | 1970 | B | A269T | H90L | Active site pocket + Structural |
| 754 | ethylene oxide | 1968 | B | T280A | F94I | Active site pocket + Structural |
| 683 | ethylene imine | 1966 | B | T283A | C95S | Active site pocket |
| 566 | ENU | 1966 | F | A290T | E97V | Active site pocket |
| 1225 | EMS | 1972 | K | G293A | S98N | Active site pocket + Structural |
| 1243 | iPMS | 1972 | K | G317A | R106H | Active site pocket + Structural |
| 103 | X-rays | 1954 | E | 1bp del (339) | frame (114>) | --- |
| 1283 | EMS | 1974 | K | G385A | E129K | Unexplained (surface) |
| 1412 | iPMS | 1977 | B | A386G | E129G | Unexplained (surface) |
| 395 | EMS + neutrons | 1962 | F | G435A | W145* | --- |
| 401 | Neutrons | 1967 | F | G435A | W145* | --- |
| 262 | ethylene imine | 1960 | F | T437A | V146E | Structural |
| 218 | ethylene imine | 1959 | F | 1bp del (442) | frame (148>) | --- |
| 483 | PMS | 1963 | F | T461A | L154H | Structural |
| 488 | EMS + neutrons | 1963 | F | T461A | L154H | Structural |
| 1193 | iPMS | 1971 | K | A466T | K156* | --- |
| 1748 | NaN3 | 1980 | B | G502A | D168N | Active site pocket (next to catalytic residue) |
| 310 | EMS | 1960 | F | G506A | S169N | Active site pocket (catalytic residue) |
| 246 | ethylene imine | 1959 | F | C509T | A170V | Active site pocket (next to catalytic residue) |
| 239 | Glycidol | 1959 | F | G514T | G172C | Active site pocket |
| 1141 | hPMS | 1969 | K | G515A | G172D | Active site pocket |
| 1167 | MNU | 1970 | K | G515A | G172D | Active site pocket |
| 341 | γ-rays + EMS | 1962 | F | C600A | F200L | Active site pocket |
| 1459 | NaN3 | 1978 | B | G607T | G203W | Structural |
| 176 | PDADE | 1965 | B | T655C | F219L | Active site pocket |
| 1368 | iPMS | 1976 | B | T667A | W223R | Active site (substrate binding pocket) |
| 1358 | EMS | 1976 | B | G669A | W223* | --- |
| 1742 | EMS | 1979 | B | G670A | V224M | Structural |
| 320 | ethylene imine | 1961 | F | A677T | K226M | Structural (surface) |
| 636 | ethylene imine | 1970 | B | T688A | F230I | Structural |
| 1345 | NaN3 | 1975 | B | C733T | P245S | Structural |
| 1400 | EMS | 1977 | B | C733T | P245S | Structural |
| 555 | γ-rays | 1966 | F | C811T | R271W | Structural |
| 1499 | NaN3 | 1979 | B | G814A | G272R | Active site pocket |
| 574 | PDADE | 1966 | F | T897A | H299Q | Active site pocket (catalytic residue) |
| 1281 | X-rays | 1974 | K | 3bp del (923–925) | R308-;A309P | Structural (surface) |
| 1128 | EMS | 1969 | K | C1040T | P347L | Structural |
| 1706 | NaN3 | 1979 | B | G1057A | D353N | Unexplained |
| 400 | EMS | 1963 | F | A1111T | K371* | --- |
| 1209 | X-rays | 1972 | K | 2bp del (1138–1139) | frame (380>) | --- |
| 425 | γ-rays | 1963 | F | deletion | - | --- |
| 536 | Neutrons | 1965 | F | deletion | - | --- |
| 548 | MNU | 1965 | F | deletion | - | --- |
| 876 | Neutrons | 1969 | B | deletion | - | --- |
a EMS, ethyl methanesulfonate; PMS, n-propyl methanesulfonate; iPMS, isopropyl methanesulfonate; hPMS, hydroxy-propyl methanesulfonate; NaN3, sodium azide; MNU, N-methyl-N-nitrosourea; ENU, N-ethyl-N-nitrosourea; EHMS, ethylhydroxy-ethanesulfonate; PDADE, propane disulfonic acid diethyl ester; mEMS, 2-methoxyethyl methane-sulfonate.
b Cultivar (B, Bonus; E, erectoides-a.23; F, Foma, K, Kristina).
c Substitutions in low confidence regions of model are shown in italics.
d Accessions originally classified as cer-c mutants.
Mutations in barley AK373499 (Cer-u) organized on basis of their position in the gene
| cer | Mutagena | Year | Cb | CDS position | Protein | Effect on enzyme |
|---|---|---|---|---|---|---|
| 1137 | ethylene imine | 1969 | K | A58T | R20* | --- |
| 371 | ethyl ethanesulfonate | 1962 | F | T74A | L25Q | Structural |
| 1282 | EMS | 1974 | K | G152A | G51E | Structural |
| 1825 | iPMS | 1980 | B | G167A | C56Y | Substrate binding |
| 1108 | MNU | 1968 | K | C178T | L60F | Substrate binding |
| 689 | ethylene imine | 1966 | B | G191A | R64Q | Unexplained |
| 895 | iPMS | 1970 | B | A218T | H73L | Structural |
| 443 | nBMS | 1963 | F | C241T | P81S | Substrate binding |
| 986 | ethylen oxide | 1971 | B | T256A | W86R | Structural |
| 1496 | NaN3 | 1979 | B | G258A | W86* | --- |
| 525 | EMS | 1965 | F | G258A | W86* | --- |
| 1146 | EHES | 1969 | K | G272A | G91E | Structural |
| 542 | MNU | 1965 | F | T298A | W100R | Structural |
| 505 | PDA | 1964 | F | T335A | V112E | Structural |
| 1309 | iPMS | 1974 | K | T395A | L132* | --- |
| 1202 | EMS | 1971 | K | G397A | E133K | Structural |
| 338 | EMS | 1961 | F | T464A | I155N | Heme binding |
| 901 | iPMS | 1970 | B | C473G; T475A | A158G;F159I | Heme binding |
| 304 | PMS | 1960 | F | 2nd intron GT | splice donor | --- |
| 1165 | ENU | 1970 | K | 10th bp 2nd intron | Intron | --- |
| 307 | Myleran | 1960 | F | G538T | E180* | --- |
| 107 | X-rays | 1955 | E | 1bp del (607) | frame (203>) | --- |
| 556 | γ-rays | 1966 | F | 1bp del (647) | frame (216>) | --- |
| 376 | nBMS | 1962 | F | C707T | A236V | Substrate binding |
| 825 | EMS | 1969 | B | C707T | A236V | Substrate binding |
| 237 | ECH | 1959 | F | T718A | F240I | Substrate binding |
| 1114 | γ-rays | 1969 | K | T719C | F240S | Substrate binding |
| 387 | EMS+ | 1962 | F | G724A | D242N | Substrate binding |
| 855 | EMS | 1969 | B | 3rd intron AG | splice acceptor | --- |
| 281 | EMS | 1960 | F | G747A | R249R | No effect (synonymous) |
| 452 | EMS | 1963 | F | C776T | T259I | Structural |
| 1402 | EMS | 1977 | B | C776T | T259I | Structural |
| 69 | ethylene imine | 1958 | B | G780A | W260* | --- |
| 1177 | γ-rays | 1970 | K | 2bp del (783–784) | frame (261>) | --- |
| 613 | EMS | 1967 | F | A805T | K269* | --- |
| 1759 | NaN3 | 1980 | B | G814T | E272* | --- |
| 1215 | Neutrons | 1972 | K | 2bp del (940-A941) | frame (314>) | --- |
| 606 | ethylene imine | 1966 | F | G970A | E324K | Substrate binding |
| 677 | ethylene imine | 1966 | B | T1010C | L337P | Structural |
| 1370 | NaN3 | 1976 | B | 4th intron GT | splice donor | --- |
| 21 | γ-rays | 1955 | B | 3rd bp 4th intron | Intron | --- |
| 1340 | NaN3 | 1975 | B | 4th intron AG | splice acceptor | --- |
| 570 | ENUR | 1966 | F | A1141G | R381G | Structural |
| 491 | ethylene imine | 1964 | F | A1171T | R391W | Structural |
| 776 | EMS | 1968 | B | C1237T | P413S | Substrate binding |
| 789 | ethylene imine | 1968 | B | A1253C | H418P | Structural |
| 457 | Neutrons | 1963 | F | A1253C | H418P | Structural |
| 1327 | EMS | 1975 | B | C1309T | Q437* | --- |
| 177 | PDA | 1965 | B | T1352A | L451Q | Heme binding |
| 887 | ethylene imine | 1970 | B | T1357A | F453I | Heme binding |
| 1237 | iPMS | 1972 | K | T1358A | F453Y | Heme binding |
| 737 | ethylene oxide | 1968 | B | T1433C | L478P | Structural |
| 58 | ethylene oxide | 1958 | B | Deletion | - | --- |
| 468 | PMS | 1963 | F | Deletion | - | --- |
a EMS, ethyl methanesulfonate; PMS, n-propyl methanesulfonate; iPMS, isopropyl methanesulfonate; NaN3, sodium azide; MNU, N-methyl-N-nitrosourea; nBMS, n-butyl methanesulfonate; ENU, N-ethyl-N-nitrosourea; ENUR, N-ethyl-N-nitrosourethane; EHMS, ethylhydroxy-ethanesulfonate; PDS, propane disulfonic acid; ECH, alpha-epichlorohydrine.
b Cultivar (B, Bonus; E, erectoides-a.23; F, Foma; K, Kristina).
No mutations could be detected in MLOC_59804 and MLOC_13397 in four cer-c and five cer-q mutants, respectively. For these nine mutants the other two candidate genes (e.g. MLOC_13397 and AK373499 for a cer-c mutant) were amplified and sequenced. For three cer-q mutants a mutation could be detected in MLOC_59804, while for one cer-c mutant a mutation in MLOC_13397 was identified. No mutation in any of the three genes was detected for the remaining five mutants. This probably reflects the challenge of keeping phenotypically similar mutant accessions separate over decades. Similarly, in a few cases the mutations identified were identical between two mutant lines (eight, five and four cases for MLOC_59804, MLOC_13397 and AK373499, respectively). These mutations occur in lines which differ in the cultivar, the isolation year, the mutagen used or a combination of these, suggesting that they are independent mutation events.
Taken together, the identification of over 50 independent mutants across each candidate gene provides strong evidence that MLOC_59804, MLOC_13397 and AK373499 encode CER-C, -Q and -U, respectively (Table 4, Fig. 4).
Summary of mutation types identified in cer mutants
| Mutant | Candidate gene | Mutants studied | Mutations in candidate | Non- synonymous | PTCa | Frameshift | Splice | Synonymous/ intron/ UTR | Whole gene deletion | No mutations detected | Misclassifiedb | Shared between lines |
|---|---|---|---|---|---|---|---|---|---|---|---|---|
| Cer-c | MLOC_59804 | 59 | 54 | 48 | 2 | 3 | 0 | 1 | 2 | 3 | 3 | 8 |
| Cer-q | MLOC_13397 | 55 | 49 | 38 | 5 | 6 | 0 | 0 | 4 | 2 | 1 | 5 |
| Cer-u | AK373499 | 54 | 52 | 32 | 9 | 4 | 4 | 3 | 2 | 0 | 0 | 4 |
a PTC, premature termination codon.
b Lines originally classified as mutants for alternative locus (cer-q or cer-c).
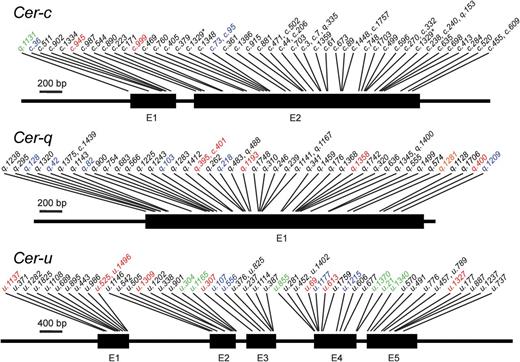
Positions of identified mutations in the barley Cer-c, Cer-q and Cer-u genes. Most were point mutations leading to non-synonymous substitutions of amino acids (mutation names in black). Others included nonsense mutations (red), small deletions of 1–3bp (blue), or point mutations located upstream of the ATG start codon or in intron splice sites (green). Mutation cer-c.1329 (marked with an asterisk) contained two mutations in different parts of Cer-c. Further details are in Tables 1–3 and Supplementary Data. E, exon.
Phylogenetic analysis of the CER-C, -Q and -U proteins
To assess the phylogeny of the CER-C, -Q and -U proteins we performed BLASTP analyses using publicly available protein sequences. Proteins from mono- and dicotyledonous species (including Eucalyptus) were aligned and phylogenetic trees constructed for each of the three genes. As expected the most closely related orthologs among the grasses belonged to members of the Triticeae tribe (Triticum aestivum, Aegilops tauschii; Supplementary Data). Closely related orthologs were also identified in foxtail millet (Setaria italica), switchgrass (Panicum virgatum), Brachypodium and sorghum, although generally these species formed a parallel clade relative to the Triticeae CER-C, -Q and -U proteins. The closest rice and Brachypodium orthologs occur in more distantly related clades and are more similar to other barley proteins than to CER-C, -Q and -U (Supplementary Data). This was confirmed through a reciprocal BLAST analysis for the closest Brachypodium and rice orthologs to barley.
Comparative modeling for CER-C, CER-Q and CER-U
To assess the biophysical effects of the mutations we prepared models of the CER-C, -Q and -U proteins and mapped the identified mutations onto these. The models were prepared using the comparative modeling algorithms implemented at the Robetta web-server (Song et al., 2013). For all three proteins, clades of existing structures with homology to the proteins were identified and served as templates in the subsequent modeling.
CER-C was modeled over the thiolase fold containing Marchantia polymorpha stilbene carboxylate synthase 2 (confidence score: 0.93; sequence identity: 39%; PDB code: 2p0u; Fig. 5A) reproducing a homodimeric thiolase-fold structure as expected for a CHS-like synthase (Austin and Noel, 2003). The model faithfully reproduced the position of the catalytic triad (Cys168, His309 and Asn342; Fig. 5A, red sticks) in a hydrophobic active site pocket (Fig. 5A, red backbone) connected to the exterior through a CoA-binding tunnel (Fig. 5A, green backbone) and a long substrate binding tunnel (blue backbone) traversing the protein to the surface opposite the entry of the CoA binding pocket. Out of the 48 mutants encoding non-synonymous substitutions, one targeted the catalytic Asn342, 30 affected other aspects of the active site or binding pockets, ten were predicted to affect the overall stability of the protein (Table 1, ‘structural’) and seven destabilized the interface between the homodimers (Table 1, ‘dimerization’). Only four mutants were predicted to affect surface residues, and they all either introduced cysteines prone to forming unfavorable disulfides, localized near the binding tunnels or featured destabilizing hydrophilic for hydrophobic substitutions (Y43C, L279Q, N339I and F340L). Thus, the CER-C model supports the conclusion that the cer-c mutants are caused by mutations in the CHS-like synthase encoded by MLOC_59804.
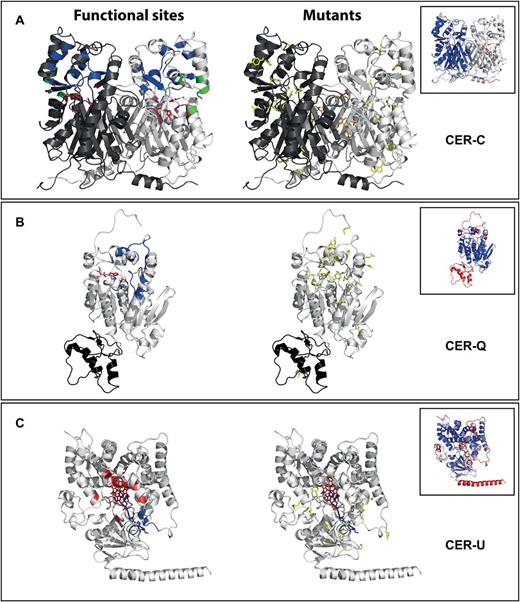
3D models of CER-C, CER-Q and CER-U. The proteins are represented in backbone cartoon with backbone colors representing functional sites in the cartoon models to the left and amino-acid residues affected by the mutations represented as yellow sticks in the models to the right. (A) CER-C represented in proposed homodimer form with subunits in black and white. To the left, the catalytic triad is represented in red sticks while the backbone of the residues forming the pockets associated with activity are colored purple (active site pocket) except for the catalytic residues in red; blue (substrate binding tunnel) and green (CoA-binding tunnel). (B) CER-Q with the lipase domain 1 in white and domain 2 in black. To the left, the active site residues are represented as red sticks and the backbone of the residues delineating the active site pocket are colored blue. (C) CER-U with heme included in the heme-binding pocket in red sticks. To the left, the backbone of the residues involved in heme binding are colored red while the substrate binding tunnel is colored blue. In the inserts the models are colored according to the predicted model error from blue (low error) to red (high error). PDB models and Pymol session files showing mutant names are accessible in the models (Supplementary Data) and Pymol sessions (Supplementary Data).
Modeling of CER-Q identified two distinct domains produced with two different clades of template structures (sequence coverage domain1/domain2: 1–328/329–410; confidence scores: 0.83/0.33; sequence identity: 25%/17%; PDB codes: 1lzl/2vsa; Fig. 5B). Domain 1 constituted an α/β hydrolase fold with the bacterial heroine esterase as closest structural homolog (Zhu et al., 2003), while the closest structural homologs of domain 2 were lectin-containing ricin-like toxin domains (Treiber et al., 2008). Despite the lower overall quality of the model, the α/β hydrolase core of domain 1 was modeled with high confidence and a conserved catalytic triad located at the bottom of a substrate binding pocket (Ser169, Asp266, His299; Fig. 5B, red sticks) (Holmquist, 2000). The low confidence of domain 2 was mostly due to the inability to confidently model the relative orientation of the two domains and a poor modeling of the cap-domain on top of the active site pocket (Fig. 5B, inset). The mutations identified in the cer-q mutants included the two catalytic residues Ser169 and H299, 13 residues in or near the active site pocket and eight substitutions resulting in a general destabilization of the protein (Table 2; Supplementary Data). The model failed to provide an explanation for eight of the 37 non-synonymous substitutions identified in MLOC_13397, however these predominantly occurred in domain 2 and other poorly predicted parts of the model (Table 2, Supplementary Data). Thus, analysis of the mutants across the MLOC_13397 model supports that Cer-q encodes a lipase.
The closest structural homologs of CER-U were all identified among the cytochrome P450 family of proteins (confidence score: 0.68; sequence identity: 17%; PDB code: 4k0f; Fig. 5C). The CER-U model included a heme pocket complete with the conserved Cys460 thiol oriented towards the point where the heme iron would be positioned. The heme-binding pocket was connected to the solvent via a substrate binding tunnel similar to other known P450 proteins. Interestingly, residues 5–26 of the C-terminal helix was predicted to constitute a trans-membrane helix using the TMHMM prediction algorithm (Krogh et al., 2001). Out of the 32 non-synonymous substitutions in CER-U (Table 3), 15 were predicted to disturb the area around the heme binding pocket or the substrate binding pocket, while 16 were predicted to destabilize the protein in general. The only mutation without an obvious impact on the activity of CER-U, cer-u.689, was located in an area of low model quality (Table 3). Thus, this analysis supports the conclusion that AK373499 (Cer-u) encodes a cytochrome P450. The models in pdb file format along with Pymol session files, showing the models with mutant residues labeled with amino acid residue substitution and source mutant strain name, are accessible given in Supplementary Data.
Discussion
The Cer-cqu gene cluster
Cer-cqu was the first potential gene cluster or multifunctional gene found in plants (von Wettstein-Knowles and Søgaard, 1980). These designations were based on the close linkage, two orders of magnitude smaller than for any other barley genes at the time, and their action in a distinct secondary metabolic pathway. With the present identification of three adjacent, non-homologous genes within 101kb, the gene cluster designation has now been confirmed. Many other clusters have been found in recent years, and all have in common that they affect secondary metabolic pathways involved in biotic or abiotic defense (Boycheva et al., 2014), as is true for the Cer-cqu cluster. According to Nützmann and Osbourn (2014), one gene in such a cluster is the signature enzyme defining the unique metabolic structure. For the Cer-cqu cluster this is Cer-c encoding a type III chalcone synthase-like protein. Signature genes in plants seem to have evolved from genes participating in primary metabolism via gene duplication and subsequent neofunctionalization. The progenitor of CER-C is presumably the β-ketoacyl-acyl carrier protein synthase KAS III of FAS (Austin and Noel, 2003). These signature genes recruit additional genes, in this case Cer-q and Cer-u, a lipase and P450, respectively, through an unknown mechanism, thus creating a gene cluster.
Is the cluster likely to include additional genes? On the Cer-c end of the cluster the BAC extends for more than 30kb, all of which has been annotated as repetitive sequence. At the other end of the BAC, Hv_66C06_HlyIII is 21kb from the BAC end and only 27kb away from Cer-q. The latter very small distance infers that quadruple deletion mutants should have been found if Hv_66C06_HlyIII were part of the Cer-cqu cluster. Such mutants were not identified during the allele testing of the 872 cer mutants affecting wax on the leaf sheaths, internodes and spikes (Lundqvist and Lundqvist, 1988). Combined, the above evidence supports the notion that additional genes are not present in the Cer-cqu cluster, or if they are, they are not contiguous.
To distinguish the Cer-cqu gene cluster pathway from those determined by other type III PKSs, CER-C has been designated β-diketone synthase (DKS). More than 900 type III PKSs representing 20 different functionalities, had been identified by 2010 (Abe and Morita, 2010). DKS has only two of the three attributes of a typical type III PKS enzyme, namely substrate specificity and elongation activity carrying out two extensions. Three condensations are the most common, with a range of 1–8 (Abe and Morita, 2010). The plant enzymes benzalacetone synthase and curcuminoid synthase do not carry out cyclization reactions (Abe and Morita, 2010). Given the lack of cyclic in vivo wax products, the same may be true for DKS.
The DKS polyketide pathway for wax aliphatics
A major question to be answered about the β-diketone pathway is whether the additional six elongations giving a C32 chain (Fig. 1) are also carried out by the DKS or rather by an FAE type KCS. In this connection it is interesting to note that of the 50 Cer genes that visually affect spike waxes and hence the β-diketone aliphatics, mutants of the 29 studied do not modify the β-diketone chain length distributions, revealing that elongation is not influenced. Mutations in seven of the 29, however, modify that of the alkanes (von Wettstein-Knowles, unpublished). The latter is expected given that in barley at least 19 genes with homology to FAE KCS6 occur (Weidenbach et al., 2014), and that at least three sequential FAE-like complexes are required to synthesize C32 acyl chains from C18 precursors in barley spikes (Mikkelsen, 1978). The organization of all the mentioned elongation complexes, or metabolons (Laursen et al., 2015), and how the growing acyl chain passes from one to the next is a fascinating question to be deciphered in the future.
The present identification of the members of the Cer-cqu gene cluster has established that a polyketide pathway synthesizing β-diketone aliphatics can make significant contributions to the epicuticular wax layer on given plant apoplasts. These three genes affect only the β-diketone polyketide pathway aliphatics (Fig. 6). Initial elongation steps carried out by FAS take place in plastids, and the resulting acyl chains (10–18) are presumably exported to the ER, the site of FAE and the associated enzymes producing FAE derived aliphatics (Lee and Suh, 2015). An FAE-KCS conceivably gives the β-ketoacyl-CoA substrate for the DKS, and FAE components may also be required for the six final elongations to give the β-diketone carbon skeletons (Fig. 1). Moreover, that some of the acyl chains from FAE (Fig. 6, pink) are esterified to alkan-2-ols suggests that the synthetic machinery for the latter as well as for the β-diketone aliphatics is also present in the ER. Finally, all the elements necessary for initiating transport of the polyketide pathway aliphatics to the cuticle surface are present in the ER. These indirect clues that the Cer-c, -q and -u encoded proteins are associated with the ER awaits confirmation.
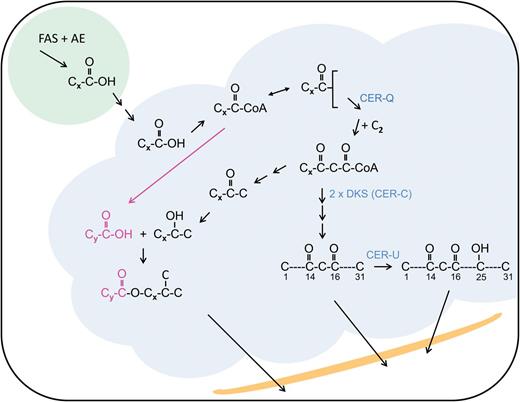
Proposed β-diketone synthase (DKS) polyketide pathway for synthesis of β-diketones, their derivatives and esterified alkan-2-ols. Fatty acid synthase (FAS) plus auxiliary enzymes (AE) in plastids (green) synthesize acyl chains (x=9–17) that are exported therefrom and presumed to enter the endoplasmic reticulum's membrane (gray) where FAE derived aliphatics are synthesized. Here they are activated by CoA to form an acyl-CoA pool. Acyl editing transfers the acyl chains to a glycerolipid in a reversible reaction. Acyl-CoAs can serve as substrates for fatty acid elongase (FAE) complexes giving, for example, a fatty acid (y=17–21; pink, center left side). Given that CER-Q on the basis of homology is classified as a lipase, its acyl substrate is potentially esterified to a glycerolipid (top center). The CER-Q cleaved acyl chain activated by coenzyme A is elongated (+C2) to give the β-ketoacyl compound that is the substrate for two pathways; (i) β-diketones and their derivatives (right side). The DKS (CER-C) introduces two oxygens into the acyl chain, which are followed by further elongations analogous to those carried out by FAE and loss of a carbon yields β-diketones (see Fig. 1). In barley CER-U a P450 hydroxylase inserts a hydroxyl group on carbon 25. (ii) Esterified alkan-2-ols (left side). Cleavage of CoA plus the carboxyl carbon yields methyl ketones that can be hydrolyzed to short alkan-2-ols, primarily with 13 and 15 carbons, for esterification with fatty acids originating from FAE. Mutants of Cer-u and Cer-c accumulate β-diketones and esterified alk-2-ols, respectively. The final aliphatics are transported to and through the apoplast (orange) onto its surface. Single arrows, known reaction(s); sequential arrows, hypothetical reaction(s).
The proposed pathway in Fig. 6 also intimates that acyl chains destined for the β-diketone polyketide pathway are potentially sequestered from the general acyl-CoA pool used by FAE by being esterified to a glycerolipid. Transfer of acyl chains to TAG is well established in plants. CER-Q, classified as a lipase on basis of homology, would cleave them substrate specifically. Which glycerolipid and the time at which the elongation giving the β-ketoaycl-CoA DKS substrate takes place are at present unknown and will prove an intriguing research objective in the future. The proposed cleavage of CoA from the same β-ketoacyl-CoA substrate followed by a decarboxylation as takes place in synthesis of methylketones in tomatoes (Yu et al., 2010) is in accord with early biosynthetic studies, as is the ensuing reduction to alkan-2-ols and their esterification (Mikkelsen, 1984). Cytochrome P450 enzymes are members of all plant gene clusters described to date, as they are tailoring enzymes giving rise to a diverse array of specialized metabolites (Boycheva et al., 2014). CER-U hydroxylates carbon 25 of the C31 β-diketone chain, as do most of its homologs in the β-diketone polyketide pathway in Triticeae species. In some few species, however, alcohol groups occur on carbons-26, −4, −5+6 or −8+9 (Tulloch et al., 1980) illustrating the capacity of the P450s to give rise to new metabolites.
Phylogenetic aspects of the Cer-cqu gene cluster
The phylogenetic analysis of the CER-C, -Q and -U proteins showed that the most similar proteins belong to members of the Triticeae tribe, while proteins from other monocots and dicots showed a higher similarity to other barley proteins. This suggests a recent functional diversification of the Cer-c, -q and -u genes within the Triticeae after Brachypodium diverged from the last common ancestor ~32–39 million years ago (Middleton et al., 2014). Since the same β-diketone aliphatics and esterified alkan-2-ols have also been documented in distant dicot relatives such as Eucalyptus, this would suggest that the ability to produce these compounds has evolved at least twice independently. This is true for the cyanogenic glucoside gene clusters in three different plants (Takos et al., 2011). Alternatively, the Cer-c, -q and -u genes could be ancestral and present in all monocots and were subsequently lost in many species, e.g. rice, maize and Brachypodium, all of which lack β-diketone aliphatics and esterified alkan-2-ols. Perhaps the most interesting gene is Cer-q, which homology assigns to a relatively small set of enzymes whose functions remain relatively unexplored. This is in marked contrast to the extraordinary diversity of type III chalcone synthases and P450s whose diversity has been documented to play significant roles in a large number of different secondary metabolic pathways. The only potentially significant homologs of CER-Q were found in foxtail millet and sorghum. The leaf epicuticular wax of the latter lacks β-diketone aliphatics, but produces esterified alkan-2-ols implying a loss of the Cer-c homolog in this species. Is the same true for foxtail millet? Given that esterified alkan-2-ols do not make any contribution or at best make only a minor contribution to the plant phenotype, as judged from the cer-c mutants where they are major components, a more detailed chemical phenotypic analysis across species is necessary to elucidate their evolutionary relationships. An analogous study might also resolve the question of loss of functions from a single evolutionary event versus independent ones.
In wheat, production of β-diketones is genetically defined by three loci (W1, W2 and W3) mapped to chromosome arms 2BS and 2DS (Tsunewaki and Ebana, 1999; Lu et al., 2015; Zhang et al., 2015). The closest wheat orthologs of Cer-c, -q and -u are all defined by gene models which have been assigned to these regions (IWGSC, 2014), which are syntenic to barley 2HS. This raises the possibility that W1, W2 and/or W3 might be homologs of the Cer-c or -q members of the barley gene cluster. This is further supported by molecular genetic evidence since the Cer-cqu members (this study) and the wheat W1 locus have been mapped to an equivalent syntenic interval based on common markers (Adamski et al., 2013; unpublished data). Whether W1 and W2 in wheat correspond to single genes or gene clusters such as Cer-cqu in barley can be tested now that the latter genes have been identified.
The Cer-cqu mutant collection
In the present study the knowledge of the predicted function of two of the three genes plus the availability of large deletion mutants were critical for success as the Cer-cqu cluster lies in one of the many regions that have yet to be properly assembled despite the draft genome sequence (IBSC, 2012). To confirm that the correct gene has been identified, however, mutant collections are very valuable, and in barley 80 genes with a minimum of six mutants are available (Søgaard and von Wettstein-Knowles, 1987). For the validation of the Cer-c, -q and -u candidate genes a set of mutants (57+57+54, respectively), created using a range of different mutagens, was used which can be grouped into the two categories: (i) chemical mutagens and (ii) ionizing radiation. This strategy should produce a diverse allelic series given that chemical mutagens preferentially cause base alterations (e.g. G→A) while radiation mostly causes base deletions resulting in point mutations (DNA repair error), frameshift mutations (small deletion or addition in coding sequence) or deletions of large chromosomal segments. The 159 mutations identified in the three genes are consistent with these expectations. In 97.5% (115) of lines treated with chemical mutagens a point mutation was observed, while only two frameshift mutations and a single deletion could be detected. Similarly, in the mutant lines treated with ionizing radiation the observed mutations were more diverse, with 44% (11) being point mutations, 36% (9) frameshift mutations and 20% (5) large deletions. Interestingly, the mutants are essentially randomly distributed with the same mutation only occurring twice 15 times and treble two times out of 159, and no hot spots (Rogozin and Pavlov, 2003) materialize as did in Benzer's 1961 analysis in which only two types of chemical mutagens were used (Benzer, 1961) neither of which was used to generate the cer mutant collection.
Acknowledgements
We would like to thank Dr Martin Mascher (IPK, Gatersleben) for his help with the BARLEX Draft Genome Explorer. We would also like to thank the IGM sequencing facility and Dr Stéphane Cauet (CNRGV, Toulouse) for his help with the PacBio assembly. This work was supported by the Danish Research Council, the Carlsberg Foundation and the Nilsson-Ehle Foundation at the Royal Physiographic Society in Lund, and grants BB/J004588/1 and BB/H018824/1 from the UK Biotechnology and Biological Sciences Research Council (BBSRC).
References
Author notes
These authors contributed equally to the work
Editor: Christine Raines, University of Essex

Comments