


Abstract
Since its inception, the Farquhar et al. (1980) model of photosynthesis has been a mainstay for relating biochemistry to environmental conditions from chloroplast to global levels in terrestrial plants. Many variables could be assigned from basic enzyme kinetics, but the model also required measurements of maximum rates of photosynthetic electron transport (Jmax), carbon assimilation (Vcmax), conductance of CO2 into (gs) and through (gm) the leaf, and the rate of respiration during the day (Rd). This review focuses on improving the accuracy of these measurements, especially fluxes from photorespiratory CO2, CO2 in the transpiration stream, and through the leaf epidermis and cuticle. These fluxes, though small, affect the accuracy of all methods of estimating mesophyll conductance and several other photosynthetic parameters because they all require knowledge of CO2 concentrations in the intercellular spaces. This review highlights modified methods that may help to reduce some of the uncertainties. The approaches are increasingly important when leaves are stressed or when fluxes are inferred at scales larger than the leaf.
Introduction
The accepted standard for interpreting measurements of photosynthesis was developed over 35 years ago (Farquhar et al., 1980) and it remains the foundation for a large array of research topics, ranging from genetic modification to global climate modes (Friedlingstein et al., 2006; Price et al., 2011; Bodman et al., 2013; Peterhansel et al., 2013; Lin et al., 2014a,b; Borland et al., 2015; Carmo-Silva et al., 2015; Long et al., 2015; Schimel et al., 2015). The strength of the Farquhar et al. (1980) model that led to its universal adoption was the judicial use of simplifications to mathematically represent the complexity of linking biochemistry to the prevailing environmental conditions experienced by leaves. A major advance was the concept of single limiting factors (see Sharkey, 1989), also known as the photosynthetic teeter-totter or see-saw (Farquhar et al., 2001). This concept is based on the assumption that losses in the coupling between the light and dark (i.e. carbon) reactions are minimal, so the rate of photosynthetic CO2 assimilation (A) can be estimated from the minimum of the light and carbon reactions estimated separately (von Caemmerer, 2013).
Here, we consider some of the carbon reaction assumptions from the Farquhar et al. (1980) paper that affect the CO2 partial pressure in the chloroplast stroma (cc) because it is central to the model. In particular, we examine assumptions about sources of CO2 that originate as small fluxes within the plant and either diffuse out of the leaf or are recycled by photosynthesis. We also examine assumptions about the effects of small fluxes of water and CO2 on the diffusion of CO2 from the atmosphere (ca) into the sub-stomatal air spaces inside the leaf (ci) and, finally, through the cell to the chloroplast stroma (Fig. 1). There have been several advances in knowledge and methodology in the intervening 35 years that have parameterized some of the assumptions, while others have been mostly overlooked.

Leaf cross section showing small fluxes and conductances in leaves. CO2 fluxes are labelled with solid black arrows between concentrations at each location (ca = above the leaf, ci = intercellular spaces, cc = chloroplast, cm = mesophyll cytosol, cx = xylem sap) along with stomatal (gs) and mesophyll (gm) conductances. Water fluxes are shown with blue arrows, along with transpiration through stomata (Es) and the cuticle/epidermis (Ec). The dashed circular arrow represents photorespiration and Rd is respiration in the absence of photorespiration. Organelles in the exaggerated palisade layer cell (upper right) are coloured and labelled with a bold letter (C = chloroplast, M = mitochondrion, P = peroxisome), blue circles represent xylem in a leaf vein.
It is becoming evident that errors in small fluxes at the subcellular to leaf levels may have large consequences when using measurements to parameterize current carbon–climate coupled Earth system models and make predictions about the global carbon cycle. Behaviour of the carbon cycle is the second greatest source of uncertainty in climate model predictions of global temperature (Bodman et al., 2013) and errors in small fluxes could be contributing significantly. Over 15% of the uncertainty can be attributed to the temperature feedbacks on respiration and net primary productivity, while another 11% arises from other biological responses, including CO2 feedbacks (Bodman et al., 2013). Even though leaf respiration is often an order of magnitude lower than photosynthesis (i.e. a small flux), current estimates indicate that gross global leaf respiration releases around 30 Pg C year−1, which is approximately four times larger than all emissions from fossil fuel burning globally (Atkin et al., 2015). Therefore, even a 1% error in predictions of leaf respiration (which is so small a flux that some instruments cannot measure it) would add up to 0.3 Pg C year−1 globally and would account for almost half of the 0.7 Pg C year−1 uncertainty in global carbon models (Canadell et al., 2007).
The rate of leaf respiration in the light is challenging to measure (see ‘Efflux of CO2 from leaves’ below), and is the smallest of the three critical fluxes for determining carbon assimilation (A) in Farquhar et al. (1980):
where Vc is the rate of carboxylation by the photosynthetic enzyme ribulose-1,5-carboxylase/oxygenase (Rubisco), Vo is the rate of oxygenation by Rubisco, and Rd is the rate of respiration in the day (excluding photorespiratory CO2 release).
The flux, Vo, is difficult to directly measure so it is often described by the kinetics of Rubisco and connected to the carbon reaction equations through the CO2 loss resulting from the processing of phosphoglycolate by photorespiratory metabolism. Equation 1 assumes a loss of 0.5mol CO2 for every mole of O2 assimilated. It has been proposed that this constant is actually variable, being affected by temperature and catalase activity (Hanson and Peterson, 1986; Zelitch, 1992; Brisson et al., 1998). Mutants have also been generated with much higher loss of CO2 (Cousins et al., 2008, 2011), though the mechanism for generating the extra CO2 is unclear. We will continue to use the constant of 0.5 here, but note that this assumption should be tested more widely across plant types and environmental conditions, especially in the case of plants whose metabolism has been re-engineered. Defining the term ϕ as the ratio of Vo to Vc, Eq. 1 can then be rearranged:
It is useful to expand the description of ϕ in terms of the kinetics of Rubisco (Laing et al., 1974):
where Vcmax, Vomax, Kc, and Ko are the maximal rates and the Michaelis–Menten constants of carboxylation and oxygenation, respectively; cc and Oc are the partial pressures of CO2 and O2 in the chloroplast; and Sc/o is the relative specificity of Rubisco for CO2 over O2 (note that Sc/o is expressed with the CO2 reactions in the numerator and O2 reactions in the denominator, the inverse of the standard for ϕ). Gas exchange methods can readily be used to measure the CO2 compensation point of photosynthesis by reducing ca until A balances Rd and photorespiration (i.e. net A = 0) (Fig. 2). This point is a simple and fundamental way to represent the ability of a leaf to use CO2 (Woodrow and Berry, 1988). However, for modelling it is a bit more useful to define a related compensation point using Eq. 2 and realizing that A = 0 when ϕ = 2 and Rd = 0. This point is called Γ* (Laisk, 1977; Farquhar et al., 1980) and can be written as:

Common approach for determining respiration in the day (Rd), the compensation point within the cell in the absence of respiration (Γ*), and the internal leaf CO2 concentration at which photosynthesis is balanced by photorespiration (ci*). The method of Laisk (1977) as modified by von Caemmerer et al. (1994) uses the intersection of the linear portion (low CO2) of multiple photosynthetic CO2 response curves, each measured at a different light intensity (low light is favoured for at least one, here Populus deltoides was measured at 500, 250, and 100 µmol m−2 s−1). The usual interpretation is that the intersection of the lines occurs at ci* and Rd, and Γ* is at a higher CO2 concentration due to the effects of mesophyll conductance and respiration. This approach has several assumptions that are not always valid and may cause significant errors (von Caemmerer, 2013).
ϕ can then be re-written as:
and, finally, substituting Eq. 5 into Eq. 2 yields:
Unlike Eq. 2, there are commonly used gas exchange methods for determining all the variables in Eq. 6, but the measurements are challenging and not entirely independent. As discussed below, calculations of Γ* and cc each require knowing mesophyll conductance (gm), while calculations of gm include Rd and Γ*. In addition, there is growing evidence that the magnitude of variation in gm, Rd, and Γ* is important, but they are still generally treated as constants. Our technical ability to measure Γ*, Rd, and gm has greatly improved, but they are all based on measurements of small fluxes that are very sensitive to errors in our assumptions.
The small fluxes that we are considering all interact within the intercellular space of the leaf to create ci (Fig. 1); therefore, accurate determination of ci is essential (see below). For ease of discussion, we have compiled these important parameters into two topic areas: (i) factors affecting the efflux of CO2 from leaves, which include photorespiration, day respiration, and a relatively unknown flux of CO2 dependent on transpiration and the inorganic carbon concentration in the xylem (cx); and (ii) factors affecting the gradient of CO2 between leaves and the atmosphere, including stomatal conductance (gs), transpiration through stomata (Es), transpiration through the cuticle/epidermis (Ec), and mesophyll conductance (gm).
Efflux of CO2 from leaves
Photorespiratory CO2 efflux
One of the largest complications in understanding carbon reactions is the fact that CO2 and O2 compete for the active site of Rubisco (Bowes et al., 1971). This competition greatly impacts our ability to unravel these reactions both because the rate of oxygenation is substantial, often leading to the loss of ~25% of the CO2 assimilated by carboxylation via photorespiration (Sharkey, 1988), and because measuring or modelling the flux is technically challenging (Busch, 2013). Direct measurements of Vo would require separating it from Rd, which is a significant challenge because both occur simultaneously with photosynthesis and have the opposite effect on gas exchange (i.e. they release CO2 and consume O2). The idea that one might have to correct for this kind of flux led it to be called “a nightmare oppressing all who are concerned with the exact measurement of [gross] photosynthesis” (see p. 170 of Zelitch [2001] for the context and attribution).
Instead of directly measuring Vo, Eq. 6 allows A to be modelled by measuring Γ*. This is most commonly achieved using the method of Laisk (1977) as modified by von Caemmerer et al. (1994), which uses the intersection of the linear portion (low CO2 where Vc is small) of multiple photosynthetic CO2 response curves each measured at a different light intensity (low light is favoured for at least one). Figure 2 illustrates how these data are used to calculate constants for Rd and the internal leaf CO2 concentration at which photosynthesis is balanced by photorespiration (ci*) (also described as the compensation point in the absence of Rd). A separate measurement is needed for gm (discussed later), which is then used with Rd and ci* to calculate the equivalent compensation point within the cell, Γ* (Eq. 7) (for recent reviews, see Busch, 2013; von Caemmerer, 2013).
Although this method has been widely used, it is problematic. There is frequently no common intersection of the multiple CO2 responses, so criteria need to be developed for excluding data or measurements have to be repeated (Weise et al., 2015). A new fitting approach has recently been proposed that improves this process (Walker and Ort, 2015), but two conceptual problems with interpreting the gas exchange for determining Γ* remain. One is that Eq. 7 requires Rd, but Rd may not be constant (see the ‘Non-photorespiratory CO2 efflux’ section below). The other is that Eq. 7 also requires gm, and the pathway for diffusion of CO2 back out of leaf cells may be more complicated than originally envisioned. In the Farquhar et al. (1980) model, it is assumed that all respired and photorespired CO2 passes back through the chloroplast before entering the intercellular air spaces of the leaf. However, the CO2 could also enter the cytosol and escape between the chloroplasts, which is a different pathway with a separate set of resistances. Therefore, there would be a different concentration of CO2 in the cytosol of mesophyll cells (cm) than in the chloroplast (Fig. 1). The resistance of this additional path needs to be estimated in order to determine Γ* (von Caemmerer, 2013). A modelling effort by Walker and Ort (2015) used a series of fixed ratios of the resistances through each pathway and argued that the errors caused by not accounting for the two pathways should be small. However, this also assumes that the resistances for each are constant across the measurement conditions. This may not be a safe assumption because the extent to which chloroplasts cover the surface of mesophyll cells exposed to intercellular air spaces (Sc/Sm) is known to affect the diffusion of CO2 out of leaves, and Sc/Sm changes between the high and low light intensities (Busch et al., 2013) used for the Laisk (1977) approach. Given the wide diversity in chloroplast movement among plants (Koniger, 2014), more studies are needed to explicitly examine the frequency with which chloroplast movement is a problem for determining Γ* and Rd.
Aside from chloroplast positioning, diffusion across the chloroplast membrane is dependent on the expression of CO2 permeable aquaporins (Flexas et al., 2006; Uehlein et al., 2008; Heckwolf et al., 2011) and has been modelled as a major resistance between ci and cc (Tholen and Zhu, 2011). Furthermore, there is controversy over the extent to which gm changes in response to CO2 and light and how widely the responses can be generalized across species (Flexas et al., 2007; Tazoe et al., 2009, 2011; Douthe et al., 2011; Gu and Sun, 2014; Nishida et al., 2015; Xiong et al., 2015). If gm is changing when CO2 and light are changed for the Laisk (1977) method, then determining Γ* from ci* would be much more complicated and a single point of convergence for ci* may not exist.
Non-photorespiratory CO2 efflux
Rd is generally an order of magnitude smaller than the maximum rates of Vc and Vo, so for simplicity, Farquhar et al. (1980) assumed Rd was equal to the rate of leaf respiration in the dark (Eq. 1), even though they recognized it was likely to be lower. Since then, there has been a growing consensus that leaf respiration differs significantly between day and night. However, measurements of the inhibition of leaf respiration in the light range widely from 16 to 77% and are affected by light intensity (Sharp et al., 1984; Villar et al., 1994; Atkin et al., 1998, 2000; Shapiro et al., 2004; Ayub et al., 2011; Way et al., 2015). Much of this may be due to a reduction in the cyclic nature of the citric acid cycle when leaves are illuminated (Tcherkez et al., 2009). It has also been shown that rates of day and night leaf respiration can respond differently to sustained drought, with day respiration inhibited by drought more than night respiration (Ayub et al., 2011). In some cases, the ratio of light to dark respiration increases with rising leaf temperature through a reduction in the light suppression of respiration at high temperatures (Way et al., 2015). When considering the importance of environmental effects on respiration, it is important to realize that any condition reducing photosynthesis (e.g. low light, low CO2, low water potential, high and low temperature) often increases the relative importance of respiration.
Beyond respiration of leaf cells, recent work has highlighted the flux of CO2 and bicarbonate from roots to stems, leaves, and, ultimately, the atmosphere via the transpiration stream (for reviews, see Teskey et al., 2008; Bloemen et al., 2015b; Steppe et al., 2015). Respired CO2 from root and stem cells was generally thought to exit the plant near the location it was generated; however, it is now known that a large portion of the CO2 dissolves in the xylem sap (cx) and is transported to other parts of the plant, where some is used for photosynthesis (Teskey and McGuire, 2002; Wertin and Teskey, 2008; McGuire et al., 2009; Aubrey and Teskey, 2009; Bloemen et al., 2013). We are only now beginning to understand how much cx contributes to ci (Fig. 1) and how much is recycled through photosynthesis versus being lost to the atmosphere (Bloemen et al., 2013, 2015a). Given that the gas phase concentration of cx has been measured as high as 26% (i.e. the concentration in air equilibrated with the total dissolved CO2 and bicarbonate; McGuire and Teskey, 2002; Teskey et al., 2008), even a small amount entering leaves could have a large effect. As described in the introduction, a 1% error in leaf respiration scaled up globally represents a flux similar to the uncertainty of global carbon-cycle models.
Since the Laisk (1977) method measures CO2 responses at high and low light intensity, the transpiration rate (and the associated cx efflux) would likely differ between CO2 responses and confound the estimate of ci* and Rd. Efflux of cx into the intercellular spaces is also complicated by the fact that cx is much less likely to have equilibrated with cc before entering the ci pool (Fig. 1). As described earlier for the diffusion of CO2 from the cytosol to the intercellular spaces between chloroplasts, the additional diffusional pathway makes calculation of Γ* from ci* exceedingly complex. Finally, this internal transpiration-dependent CO2 source is not included in calculations of ci, which could contribute to some of the errors discussed below.
Gradient of CO2 between the atmosphere and the chloroplast
CO2 in sub-stomatal cavities
CO2 diffuses as a gas from the atmosphere into the intercellular spaces inside leaves. The diffusion is mostly through stomatal pores that can vary in size and control the diffusion rate. Stomatal dimensions are microscopic, making it difficult to measure the ci. However, the wet internal surfaces of the cells provide a source of water vapour that diffuses out through the same stomata. Realizing this, Moss and Rawlins (1963) suggested that water vapour moving out could act as a tracer for CO2 moving in. The concentration of CO2 inside could then be calculated from the rate of water loss according to Eq. 8:
where ca is the partial pressure of CO2 in the bulk air above the leaf (we convert partial pressures here and below to concentrations, mol mol−1, because of their greater familiarity for the reader), As is the assimilation rate for CO2 moving into the leaf through stomata (mol m−2 s−1), Es is the transpiration rate for water vapour moving out of the leaf through stomata (mol m−2 s−1; Fig. 1), and wi and wa are the water vapour partial pressures in the leaf and bulk air, respectively (converted to concentrations, mol mol−1). The ratio of diffusivities for water vapour and CO2 in air is used to convert the rate of water diffusion into a rate of CO2 diffusion (at 25°C, water vapour diffuses about 1.58 times as fast as CO2, see Massman 1998). In order for CO2 to diffuse in, the partial pressure in the intercellular spaces must be lower than that outside. Accordingly, the terms to the right of the minus sign are the amount by which ci is lower than outside.
This equation and some of its variants (von Caemmerer and Farquhar, 1981; Boyer and Kawamitsu, 2011) are now the norm for determining ci. This equation has the great advantage that gradients for diffusion are undisturbed, and the leaf acts as it normally would. Because ci is calculated inside the leaf, the equation gives the concentration actually available to the photosynthetic process after accounting for effects of stomata. The ci is also the starting concentration for CO2 diffusion through the mesophyll cells to the chloroplasts where assimilation occurs. The Moss/Rawlins relationship thus stands as a great achievement.
Several aspects of the relationship are noteworthy. First, several of the terms are easily measured, such as wa and ca in bulk air above the leaf (i.e. inside a stirred gas exchange chamber), and wi determined from the temperature of the water in the leaf (i.e. the leaf temperature). Second, the crucial measurement is the ratio of As to Es, when Es is 100–1000 times larger than As, it causes the ratio to be very small (0.01 to 0.001). Third, the flood of vapour diffusing out inhibits the trickle of CO2 diffusing in. The reverse is also true, but the trickle does not affect the flood very much. These ternary interactions were first shown by von Caemmerer and Farquhar (1981) and expanded upon by Boyer and Kawamitsu (2011) but will be ignored here for the sake of simplicity. Fourth, all the diffusion is assumed to be in the gas phase moving through stomata. Diffusion through the cuticle and underlying epidermis that cover the leaf between individual stomata is assumed to be small enough to ignore.
Impact of the cuticle on calculated CO2 in leaves
Diffusion through the cuticle and underlying epidermis inevitably does influence the calculations, but when are the affects large enough to cause important errors? As the stomata begin to close, the relative amount of diffusion through the cuticle and epidermis increases. The cuticle/epidermis transmits water vapour 20–40 times faster than it transmits CO2, a rate that is thus vastly different from the 1.58 in Eq. 8 (Boyer et al., 1997; Boyer, 2015a). Consequently, using water vapour as a tracer for CO2 tends to overestimate the amount of CO2 entering the leaf.
This effect can be seen when directly measuring ci by clamping a cup to the abaxial (lower) surface with an airtight seal and allowing it to equilibrate with the CO2 concentration in the leaf (Fig. 3A) (Sharkey et al., 1982). When stomata were open, the cup indicated that measured ci was below calculated ci [ci(calc)]. When abscisic acid (ABA) was fed through the petiole of a detached sunflower (Helianthus annus) leaf to close the stomata, the cup indicated that measured ci was even farther below ci(calc). In this situation, photosynthesis (As) and measured ci decreased while ci(calc) increased. Evidently, the CO2 inside the leaf was being consumed by photosynthesis, and the cup reflected this behaviour whereas ci(calc) did not. The reason for the discrepancy is shown in Fig. 3B, where water loss as a tracer for CO2 clearly overestimated the amount of CO2 entering the leaf as stomata close. The net result in Eq. 8 is that Es is too rapid because of the additional cuticular water loss (Ec) (Fig. 1). The ratio As/Es becomes too small and ci(calc) becomes too high whether stomata are open or not (Boyer, 2015b).
![(A) Gas exchange of a sunflower leaf fed ABA to close the stomata. The leaf was excised and initially fed water, to which 10–4 M ABA was added at the arrow. Shown are the assimilation rate (As), CO2 concentration in the bulk air (ca), CO2 concentration directly measured inside the leaf by sealing a cup to the abaxial surface (ci), and the CO2 concentration calculated for the same leaf [ci(calc)), round grey points] according to Boyer (2015a). Note that As and ci decrease when the stomata close but ci(calc) increases. (B) Transpiration [E(s+c)] and As for the leaf in (A). Transpiration is shown as E(s+c) because water vapour moves through both stomata and the cuticle/epidermis while CO2 moves mostly through stomata. The axes in (B) have been adjusted so the diffusion of water vapour and CO2 are superimposed before feeding ABA. This demonstrates the overestimation of water vapour diffusion after feeding with ABA. Data in (A) are redrawn from Boyer (2015a).](https://oup.silverchair-cdn.com/oup/backfile/Content_public/Journal/jxb/67/10/10.1093_jxb_erw139/4/m_exbotj_erw139_f0003.jpeg?Expires=1750397343&Signature=k3OJUnv~5be~wLt2StPLNB-EqvnFS332CTZA2Xd8c-lZwnLTAJpyDPmALBq8cbtarHAVurT5WQ-TzPMka6-PoyJoHttIDBqDyjhHEgWxz-HSVw6DeyS0wpjLCsxLwpnCudJajEcB1PQzBlVGytrw81yzc8Ov8GsDpEsgimhrVKF93ps8h7vKHfCQE8yqOj-uSml8ApeO2NwLfcqcSP0B0zJxtRYRQESN0c8EJk8TF373u9aJcBOkpOjtEjlVspeg~qs~IUEi5zsGItVFDs3QjVar0yq3zqJ5SHTkJfHVcNEozyU-eVWLiSmuu6SjFbsn1M9EwZAnSpRTzfAhMF4IZA__&Key-Pair-Id=APKAIE5G5CRDK6RD3PGA)
(A) Gas exchange of a sunflower leaf fed ABA to close the stomata. The leaf was excised and initially fed water, to which 10–4 M ABA was added at the arrow. Shown are the assimilation rate (As), CO2 concentration in the bulk air (ca), CO2 concentration directly measured inside the leaf by sealing a cup to the abaxial surface (ci), and the CO2 concentration calculated for the same leaf [ci(calc)), round grey points] according to Boyer (2015a). Note that As and ci decrease when the stomata close but ci(calc) increases. (B) Transpiration [E(s+c)] and As for the leaf in (A). Transpiration is shown as E(s+c) because water vapour moves through both stomata and the cuticle/epidermis while CO2 moves mostly through stomata. The axes in (B) have been adjusted so the diffusion of water vapour and CO2 are superimposed before feeding ABA. This demonstrates the overestimation of water vapour diffusion after feeding with ABA. Data in (A) are redrawn from Boyer (2015a).
Notice that this result was obtained because the cuticle/epidermis contributes substantial water loss. Measurements of transpiration include both stomatal and cuticle loss (E(s+c) instead of Es; Fig. 1). By contrast, the cuticle/epidermis conducts so little CO2 that it can be ignored (As). This happens because water vapour is thought to move only through the wax layer of the cuticle whereas CO2 moves through both wax and epidermis before it enters the intercellular spaces. In effect, the cuticle/epidermis is less of a barrier to water vapour than to CO2 (Boyer et al., 1997; Boyer, 2015a, b).
This fact can be used to determine how much transpiration moves through stomata. By ignoring cuticular transport of CO2 and assuming all CO2 moves through the stomata, CO2 diffusion can be used to estimate how much water vapour should move through stomata (Es). Boyer (2015b) and Tominaga and Kawamitsu (2015b) used this method. Applying it to the experiment in Fig. 3A when stomata were open indicated that 82% of the water vapour moved through stomata and 18% through the cuticle. Consequently, 82% of the measured transpiration should have been used in the calculation instead of the whole amount. When this was done for the data with open stomata in Fig. 3A, ci calculated from Eq. 8 became 231 µmol mol−1 instead of the 269 µmol mol−1 shown in Fig. 3A. In other words, calculated ci became much closer to the ci measured with the cup (220 µmol mol−1). This was also true when ABA was fed through the petiole to close the stomata. With the stomata closed, the difference between calculated and measured ci became very large. Similarly correcting the discrepancy by using CO2 to estimate the stomatal component of transpiration brought the values much closer. Boyer (2015b) and Tominaga and Kawamitsu (2015b) found that ci(calc) then followed the depleted ci measured with the cup. Evidently, the cuticular transport of water vapour makes a difference to ci(calc) whether the stomata are open or not.
Does the cuticle always transport so much water vapour? The amounts vary with leaf and species. Replicates of Fig. 3A displayed stomatal transport of 84%, 91%, and 95% of the total transpiration in sunflower. Stomatal transport in a hypostomatous species (stomata primarily on lower leaf surface) in the genus Vitis ranged from 78 to 97.6% among replicates (Boyer et al., 1997), showing a wide variation between leaves of the same species. Between species, Holmgren et al. (1965) reported stomatal transport of 98% in Betula, 95% in Quercus, 93% in Acer, 84% in Circaea, and 65% in Lamium on average. Kerstiens (1996) reviewed stomatal transport in 200 species measured with various methods and found similar variability among species. Boyer (2015a) found that losses in turgor diminished gas transport across cuticles as the leaves shrank, inevitably shrinking the cuticle. This might account for some of the variability reviewed by Kerstiens (1996) because turgor was typically unknown in these measurements.
The effect of the cuticle is also seen when stomata close at night in a sunflower leaf (Fig. 4A). The ci calculated from Eq. 8 was scarcely above that in the atmosphere (i.e. suggesting low resistance to efflux of CO2) but the atmosphere inside the cup attached to the same leaf showed high resistance to CO2 efflux, such that ci became high inside the leaf (about 600 µmol mol−1). The cup results are expected because As becomes negative (respiration) and CO2 is released inside the leaf. The cup captures this CO2 and the concentration rises until it is the same as inside the leaf. The reason ci(calc) scarcely rose appears to be the rapid diffusion of water vapour used as a tracer for CO2. The conductance for water vapour was higher than for CO2 at night (Fig. 4B).
![(A) Gas exchange of a sunflower leaf darkened at the arrow. Shown are the assimilation rate (As), CO2 concentration in the bulk air (ca), CO2 concentration directly measured inside the leaf by sealing a cup to the abaxial surface (ci), and the CO2 concentration calculated for the same leaf [ci(calc), round grey points] according to Boyer (2015a). Note that As becomes negative in the dark and the leaf produces CO2. (B) Conductances for CO2 (gc) and water vapour (gw) for the leaf in (A). The axes in (B) have been adjusted so the conductances in the light are superimposed in order to highlight the differences after darkening.](https://oup.silverchair-cdn.com/oup/backfile/Content_public/Journal/jxb/67/10/10.1093_jxb_erw139/4/m_exbotj_erw139_f0004.jpeg?Expires=1750397343&Signature=dWn4zyuZ1O66Jjbs~eXkJZVSXnexHIbhmfby51wI5rCP9wWkqI0e2fpQ2ViuPsHL8X2Qti9wYM~aLU~YNWmVBFFM54O1RnNx3ot2IaGPASe938--XeSyINxWp8PK2T0G8lGzfd8h~-DqDQGjKmItou9ETbbXmYQDY~Eq39ozfqeDwe2evHDw9WQ3RgYZHSYD4unAIhlxrg3GC1KTyllkKPjxL3LQ1KtmP774Ao2HsTsY7SVtFOdbKWITe2JBs4PktH8PXZYvkg5Gc3HrArTt0iUR6dPWi3~DACYmHhiaEUOsnpa6~lFRCfUhvJt-oQ-bg9s7nnysp4cIamm7mGvuzw__&Key-Pair-Id=APKAIE5G5CRDK6RD3PGA)
(A) Gas exchange of a sunflower leaf darkened at the arrow. Shown are the assimilation rate (As), CO2 concentration in the bulk air (ca), CO2 concentration directly measured inside the leaf by sealing a cup to the abaxial surface (ci), and the CO2 concentration calculated for the same leaf [ci(calc), round grey points] according to Boyer (2015a). Note that As becomes negative in the dark and the leaf produces CO2. (B) Conductances for CO2 (gc) and water vapour (gw) for the leaf in (A). The axes in (B) have been adjusted so the conductances in the light are superimposed in order to highlight the differences after darkening.
Patchiness effects on measurements of cuticle/epidermis diffusion
Terashima et al. (1988) and Mizokami et al. (2015) considered cuticle/epidermal transport but concluded it was unlikely to be important in the calculations of ci. The only cuticle/epidermal properties available to them were from Boyer et al. (1997) showing a low conductance for grape leaves. Later, cuticle properties were compared in sunflower and grape (Boyer, 2015a) and larger cuticle/epidermal conductances were reported for sunflower than for grape. If the cuticle properties from sunflower had been available to Terashima and co-workers, it is likely they would have included cuticle effects. Holmgren et al. (1965) similarly did not measure cuticle transport of CO2 but noted that it was less than that of water vapour. They showed large variability among species, preventing cuticle properties in one species from predicting those in another. There was also the problem of changes in leaf size with changes in turgor. By working with cuticle properties while the cuticle was intact on the leaf, it was possible for Boyer (2015a) to test whether the inevitable stretching or shrinking resulting from altered turgor changed cuticle properties. As sunflower or grape leaves shrank with decreasing turgor, the cuticle conductance diminished for both gases (Boyer, 2015a).
With this turgor effect plus the water/CO2 discrimination described above, it is difficult to include cuticle properties in Eq. 8. The aforementioned cup is an alternative solution and was first suggested by Sharkey et al. (1982). Because the cuticle/epidermis transmits CO2 slowly, the cup communicates through both the cuticle and stomata. In other words, cuticle properties are taken into account by the cup measurement but not by the calculation in Eq. 8.
If stomatal closure is patchy, stomata in certain areas of the leaf could be closed while others are open. When there are patches that are completely sealed (i.e. no CO2 can be exchanged), it would be expected that the cup would only reflect those areas where stomata are open. However, this model was proved to be incorrect, with CO2 continuing to diffuse slowly through the cuticle of grape leaves despite an absence of stomata, that is, with the stomata on the other surface as closed (sealed) as possible (Boyer et al., 1997; Boyer, 2015b). Moreover, in the dark where closure should be substantial, CO2 continued to be exchanged with the cup (Fig. 4A). Instead, the data indicate that ci measured with the cup communicated with all areas of the leaf, whether stomata were open or not. The ci would probably differ between areas with slow CO2 entry and areas with rapid entry, but the measured ci would reflect averages for the leaf area sealed under the cup. For patchy closure, the smaller the area, the greater the expected variation among ci measured on the same leaf.
Many investigators recognize that Eq. 8 oversimplifies the diffusion situation in leaves. For example, stomata often display an array of sizes in light. As light diminishes, some stomata may close more than others and create patchiness in gas exchange, which could affect the calculations from Eq. 8. Numerous studies have explored these kinds of effects (Beyschlag et al., 1992; Laisk, 1983; Downton et al., 1988; Robinson et al., 1988; Terashima et al., 1988; Sharkey and Seeman, 1989; Daley et al., 1989; van Gardingen et al., 1989; van Kraalingen, 1990; Cheeseman, 1991; Gunasekara and Berkowitz, 1992; Terashima, 1992; Mott et al., 1993; Cardon et al., 1994; Mott, 1995; Buckley et al., 1997; Meyer and Genty, 1998; West et al., 2005). However, Cheeseman (1991) ran numerical models and concluded that patchiness was unlikely to be extreme enough to be important. Gunasekara and Berkowitz (1992) found evidence of patchiness in short-term experiments but not in longer ones. Moreover, patchy closure would affect ci differently from the results shown in Figs 3 and 4. If patchy closure caused the results seen in these figures, water vapour and CO2 diffusion would decrease to the same extent, or water vapour would decrease more than CO2 if CO2 was saturating for photosynthesis. In fact, the reverse occurred. As stomata closed, water vapour diffused out more rapidly than CO2 entered (Figs 3B and 4B).
Although the cup measurements shown would not have been affected, patchiness of stomatal aperture, CO2 assimilation, light harvesting, and even leaf temperature are not routinely monitored. The spatial variation in photosynthesis is an area of research that requires more attention.
Calculated versus directly measured CO2 in leaves
The simplicity of Eq. 8 for calculating ci is advantageous. However, the omission of cuticle properties is a problem and, given the high variability between species and even between replicates of the same species, it would be necessary to know the cuticle properties for each leaf. Add to this the effect of turgor, which can vary cuticle conductance without visual symptoms (i.e. without wilting the leaf), and it seems impossible for the calculations to take cuticle properties into account. If a way to include cuticle properties in Eq. 8 could be found without altering leaf turgor, calculated ci might be useful. Gradients in the leaf would be unaltered and ci could be determined from standard gas exchange measurements.
Without that possibility, however, Tominaga and Kawamitsu (2015a) recently modified a commercially available instrument to allow cup-based measurements of ci (Li-Cor LI6400XT). Instead of clamping a cuvette onto a leaf to calculate ci from both leaf surfaces, the cup measurements were made on the abaxial surface while the calculated measurements were made on the adaxial (upper) surface of the same leaf area. This allowed a rigorous comparison between direct measurements and calculated ones. In general, the direct measurements were lower than calculated ones. If stomata were open, the difference had little effect on the As–ci relationship (Fig. 5A). When stomata were closed by feeding ABA through the petioles of the excised leaves, the As–ci relationship became quite different (Fig. 5B). The closure caused the cuticle properties to dominate the calculation, and the initial slope of the calculated As–ci relationship reflected cuticle properties that overestimated CO2 entry (i.e. ci was higher when calculated than when directly measured). Taken at face value, photosynthetic metabolism appeared highly altered by stomatal closure if calculated ci were used but not when measurements were made with the cup on the same area of leaf. Tominaga and Kawamitsu (2015b) attributed the difference to the cuticle/epidermis, pointing out that the calculations did not include cuticle/epidermal effects (Eq. 8) but the cup did. This altered As–ci relationship may have large consequences for the determination and interpretation of Γ* (Fig. 2).
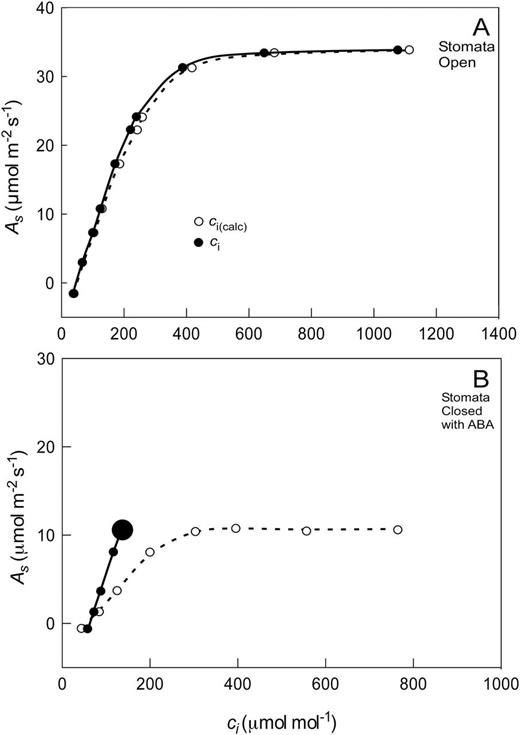
(A) As–ci relationship for sunflower leaf with open stomata. (B) As–ci relationship after closing the stomata with 10–4 M ABA. The large data point indicates multiple data on top of each other at higher ci because stomata closed more tightly as ci increased. Redrawn from Tominaga and Kawamitsu (2015a, b).
In principle, perhaps the Tominaga and Kawamitsu (2015a, b) approach could be applied more widely. Care would be needed to ensure the seal between the cup and the leaf was completely airtight, which can be tricky when thick vasculature is present. While there is no doubt that this closed cup system will result in a change in the gradient of CO2 in leaves that are amphistomatous (stomatal numbers similar on both leaf surfaces) (Parkhurst et al., 1988; Parkhurst and Mott, 1990), it is also possible to attach the cup to the top of the leaf. An optically clear cup sealed to the adaxial surface would change the CO2 gradient of an amphistomatous leaf to one resembling that of a hypostomatous leaf. This is similar to attaching the cup to the bottom of the leaf but with the gradient inverted. Even in a hypostomatous leaf, there would be slow exchange of CO2 across the adaxial astomatous cuticle, but miniaturization of the flow path might improve the rate of equilibration. Having the ability to measure the ci of amphistomatous and hypostomatous leaves would open up an array of uses for the instrument. It also might be possible to investigate the mesophyll conductance using the Tominaga–Kawamitsu unit.
In summary, ci measured with the cup was more accurate than the ci calculated from Eq. 8. This finding appears to be because the equation neglects to include the cuticle properties. Without the ability to include cuticle properties, the cup measurement is preferred.
CO2 in the chloroplast
Equation 6 illustrates one of the ways in which cc is essential for the Farquhar et al. (1980) model, and calculating cc requires knowledge of gm, as shown here:
Equation 9 illustrates how errors in ci, as discussed in the prior section, cause a direct offset in cc such that neglecting cuticular/epidermal conductance could cause errors over 200ppm. However, Eq. 9 glosses over a second need for ci in the determination of gm. All methods for measuring gm require ci (Pons et al., 2009), so we emphasize the need for more direct measurements of ci in order to avoid unnecessary artefacts. The additional assumptions and potential artefacts of all methods were also recently reviewed (Gu and Sun, 2014). One significant problem was the reliance on the Laisk (1977) method for determining Rd and Γ*, a method that also neglects the contribution of the cuticle (some of the circularity was discussed earlier).
However, examining the simple and complete equations for isotopic discrimination (Farquhar et al., 1982; Evans et al., 1986) reveals a way to screen for and even correct artefacts caused by errors in estimates of Rd and Γ*.
Biochemical and diffusional processes occurring during photosynthesis result in net discrimination against 13CO2. A simplified two-step model of diffusion followed by carboxylation that assumes (i) cc equals ci (as is the case if gm is very large) and (ii) that there are no fractionations associated with mitochondrial respiration or photorespiration can be used to generate a predicted discrimination (Δi). The equation in C3 leaves, modified to include boundary layer conductance, is:
where ab and a are the fractionations occurring during diffusion through the boundary layer and through still air (respectively). Fractionation values for diffusion through air are derived from theoretical estimates of the ratio of diffusivities of 12CO2/13CO2 in the slightly turbulent boundary layer of a leaf (1.0029; see Farquhar, 1983) and through still air based on their reduced masses (1.0044; Craig, 1954; O’Leary, 1981). Net fractionation from carboxylation (b) by Rubisco and phosphoenolpyruvate carboxylase (PEPC) is generally assumed to be 1.029 for Nicotiana tabacum (Evans et al., 1994). In a few species, the Rubisco portion of b has been measured independently (McNevin et al., 2006, 2007) and it is important to use the best data available for b (Gu and Sun, 2014). Ambient, leaf surface, and internal leaf partial pressures of CO2 (ca, cs, and ci, respectively) are used to scale each fractionation proportionately to the CO2 drop between each location.
A more detailed model of discrimination is necessary for investigating gm, and for effects of fractionation by mitochondrial respiration in the light (e) and photorespiratory fractionation (f). The full classical model of 13C discrimination during photosynthesis is then (Farquhar et al., 1982):
where a1 (1.0007) is the fractionation associated with diffusion through leaf water, bs is fractionation as CO2 moves into solution (1.0011 at 25°C), and k is the carboxylation efficiency. Formal equations for correcting b (above) with a value (β) that accounts for non-negligible amounts of PEPC and other carboxylase activities in C3 plants are described elsewhere (Farquhar and Richards, 1984; Raven and Farquhar, 1990).
The isotopic approach for determining gm is accomplished by combining Eqs 8, 9, and 10 (as in Evans et al. 1986):
obtaining Δi and other variables from standard gas exchange (or assumed values for constants) and replacing Δ with observed discrimination (Δobs) via online stable isotope gas exchange as follows:
where δe and δo are the isotopic compositions of CO2 entering and leaving the leaf cuvette, respectively. ξ = ce/(ce – co), with ce and co being the partial pressures of CO2 in air entering and leaving a well-mixed leaf cuvette.
It should be noted that the above discrimination model was derived with the simplifying assumptions that respiratory substrates have an isotopic composition given by recent photosynthetic processes that include the decarboxylation of glycine, and that after Rubisco fixation there are no further fractionations (Farquhar et al., 1982). These assumptions may be unjustified (Tcherkez et al., 2004), and modifications to better accommodate additional fractionations have been developed (see Evans and von Caemmerer, 2013 and references therein) as well as corrections for ternary effects associated with stomatal conductance (Farquhar and Cernusak, 2012). We have left out these more recent modifications for the sake of clarity when discussing the following approach.
When considering Eq. 11, it is important to realize that if there is no CO2 efflux in the light (i.e. from respiration or photorespiration), then the value of δe will have no effect on Δobs in Eq. 13 because fractionations from diffusion and carboxylation will generate the same difference between δe and δo, irrespective of the absolute value of δe. However, if there is any CO2 efflux out of the leaf, it will have an isotopic composition that reflects the source material and any additional fractionations. If we assume that the isotopic composition of effluxed CO2 is around −20‰, then if δe is also −20‰ the effluxed CO2 would not change δo − δe. However, the more that δe deviates from −20‰, the larger the effect on δo − δe. The potential for this effect is included in the right-hand side of Eq. 11 and the bottom of Eq. 12, (eRd/k + fΓ*)/ca, where e and f are the isotopic compositions of respired and photorespired CO2, respectively. Unfortunately, Rd and Γ* are required to scale the effect to the magnitude of the efflux through each pathway. As noted earlier, this is problematic for determining gm because gm is needed to calculate Γ* (Eq. 7). Gu and Sun (2014) highlight additional problems with methods for determining Rd and Γ*, and conclude that existing data on gm, Rd, and Γ* should be treated with great caution.
Fortunately, we can exploit the sensitivity of Eq. 11 to δe by measuring Δobs. This is done by using a δe near the isotopic composition of effluxed CO2, and then rapidly repeating the measurement of Δobs while changing δe to a value far from that of effluxed CO2. The difference in Δobs between these two measurements (dΔobs) then represents the combined effect of the rate and isotopic composition of effluxed CO2 from all sources, represented as (eRd/k + fΓ*)/ca in Eqs 10 and 11. Conveniently, this would also incorporate effects of xylem-transported CO2 and eliminate the need to determine Rd, Γ*, e, and f to determine gm in a manner that is independent of Rd and Γ*. All that would be needed would be to scale dΔobs to the magnitude of the difference between the two values of δe and use the resulting value as an approximation of (eRd/k + fΓ*)/ca in Eq. 12. Furthermore, if the magnitude of dΔobs is the same between treatments, then one can reasonably conclude that any changes in gm would not be artefacts of changing CO2 efflux. As a proof of concept, we tested this approach using δe values of −4‰ and +148‰ across a light-response curve (Fig. 6). If Rd is constant or increasing as A declines with light intensity, then dΔobs should increase at low light, which is what we see in Fig. 6, especially at and below photosynthetically active radiation (PAR) values of 200 µmol m−2 s−1. We also compared measurements of dΔobs at 2% and 21% oxygen and found that dΔobs decreased when photorespiration was suppressed, as expected (Fig. 7). Therefore, we believe that this approach has great promise for magnifying the effects of small but critical fluxes, thereby improving our ability to detect and quantify them. Future studies describing the approach in detail are forthcoming.

Light response of photosynthetic discrimination, Δobs, in Nicotiana tabacum measured at 400ppm CO2 with δe values of −4‰ and +148‰. The same leaf area was measured for each δe by starting with −4‰, transiently switching to +148‰ for 5–10min, and then returning to −4‰ until Δobs matched the prior Δobs at −4‰ (usually less than 10min) before proceeding to the next light intensity. This demonstrates that CO2 efflux from leaves has large effects on Δobs when leaves are provided air with 13C-enriched CO2, and that the effect is not constant across light intensities. N = 2.
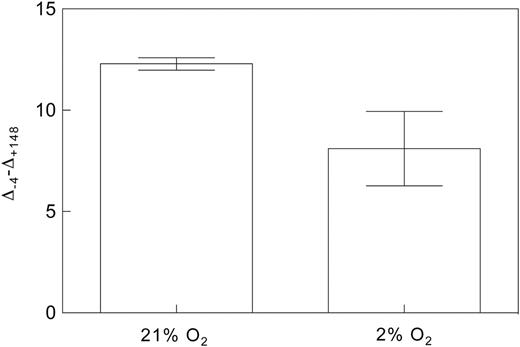
Oxygen sensitivity of dΔobs (Δ-4–Δ+148) in Populus deltoides measured at a PAR of 200 µmol m−2 s−1 and 400ppm CO2 with δe values of −4‰ and +148‰. The same method was used as described for Fig. 6. This demonstrates the utility of this method for detecting CO2 efflux from photorespiration. N = 3.
Why are these small flux errors so important now?
Significant efforts are underway to characterize plant functional traits such as photosynthesis and respiration in non-model species under a broad range of environmental conditions (e.g. Atkin et al., 2015). This effort is driven by the need to improve predictions of plant responses to a ‘new normal’ of warmer, drier (i.e. stressful) environmental conditions and the impact on Earth system models of the global carbon cycle and climate change (Friedlingstein et al., 2006; Bodman et al., 2013; Schimel et al., 2015). This has been given a greater sense of urgency owing to the assessment that mean precipitation will likely decrease in many mid-latitude and subtropical dry regions during this century (IPCC, 2014). Furthermore, water limitation is already a global problem, with 97% of the terrestrial surface experiencing periods of water deficit at least one month per year (Jenerette et al., 2012), several observations of widespread plant stress and mortality during intense droughts (Allen et al., 2010), and predictions of future ‘megadroughts’ in the Southwest and Central Plains of Western North America (Cook et al., 2015).
This motivation along with the growing population is also pushing efforts to re-engineer plants for ultra-high photosynthesis and reduced water requirements (Price et al., 2011; Peterhansel et al., 2013; Lin et al., 2014a, b; Borland et al., 2015; Carmo-Silva et al., 2015; Long et al., 2015) and to improve our understanding of poorly studied (non-broad leaf) photosynthetic tissues, such as photosynthetic branches that are especially important in arid environments (Ávila et al., 2014). Each of these efforts is affected by assumptions made in the methods used for measuring carbon and water fluxes and by how those data are interpreted and used in models.
Recently, serious concerns have been raised about the validity of common approaches for measuring critical parameters in photosynthetic models (Gu and Sun, 2014; Boyer, 2015a, b). Here, we have reviewed these concerns, highlighted additional problems, and offered potential solutions. Fortunately, the problems are tractable, but they will require significant research efforts to be resolved.
Acknowledgements
This work was supported by NSF grant IOS-0719118, the NSF EPSCoR Program under Award # IIA-1301346, and NIH grant NIH-NCRR P20RR18754, all at the University of New Mexico. Any opinions, findings, and conclusions or recommendations expressed in this material are those of the authors and do not necessarily reflect the views of the National Science Foundation.
References
Author notes
Editor: Martin Hagemann, University Rostock

Comments