


Abstract
Field-emission scanning electron microscopy was used to measure wall thicknesses of different cell types in freeze-fractured hypocotyls of Arabidopsis thaliana. Measurements of uronic acid content, wall mass, and wall volume suggest that cell wall biosynthesis in this organ does not always keep pace with, and is not always tightly coupled to, elongation. In light-grown hypocotyls, walls thicken, maintain a constant thickness, or become thinner during elongation, depending upon the cell type and the stage of growth. In light-grown hypocotyls, exogenous gibberellic acid represses the extent of thickening and promotes cell elongation by both wall thinning and increased anisotropy during the early stages of hypocotyl elongation, and by increased wall deposition in the latter stages. Dark-grown hypocotyls, in the 48 h period between cold imbibition and seedling emergence, deposit very thick walls that subsequently thin in a narrow developmental window as the hypocotyl rapidly elongates. The rate of wall deposition is then maintained and keeps pace with cell elongation. The outer epidermal wall is always the thickest (∼1 μm) whereas the thinnest walls, about 50 nm, are found in inner cell layers. It is concluded that control of wall thickness in different cell types is tightly regulated during hypocotyl development, and that wall deposition and cell elongation are not invariably coupled.
Introduction
During cell expansion, new polymers must be incorporated into the growing wall otherwise it would thin until ruptured by turgor pressure (Richmond et al., 1980). This might imply that wall biosynthesis and cell expansion are co-ordinately regulated and interdependent processes. However, examples have been presented in different species and organs, where wall thickness is reduced (Sargent et al., 1974; Schnepf and Deichgräber, 1979; Phillips and Kende, 1980; Kutschera, 1990; Refregier et al., 2004), increased (Fujino and Itoh, 1998), or unchanged (Ray, 1962; Meinert and Delmer, 1977) in growing cells compared with non-growing cells. However, all three scenarios have not been described in the same organ during development. Cases where reductions in wall thickness have been observed suggest that the deposition of additional wall material is not a prerequisite for cell expansion.
Cell wall analyses have been made on a variety of elongating plant organs that include cereal coleoptiles (Ray, 1962, 1967; Edelmann et al., 1989), pea internodes (Sargent et al., 1974; Fujino and Itoh, 1998), sunflower (Kutschera, 1990), and mung bean hypocotyls (Goldberg and Prat, 1982; Roland et al., 1982). More recently, the Arabidopsis hypocotyl has been used as a genetic model to study organ elongation, because of its simple anatomy, the availability of mutants, and because growth occurs by cell elongation with almost no contribution from cell division (Gendreau et al., 1997; Raz and Koornneef, 2001; Saibo et al., 2003). Mutations in numerous cell wall-related genes (Desnos et al., 1996; Nicol et al., 1998; Fagard et al., 2000; His et al., 2001) make it a powerful system to study the role that particular wall components play in regulating cell elongation. In addition, hypocotyl growth is modulated by environmental stimuli, such as light (Quail et al., 1995; Sidler et al., 1998), temperature (Desnos et al., 1996), and nutrition (Smalle et al., 1997; Kurata and Yamamoto, 1998), and by internal growth factors (Collett et al., 2000). Different extremes of hypocotyl elongation can thus be obtained by manipulating a variety of both intrinsic and extrinsic cues.
The detailed changes that occur in wall thickness during hypocotyl elongation were investigated in Arabidopsis. Using cryo-field-emission scanning electron microscopy (cryo-FESEM), cell wall thickness was measured in hypocotyls prepared by rapid plunge-freezing in liquid nitrogen slush and then freeze-fracturing perpendicular to their long axes. Thickening, thinning, and maintenance of wall thickness were observed within this single organ, depending upon cell type, growth conditions, and developmental stage. It was concluded that wall thicknesses are developmentally regulated, are dependent upon the carbon resources available to the cell, and that, at least in Arabidopsis hypocotyls, the processes of wall deposition and cell elongation are not tightly coupled.
Materials and methods
Plant material and growth conditions
Seeds of Arabidopsis thaliana L. (Heynh) ecotype Landsberg erecta were surface-sterilized by immersion in 5% (v/v) Vortex bleach (containing 5–15% chlorine-based bleach) for 5 min, and washed three times in sterile distilled water (sdH2O). Seeds were suspended in sdH2O and sown on the surface of medium containing 1× Murashige and Skoog (MS) basal salts (micro- and macro-elements) supplemented with 3% (w/v) sucrose (pH adjusted to 5.7) and solidified with 0.5% (w/v) Phytagel™ in 9 cm square Petri plates. For some plates, a filter-sterilized stock solution (1 mM) of gibberellic acid4 (GA4) in 50% (v/v) ethanol was added to the molten medium to give a final concentration of 1 μM. All plates were placed in darkness at 4 °C for 48 h to stimulate and synchronize germination. For ‘light-grown’ hypocotyls, plates were then transferred to a growth room maintained at 25 °C and incubated horizontally under fluorescent lamps (with a fluence rate of 70 μmol m−2 s−1 at bench level) in continuous white light. For ‘dark-grown’ hypocotyls, plates were subjected to the same growth conditions, except that they were wrapped in two layers of aluminium foil.
Organ measurements
Hypocotyl length was measured as the distance between the top of the root hairs around the collet, and the base of the ‘V’ made by the petioles of the cotyledons (Scheres et al., 1994). Hypocotyl lengths were taken from seedlings (mounted in a film of water between a glass slide and cover slip to prevent dehydration) using a binocular microscope fitted with an eye-piece graticule. Hypocotyl volume was calculated as for a cylinder, with the diameter obtained from light and scanning electron micrographs of the mid-point of the hypocotyl.
Plunge-freezing, freeze-fracture, and FESEM
Hypocotyls were mounted in a vertical position on aluminium stubs with O.C.T. compound (Agar Scientific Ltd) and plunge-frozen at –210 °C in liquid nitrogen slush. After freezing, samples were immediately loaded into the cryo-chamber of the scanning electron microscope, equilibrated with the stage at –100 °C, and fractured transversely using a cold scalpel blade near the mid-point of the hypocotyl. The temperature was lowered to –110 °C, the samples were sputter-coated with platinum for 2 min at 10 mA, and then transferred to the imaging stage at –130 °C to –150 °C for analysis. Intact hypocotyls used for counting numbers of cells in epidermal files were mounted in a horizontal position on adhesive carbon tabs (Agar Scientific Ltd) and plunge-frozen as described above.
Images were obtained using a Philips XL 30 FESEM (FEI Co., Eindhoven, The Netherlands) fitted with a cryostage (CT1500 HF; Oxford Instruments, Abingdon, Oxford, UK), operating at 3 kV and a working distance of between 5 mm and 15 mm. Using the imaging software, hypocotyl cell wall thickness was measured at five locations: epidermis (outer and inner wall), outer cortex, inner cortex, and endodermis. Inner walls were measured at cell corners to define clearly a single cell wall, particularly in thin walls (Fig. 2I), and to avoid the compression effects observed between adjacent cells that altered measured wall thickness by up to 10% (data not shown). Wall perimeters were measured from FESEM micrographs using the freehand line tool in ImageJ 1.33 software (http://rsb.info.nih.gov/ij/).
Transmission electron microscopy (TEM) and material preparation
Seedlings were fixed in 2.5% (v/v) glutaraldehyde (Agar Scientific Ltd) in 50 mM sodium cacodylate buffer (BDH Laboratory Supplies) adjusted to pH 7.3, for 16 h at room temperature, and then low-temperature-embedded according to Wells (1985). Ultra-thin gold transverse sections of ∼90 nm were cut using a glass knife on a Reichert ultramicrotome (Leica, Milton Keynes, UK), and collected onto 200 mesh copper grids (Agar Scientific Ltd) which had been pre-filmed with 4% (v/v) pyroxylin (Agar Scientific Ltd) in amyl acetate (BDH Chemicals Ltd) and carbon coated. The sections were stained with 2% (w/v) uranyl acetate for 1 h and 1% (w/v) lead citrate for 1 min, washed in water, and air-dried. The grids were viewed in a Jeol 1200 EX transmission electron microscope (Tokyo, Japan) operating at an accelerating voltage of 80 kV and photographs were taken on Kodak electron image film.
Uronic acid assay
Using a binocular microscope, hypocotyls were excised precisely just above the collet, at the base of the ‘V’ made by the petioles, using fine-tipped forceps and a razor blade. Upon excision, hypocotyls were transferred to a microfuge tube containing absolute ethanol and heated to 85 °C for 20 min to extract chlorophyll, sugars, and other small molecules. An additional extraction was made in 80% (v/v) ethanol at 85 °C for a further 20 min, and then samples were rinsed 3× in sdH2O. Samples were suspended in a small volume of sdH2O, frozen in liquid nitrogen, and freeze-dried. Total uronic acid was assayed using a scaled-down version of the method described by Filisetti-Cozzi and Carpita (1991) to accommodate very small amounts of cell wall material.
Freeze-dried samples, still in their original microfuge tube, were suspended in 200 μl sdH2O and ground for 3 min using a miniature homogenizer to produce a milky suspension. Exactly 20 μl of 4 M sulphamic acid/potassium sulphamate were added and mixed. The contents of the tube were hydrolysed with 1.2 ml concentrated H2SO4 with immediate vortex, and then 50 μl 0.1% (w/v) carbazole in 100% ethanol (freshly made just before use), followed by an additional vortex. Sealed tubes were placed in a boiling water bath for 15 min to produce a pink chromagen and cooled to room temperature for 15 min before measurement of absorbance. A standard curve from 50 nmol to 400 nmol was prepared from a 2 mM D-galacturonic acid stock (pH 4.4).
For light-grown material, 50–100 hypocotyls were used for each assay; for dark-grown material, 30 hypocotyls were used for each assay. Each assay was replicated nine (light-grown) and five (dark-grown) times and the mean ±standard error calculated for each treatment.
Hypocotyl cell wall mass determination
Freeze-dried hypocotyls, prepared as for uronic acid measurements, were resuspended in an excess (50 μl) of 0.1 M sodium acetate buffer (pH 4.3), frozen in liquid nitrogen, and ground thoroughly to form a suspension. Dimethyl sulphoxide was added to 90% (v/v) and samples were boiled for 20 min at 100 °C to gelatinize starch. After centrifugation, the pellet was washed several times in sodium acetate buffer before resuspending in the same buffer containing 2% (v/v) amyloglucosidase (Roche Diagnostics GmbH, Mannheim, Germany) and incubated overnight at 37 °C. Further centrifugation and washes produced a pellet that did not stain with iodine. This was then freeze-dried and used for mass determination. For light-grown material, 300 hypocotyls were used for each assay; for dark-grown material 80 hypocotyls were used for each assay. Assays were replicated five times and the mean ±standard error calculated for each treatment.
Calculation of wall volume
Wall volume was calculated from fracture faces by multiplying the perimeter of each wall by wall thickness (Fig. 3), and by hypocotyl length (Table 1). The perimeters of each wall were pooled from three hypocotyl fracture faces and the mean ±standard error calculated for each treatment and developmental stage (data not shown). The standard error was incorporated into the final calculation as described previously (Armitage and Berry, 1987). The calculated wall volume does not include transverse walls.
Hypocotyl lengths and volumes at the developmental stages described in Fig. 1
| Stage | Growth conditions | ||
| Light, no GA | Light, +GA | Dark | |
| Hypocotyl length (mm) | |||
| I | 0.31 | 0.31 | 0.31 |
| IIa | 0.55 | 0.37 | 0.54 |
| IIb | n/a | 0.55 | 0.95 |
| IIc | n/a | n/a | 1.47 |
| III | 0.99 | 1.47 | 8.73 |
| IV | 1.84 | 2.93 | 17.15 |
| Hypocotyl volume (mm3) | |||
| I | 0.005 | 0.005 | 0.005 |
| IIa | 0.017 | 0.012 | 0.020 |
| IIb | n/a | 0.020 | 0.041±0.005 |
| IIc | n/a | n/a | 0.080 |
| III | 0.054 | 0.067 | 0.407 |
| IV | 0.127±0.016 | 0.151 | 0.657 |
Mean values are given ±SE (n=14). Standard errors <10% of the mean are not given. Mean volumes were calculated as for a cylinder from diameters measured half way along the length of the hypocotyl. n/a=not applicable.
Growth rate measurements
After 2 d (light-grown) and 4 d (dark-grown) incubation in the growth room, two ink marks were applied (∼150 μm apart for light-grown, ∼2 mm apart for dark-grown) using a fine-tipped felt pen (xylene-free) on the hypocotyl surface, at the mid-point along the longitudinal axis of the organ. The distance between the marks was recorded and measured after a further 2 d of growth. The difference between the marks was used to calculate mean rate of growth ±standard error in this region of the hypocotyl (light-grown hypocotyls, n=12; dark-grown hypocotyls, n=18). Dark-grown hypocotyls were marked under green light to avoid any white light inhibition of growth. Manipulation of seedlings had no effect on hypocotyl growth or final length.
Results
Growth analysis of hypocotyls
Three treatments were used to modulate growth of Landsberg erecta hypocotyls on plates supplemented with 3% sucrose. For the first treatment, seedlings were grown in continuous light. In a second treatment, 1 μM gibberellic acid (GA) was added to the medium to promote growth rate and final hypocotyl length of seedlings grown in continuous light. In the third treatment, seedlings were grown in continuous darkness and became etiolated. Hypocotyls were analysed at various stages of development: stage I at the embryo stage prior to germination, stage II at the onset of germination, stage III at 50% of their final length, and stage IV immediately after cessation of growth (Fig. 1).
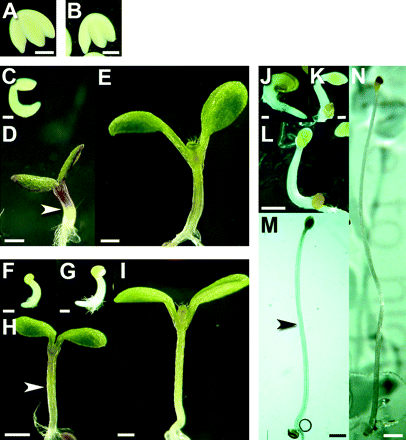
Developmental stages of seedlings. (A, B) Embryos extracted from seed after 48 h imbibing in the absence (A) and presence (B) of gibberellic acid in complete darkness at 4 °C (stage I). (C–E) Seedlings grown in continuous light: stage IIa (C), stage III (50% final length) (D), stage IV (final length) (E). (F–I) Seedlings grown in continuous light on GA-supplemented media: stage IIa (F), stage IIb (G), stage III (50% final length) (H), stage IV (final length) (I). (J–N) Seedlings grown in continuous dark: stage IIa (J), stage IIb (K), stage IIc (L), stage III (50% final length) (M), stage IV (final length) (N). Scale bars: A, B, C, F, G, J, K= 0.2 mm; D, E, H, I, L=0.5 mm; M=0.8 mm; N=1 mm. Arrowheads in D, H, and M indicate fracture points displayed in Fig. 2A, B, and C, respectively.
Seeds were incubated on GA-free and GA-containing media in darkness at 4 °C for 48 h, prior to growth in light or dark at 25 °C. Embryos were extracted from their seed coats to measure the effects of GA during vernalization. GA had no effect on embryonic hypocotyl length, measured at 0.31±0.01 mm (Fig. 1A, B). After 36–48 h at 25 °C, germination had begun but seedling emergence proceeded at different rates and showed different degrees of variability in the three treatments. Hypocotyls grown in continuous light without GA were relatively uniform in length (Fig. 1C). When grown in continuous light with GA, however, hypocotyl lengths at 36–48 h were more variable. For subsequent analyses, seedlings were assigned to two stages, stage IIa (Fig. 1F) and stage IIb (Fig. 1G), according to length. Dark-grown hypocotyls were even more variable in length. They were assigned to three stages according to length: stage IIa, IIb, or IIc (Fig. 1J, K, L, respectively). Mean hypocotyl length at these and subsequent stages are shown in Table 1. Different degrees of variation in hypocotyl length for the treatments may be due to more variable rates of germination in some treatments than others. After 3 d, light-grown seedlings had expanded cotyledons and hypocotyls reached 50% of their final length (stage III). This length was ∼50% greater with GA than without (Fig. 1D, H). Dark-grown hypocotyls reached 50% of their final length after 5 d. Cotyledons had not expanded at this stage (Fig. 1M). Hypocotyls of light-grown seedlings ceased elongating after 7 d. The final length (stage IV) was ∼70% greater with than without GA (Fig. 1E, I). At this stage, cotyledons were fully expanded, true leaves were emerging from the shoot apex, and hypocotyls were greener than at earlier stages of development. Hypocotyls of dark-grown seedlings stopped elongating after 10 d. Cotyledons remained unexpanded (Fig. 1N).
Hypocotyls elongate 6-fold in the light compared with the embryonic stage, and >9-fold in the presence of GA, whereas in the dark they grow >50-fold longer. Hypocotyls also increase in diameter during the course of elongation, thus contributing to an increase in volume. In light-grown hypocotyls, diameters increase at all developmental stages, although to a lesser extent in GA-treated hypocotyls. The restriction of hypocotyl diameter by GA results in only a 20–25% increase in volume compared with seedlings grown without GA, at stages III and IV, despite the 50–60% increase in length at these stages. Dark-grown hypocotyls increase in diameter during the early stages of growth at a slightly greater rate than hypocotyls grown in the light, but are narrower by stage III and again by stage IV. As a result, hypocotyls increase in volume 25-, 29-, and 129-fold from the embryonic size in light-, light+GA, and dark-grown seedlings, respectively (Table 1).
Wall thickness and volume are preserved in freeze-fractured hypocotyls
Next, the changes in cell wall thickness and volume that accompany the changes in cell elongation described above were examined. Arabidopsis hypocotyls consist of a layer of epidermal cells that surrounds two layers of cortical cells, outer and inner. Within the cortex lie the endodermis, pericycle, and stele. Using cryo-FESEM, cell wall thickness was first measured in stage III hypocotyls, at the mid-point (Fig. 1D, H, M). Extension rates in this region of the hypocotyl at 50% final length were 80±10, 190±20, and 2290±79 μm d−1 when grown with no GA, with GA, and in darkness, respectively (data not shown). Seedlings were plunge-frozen in liquid nitrogen slush and hypocotyls fractured transversely to reveal the cell layers. Due to the steep, acropetal nature of hypocotyl growth in the dark, it is not always possible to hit the same set of cells for each growth stage. Nevertheless, subsequent growth stages following stage I will, at the fracture plain, show cells that are either going through or have gone through the elongation phase that cells in the previous stage would have to go through, and the thickness of the walls in these cells. This is less pronounced in light-grown hypocotyls; therefore hitting the same set of cells is more consistent. Typical micrographs of freeze-fractured hypocotyls at this stage are shown in Fig. 2. Wall thickness was measured in the outer epidermal wall (OE), the inner epidermal wall (IE), outer cortex (OC), inner cortex (IC), and endodermis (EN) (Fig. 2A–C). Typical micrographs of outer and inner epidermal walls are shown in Fig. 2D–I.
Using the dimensions taken from the perimeter of the wall location, wall thickness (Fig. 3), and organ length (Table 1), wall volumes in stage III hypocotyls were then calculated (see Materials and methods); these are shown in Table 2. Assuming that wall density is constant, GA did not affect wall deposition at stage III, and dark-grown hypocotyls had only 2.6-fold more wall than light-grown seedlings.
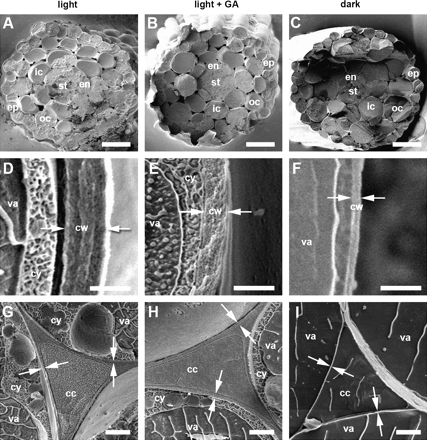
Scanning electron micrographs of freeze-fracture surfaces in hypocotyls at 50% final length (stage III). (A–C) Low magnification electron micrographs showing typical results of freeze-fracture transverse to the long axis of the hypocotyl at mid-point. Cell layers: ep, epidermis; oc, outer cortex; ic, inner cortex; en, endodermis; st, stele. (D–I) High magnification electron micrographs of outer epidermal cell wall (D–F) and walls at the cell corners of the inner cell layers (G–I). Arrows indicate typical sites between which wall thicknesses were measured. Abbreviations: cw, cell wall; cy, cytoplasm; va, vacuole; cc, cell corner. Scale bars: A–C=50 μm; D–F=1 μm; G–I=2 μm.
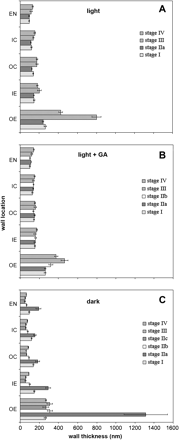
Cell wall thicknesses of hypocotyls freeze-fractured at their mid-points at the developmental stages described in Fig. 1 (A, light-; B, light+GA-; C, dark-grown hypocotyls). Mean thicknesses are given ±SE (n=23) pooled from five hypocotyls for each treatment and developmental stage. Walls in outer epidermis (OE), inner epidermis (IE), outer cortex (OC), inner cortex (IC), and endodermis (EN) were measured.
Comparison of hypocotyl cell walls at 50% final hypocotyl length (stage III)
| Growth conditions | |||
| Light, no GA | Light, +GA | Dark | |
| Uronic acid content (nmol hypocotyl−1) | 2.31±0.09 (1.00±0.03) | 2.43±0.10 (1.05±0.04) | 6.26±0.45 (2.71±0.19) |
| Wall mass (μg hypocotyl−1) | 1.65±0.13 (1.00±0.08) | 1.75±0.04 (1.06±0.02) | 4.06±0.22 (2.46±0.13) |
| Wall volume (μm3×10−6) | 1.58±0.31 (1.00±0.20) | 1.43±0.28 (0.90±0.20) | 4.07±0.62 (2.57±0.15) |
Uronic acid content and wall mass and wall volume were determined as described in the Materials and methods. Mean values are given ±SE. Values normalized to light-grown hypocotyls, no GA, are given in brackets.
To confirm that this method provides an accurate measurement of in vivo wall thickness and volume, and is not an artefact of sample preparation, both content of uronic acid, a major primary cell wall component, and wall mass (after removal of starch) of stage III hypocotyls were assayed (Table 2). Normalized values show that the relative differences in uronic acid content and wall mass are consistent with the relative differences in wall volume.
Cell wall thickness was also measured at the same location in stage III hypocotyls that had been prepared for TEM (see Fig. S1 in Supplementary data available at JXB online). The measurements obtained by TEM are, in most cases, much greater than those obtained using FESEM, with some walls appearing more than twice as thick when prepared in this way (see Fig. S2 in Supplementary data available at JXB online). Wall thickness measurements obtained by TEM were used to calculate total hypocotyl wall volume. Normalized values show that the relative differences in uronic acid content and wall mass are inconsistent with the relative differences in wall volume (see Table S1 in Supplementary data available at JXB online). Although the thin sectioning technique allows greater control over sampling the mid-point of the hypocotyl, the differential wall swelling induced by this method cannot therefore be relied upon to give an accurate description of in vivo wall thickness.
Cell walls change in thickness during hypocotyl growth
Having validated the use of cryo-FESEM to accurately measure in vivo wall thickness, this approach was then used to establish the thickness of cell walls at all other stages of development. In light-grown embryos (stage I), OE walls were 264±13 nm in thickness, IE walls 147±7 nm, and OC, IC, and EN walls 138±6, 121±6, and 96±5 nm, respectively, and wall thicknesses showed little change following seedling emergence at stage IIa (Fig. 3A). However, at 50% of final hypocotyl length (stage III), OE walls had thickened considerably by 300%, IE and OC walls by 40%, and IC and EN walls by between 10% and 20%. At final hypocotyl length (stage IV), inner wall thicknesses remained largely unchanged, but OE walls had thinned to about half that at stage III.
Imbibing seeds in the presence of GA had no effect on wall thickness in embryonic (stage I) and emerging (stage IIa) hypocotyls (Fig. 3B). OE walls had thickened slightly at stage IIb, and by half as much again at stage III (50% of final length), but the other walls were unchanged. At stage IV (final length) OE walls had thinned by 20% relative to stage III, whereas IE, IC, and EN walls had thickened slightly relative to stage III.
By contrast to light-grown hypocotyls, those grown in the dark had acquired considerably thickened cell walls by the onset of seedling emergence (stage IIa). After 36–48 h at 25 °C, OE walls showed a 5-fold increase in thickness from the embryo, stage I (Fig. 3C). Thickening of inner walls was less dramatic, with IE and EN walls doubling in thickness, and OC and IC increasing in thickness by 30%. However, further hypocotyl growth was accompanied by rapid thinning of the cell wall in all cell layers by stage IIb. OE walls were only slightly thicker than they were in the embryo by this stage of growth, whereas inner walls were only about two-thirds as thick. After stage IIb, OE walls maintained their thickness, but all other walls continued to thin, such that by stage IIc, IE, OC, IC, and EN walls were approximately half as thick as they were in the embryo (stage I). Wall thickness in each cell layer did not change by stage III. At the end of hypocotyl elongation (stage IV), OE wall thickness remained unchanged from the previous stage, whereas IE, OC, IC, and EN walls had become thicker, and were 90±4, 85±4, 76±3, and 64±3 nm, respectively. Unlike in light-grown seedlings, where walls at the end of hypocotyl growth were thicker than in the embryo, inner walls of dark-grown hypocotyls at stage IV were only about half as thick of those measured at stage I.
Wall volume increases differentially during hypocotyl growth
Wall volumes for each cell layer were calculated at different stages of hypocotyl growth. In hypocotyls grown in the light, wall volume approximately doubled between stage I and the time of seedling emergence (stage IIa) in the OE, IE, and EN, and had increased by 50% as much in cortical cells (Fig. 4A). At stage III (50% of final length), the increase was >20-fold in OE walls and 7- to 10-fold in other walls. At final hypocotyl length (stage IV), OE and EN wall volume had increased 30-fold from the embryo (stage I), and IE, OC, and IC by 15- to 20-fold. Thus, around 50% of the total volume of primary wall was present in the epidermis in Arabidopsis embryos, increasing to 55% at stage IIa, and 65% at stage III (the latter due to considerable thickening of OE walls; Fig. 3A), and decreasing to 55% at stage IV due to thinning of the OE walls.
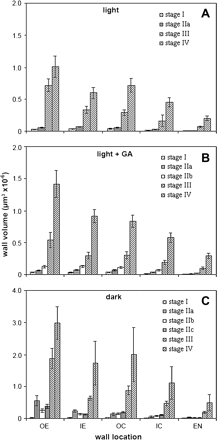
Cell wall volumes of hypocotyls at the developmental stages described in Fig. 1 (A, light-; B, light+GA-; C, dark-grown hypocotyls), calculated as described in Materials and methods. Mean volumes are given ±SE. Volumes of wall in outer epidermis (OE), inner epidermis (IE), outer cortex (OC), inner cortex (IC), and endodermis (EN) were measured.
GA had no effect on wall volume in the different cell layers of the embryo (Fig. 4B). At stage IIa, wall volume increased by 1.5- to 2-fold in each layer, and by around 3- to 4-fold by stage IIb of seedling emergence. At stage III, wall volume had increased 14-fold in OE walls, and 8- to 10-fold in other walls. GA did not affect total wall volume at this stage of development in light-grown hypocotyls (Table 2). However, at final hypocotyl length (stage IV), OE and EN wall volume had increased >40-fold from the embryo (stage I), and IE, OC, and IC by 20- to 30-fold. Thus, between stage III and stage IV, approximately one-third more wall material is laid down than when grown without GA. The total volume of primary wall that was present in the epidermis at stage IIa was similar to that in the embryo at 50%. This increased to 55% at stage IIb, and 60% at stages III and IV.
In seedlings grown in continuous dark for 48 h, stage IIa hypocotyl OE wall volume increased 17-fold from the embryo stage, whereas IE and EN volumes were 6-fold greater and cortical walls had increased 3-fold in volume (Fig. 4C). Although OE walls were five times thicker by this stage of development (Fig. 3C), there was a simultaneous increase in hypocotyl volume (Table 1), accounting for the dramatic increase in wall volume, and similarly for inner walls. However, by stage IIb, when walls in all layers had thinned dramatically (Fig. 3C), half of this volume had been removed in epidermal and endodermal cells, whereas cortical wall volume was unchanged. By stage IIc, volumes increased by 50% in OE and IC, around 20% in OC and EN, and were unchanged in IE cells, compared with stage IIb. At stage III, wall volume had increased >50-fold in OE walls, and >20-fold in inner walls, compared with the embryo (stage I). At final length, OE walls had increased 90-fold in volume relative to the embryo, and inner walls between 40- and 65-fold. More than 75% of total primary wall volume was present in the epidermis at stage IIa compared with 50% in the embryo. By stage IIb this proportion had decreased to 60%, and remained more or less constant at subsequent stages of hypocotyl growth.
The overall increase in hypocotyl primary wall volume, from the embryo stage to final length, was 20-, 30-, and 60-fold in light-, light+GA-, and dark-grown seedlings, respectively. Plotting wall volume against hypocotyl volume (Fig. 5) shows that, following the initial thickening and thinning of the wall, the percentage of hypocotyl volume accounted for by wall material in dark-grown hypocotyls (1.2%) is less than half that of light-grown hypocotyls (2.7%), regardless of whether GA was present or not.

Discussion
Dynamic changes in cell wall thickness occur during hypocotyl growth
As the cells of a plant proliferate and grow, new cell wall is made and deposited. At the level of the whole plant, these processes are usually intimately connected. The amount of wall deposited by any particular cell is a balance between structural and mechanical demands, and the carbon resources available to it. In the present study, it has been shown that wall thickness during hypocotyl elongation is extremely complex and dynamic, is dependent on growth conditions, and is under tight developmental control. Hypocotyl cell walls display phases of either becoming thicker, maintaining their thickness, or getting thinner, indicating that rates of wall deposition and growth are not invariably coupled. The present findings are consistent with previous reports in other organs, where walls can become thinner, thicker, or remain unchanged during cell expansion (Ray, 1967; Sargent et al., 1974; Meinert and Delmer, 1977; Schnepf and Deichgräber, 1979; Phillips and Kende, 1980; Kutschera, 1990; Fujino and Itoh, 1998; Refregier et al., 2004). However, as far as is known, this is the first report of all three scenarios occurring in the same system and in different cell types during growth.
GA promotes hypocotyl growth in two phases in the light
In the light in the absence of exogenous GA, wall thickness is maintained during seedling emergence, but by stage III walls increase in thickness, especially in OE walls. By stage IV, OE walls become thinner whereas inner wall thickness is largely unchanged. A similar pattern occurs in GA-treated seedlings; however, at stage III less thickening occurs. Although hypocotyl length and volume is increased, GA has no effect on the amount of wall deposited by this stage of development. The increase in organ size is thus achieved by stretching out the existing wall, combined with a reduction in hypocotyl diameter. Both of these factors contribute substantially to the GA-mediated increase in final hypocotyl size; however, additional wall material (∼30% more than occurs with no GA) is deposited to sustain the extra growth that occurs between stage III and stage IV hypocotyls. OE walls thin slightly and inner walls remain unchanged or become marginally thicker during the second half of hypocotyl growth. Thus, GA promotes cell elongation in two phases, one that is independent of additional wall deposition, and a second phase that requires higher rates of wall deposition. The first phase may be an example of a GA-mediated change in the properties of the cell wall being responsible for the increase in wall extension, as shown in cucumber hypocotyls (Taylor and Cosgrove, 1989). Other plant growth factors, such as IAA, have been shown to promote organ elongation and cell wall synthesis at the same time (Ray, 1962; Kutschera and Briggs, 1987). Therefore, wall synthesis and wall extensibility may be regulated differently by different plant growth factors.
Hypocotyls make thick cell walls in the absence of light but are rapidly thinned during the early stages of growth and are subsequently maintained
The most dramatic changes in hypocotyl wall thicknesses were observed when seedlings were grown in continuous darkness. At the onset of seedling emergence, considerable thickening of the cell wall occurs in all cell layers, in particular the OE wall. This response must involve high rates of wall biosynthesis and deposition from the embryo stage to the point of emergence. Walls then undergo dramatic thinning, such that inner walls are thinner than they were in the embryo and the OE wall only slightly thicker by the time hypocotyls are 1 mm in length. OE wall thickness remains fairly constant for the remainder of the growth period, whereas inner walls reach their thinnest in stages IIc and III, but then get thicker as hypocotyl growth ceases. The dramatic thinning observed between stages IIa and IIb (Fig. 3C) must involve extensive polymer disassembly and, since net wall volume decreases over this period of development, mobilization of wall polysaccharides must be occurring. This suggests that some of the wall material deposited earlier is then remobilized for later reuse in wall biosynthesis as proposed previously in pea epicotyls and maize coleoptiles (Gilkes and Hall, 1977; Darvill et al., 1978). The thick cell wall that is laid down and then removed may be part of the skotomorphogenic pathway that first senses carbon fixation-limiting conditions, leading to bulking of the cell wall with polysaccharides to fuel the onset of further cell expansion and growth. In the soil this may be an important factor in the cotyledon's search for light and a critical period for efficient resource allocation. Indeed, dark-grown hypocotyls achieve a higher final volume, but they manage to reach any particular volume using less than half the amount of wall material than is used in a corresponding light-grown organ (Fig. 5).
Thinning of the OE wall of Arabidopsis hypocotyls has been noted during the early stages of cell elongation in the dark (Refregier et al., 2004). Once cells enter the rapid elongation phase, they become insensitive to the cellulose synthesis inhibitor isoxaben, implying that cellulose is not absolutely required for sustained cell expansion (Refregier et al., 2004). The present results show that, after the initial thickening and thinning of the cell wall, dark-grown hypocotyls maintain a minimum wall thickness and total wall volume increases proportionally with hypocotyl volume. This may be expected, since prolonged increases in cell volume must necessitate the deposition of new cell wall polysaccharides, otherwise the wall would thin to the point of failure (Richmond et al., 1980). Taken together, these data suggest either that the ratio of cellulose to other wall polymers may change during cell elongation or that elongation in the presence of isoxaben involves more wall thinning.
Light is a potent inhibitor of hypocotyl growth (Sidler et al., 1998), mediated by phytochrome receptors that transmit signals to downstream regulatory targets (Quail et al., 1995) that include at least one cellulose synthase (Desnos et al., 1996; Fagard et al., 2000). In sunflower, transfer of dark-grown hypocotyls to white light results in a dramatic inhibition of growth with no net change in the amount and composition of the cell wall over a 24 h period (Kutschera, 1990). Over the same period, walls of light-exposed hypocotyls become twice as thick and wall extensibility reduces by half, suggesting that light regulates growth via the mechanical properties of the cell wall and not by the biosynthetic machinery alone. Thus, in Arabidopsis hypocotyls, the considerable increase in cell elongation rates induced by darkness may not only require increased deposition of wall material, but also increased wall extensibility.
The outer epidermis always has the thickest wall in Arabidopsis hypocotyls
In all growth conditions and at all stages of growth, the outer epidermal wall was always the thickest, sometimes containing up to half of the total wall material in the hypocotyl. Indeed, this wall can be between two and ten times thicker than inner walls, depending upon growth conditions and developmental stage. Tensile forces within the wall increase steeply as walls become thinner (Carpita, 1985). For hypocotyls and similar cylindrical structures (e.g. epicotyls, coleoptiles) such stresses are concentrated at the outer epidermal wall. For split organs, the inner tissues of such structures rapidly extend in water, whereas the outer layer contracts. This indicates that the inner walls are under compressive forces, imposed by the outer walls experiencing longitudinal tension, and that the outermost wall limits elongation of the intact organ (Kutschera et al., 1987; Kutschera, 1991, 1992). This outermost epidermal wall in cylindrical organs has been described as an ‘organ wall’, determining the rate of organ elongation, with the inner tissues providing the driving force for growth (Kutschera, 1992). Indeed, recent studies have shown that epidermal-specific expression of the brassinosteroid receptor or a brassinosteroid biosynthetic enzyme in null mutants is sufficient to rescue their dwarf phenotypes in Arabidopsis (Savaldi-Goldstein et al., 2007). This could explain why the outer epidermal wall is always the thickest in Arabidopsis hypocotyls.
A minimum wall thickness exists in Arabidopsis hypocotyls
The inner walls of dark-grown hypocotyls never appear to drop below a minimum of 50–60 nm. This minimum could represent a physical limit for the thickness of a plant cell wall. Given that cellulose microfibrils range from 5 nm to 10 nm in width (McCann et al., 1990), and are usually spaced about 30 nm apart, such walls would be able to accommodate only around two or three microfibrillar lamellae at the most. This would place great strain on the network, both from cell wall stresses generated by internal turgor and externally by compression from adjacent cells. Linear 1D stretching experiments showed that pectin has load-bearing properties within the cell wall that are independent of the cellulose and hemicellulose network (Kacurakova et al., 2002). In addition, Ryden et al. (2003) showed that rhamnogalacturonan II–borate complexes in pectin were important for the tensile strength of Arabidopsis hypocotyls. It is therefore likely that non-cellulosic components of the wall, in particular the pectin network, contribute to wall integrity, especially in these very thin walls.
The Arabidopsis hypocotyl system, coupled with FESEM and freeze-fracture, provides a sound baseline for future analyses of mutant or transgenic lines affected in cell elongation. Moreover, the discovery of the specific developmental window in which a thick cell wall is laid down during darkness, will facilitate the identification of transcripts and proteins involved in both sensing and wall synthesis/deposition as part of the early skotomorphogenic response. The present results on the relative timings of wall deposition and wall thinning have important implications for those who use the hypocotyl system. In particular, they should inform studies on the carbon allocation strategies used in early seedling development and should provide a baseline for those looking for key stages of wall biogenesis.
PD was funded by a Biotechnology and Biological Sciences Research Council UK (BBSRC) studentship. KF and KR were funded by BBSRC. MCM was funded by a Royal Society University Research Fellowship and US Department of Energy grant DE-FG02-03ER15445. PD conducted most of the experiments and wrote drafts of the manuscript. KF performed and assisted with some of the cryo-FESEM and gave technical advice. MCM helped supervise the project. PD, MCM, and KR co-wrote the manuscript. KR oversaw the project in his laboratory and is the guarantor of the work. We also acknowledge Alison Smith and Ulrike Behrendt for critical reading of the manuscript.
References
Author notes
Present address: Department of Biological Sciences, Purdue University, West Lafayette, IN 47907, USA.

Comments