


Abstract
To quantify the diffusion constant of small molecules in the plant cell wall, fluorescence from carboxyfluorescein (CF) in the intact roots of Arabidopsis thaliana was recorded. Roots were immersed in a solution of the fluorescent dye and viewed through a confocal fluorescence microscope. These roots are sufficiently transparent that much of the apoplast can be imaged. The diffusion coefficient, Dcw, of CF in the cell wall was probed using two protocols: fluorescence recovery after photobleaching and fluorescence loss following perfusion with dye-free solution. Diffusion coefficients were obtained from the kinetics of the fluorescent transients and modelling apoplast geometry. Apoplastic diffusion constants varied spatially in the root. In the elongation zone and mature cortex, Dcw=(3.2±1.4)×10−11 m2 s−1, whereas in mature epidermis, Dcw=(2.5±0.7)×10−12 m2 s−1, at least an order of magnitude lower. Relative to the diffusion coefficient of CF in water, these represent reductions by approximately 1/15 and 1/195, respectively. The low value for mature epidermis is correlated with a suberin-like permeability barrier that was detected with either autofluorescence or berberine staining. This study provides a quantitative estimate of the permeability of plant cell walls to small organic acids—a class of compounds that includes auxin and other plant hormones. These measurements constrain models of solute transport, and are important for quantitative models of hormone signalling during plant growth and development.
Introduction
Plant growth and development are pervasively influenced by the permeability of the cell wall to ions and small organic molecules. The latter include simple sugars, amino acids, and hormones. While long-distance transport is handled effectively by the vascular tissues of the plant, namely the phloem and xylem, short-distance transport is often mediated in part by diffusion through the cell walls and through the fluid-filled spaces located between cells, a region collectively denoted as the apoplast. The apoplast is a complex, hierarchical material, and transport through it is difficult to predict and little studied quantitatively.
A molecule of particular interest is a major hormone in plants, auxin (indole acetic acid, IAA). Auxin transport is transcellular, that is to say it moves between cells by a process of export across one cell membrane, diffusion through the apoplast, and subsequent import across an adjacent cell membrane. Recently, auxin transport has been the subject of several computational models (Kramer, 2004; Feugier et al., 2005; Swarup et al., 2005; de Reuille et al., 2006; Heisler and Jonsson, 2006; Jonsson et al., 2006; Smith et al., 2006). Most of these models ignore the apoplastic transport step and assume that auxin secreted by one cell immediately enters the adjacent cell (Kramer, 2007). However, a few models have included the apoplast as an explicit compartment and allowed for the possibility that auxin can diffuse relatively large distances (>10 μm) before re-import into a cell. Some model results suggest that diffusion within the apoplast has a notable effect on the distribution of auxin within an organ. Since the magnitude of this effect depends on the permeability of the apoplast to IAA, a quantitative estimate of the diffusion coefficient within the cell wall, Dcw, is needed to refine these models (Kramer, 2006).
To our knowledge, the diffusion coefficient of auxin has not been measured in the plant apoplast; nevertheless, apoplastic diffusion coefficients have been published for some other small, organic molecules (Richter and Ehwald, 1983; Canny, 1990; Canny and Huang, 1994; Bayliss et al., 1996). These report an enormous range of diffusion coefficients, from D/7 to D/1000, where D is the value in water. Because values at the lower end of the range have been ascribed to the presence of a hydrophobic barrier, such as a Casparian strip, that tends to block the diffusion of solutes (Wilson and Peterson, 1983; Schreiber et al., 1999; Hose et al., 2001), the consensus value in the absence of such barriers is of the order of D/10 (Swarup et al., 2005; Heisler and Jonsson, 2006; Kramer, 2006). That Dcw is less than D is attributable to the steric hindrance posed by cell wall constituents.
Beside the large range of values for apoplastic diffusion, another difficulty for assigning a value to Dcw for IAA is that, among published values for Dcw, there are apparently no data for a carboxylic acid. This is important because IAA is a carboxylic acid, as are abscisic acid, jasmonic acid, and the large family of gibberellins. Within the apoplast, a considerable amount of IAA will be ionized and therefore potentially able to interact with pectins. These polymers have many ionized carboxyl groups that bind calcium, which often cross-links pairs of carboxylic acids (Fry, 1986). Therefore, ionized, acidic ligands diffusing through this pectin network may be slowed by interactions with the fixed calcium ions. Recent results of Proseus and Boyer (2005) hint at such an effect. They injected a solution of fluorescein isothiocyanate (FITC, molecular weight 389 Da, one carboxyl group) into cylindrical Chara corallina cell wall ghosts, which are pectin rich. Movement of FITC across the wall from the lumen to the exterior bathing solution was consistent with Dcw being even less than D/1000.
In this study, the diffusion coefficient of a carboxylic acid was measured in intact Arabidopsis roots. The fluorescent dye carboxyfluorescein (CF) was used, CF is an organic molecule chemically similar to auxin and other weak acids. It contains two carboxyl groups, one or both of which are expected to be ionized in the apoplast (see Materials and methods). The dye is taken up by living cells slowly, so that cytoplasmic CF was negligible in the experiments described here. Different perfusion and photobleaching protocols were applied to intact roots immersed in CF solution, and a diffusion coefficient was determined for each case.
Materials and methods
Seeds of Arabidopsis thaliana L Heynh (Columbia accession) were grown on a modified Hoagland's solution (growth medium) under constant light and temperature, as described by Bannigan et al. (2006). Seven days after plating, individual seedlings were transferred to well slides and the portion of the root approximately 5–15 mm from the tip was placed under a coverslip with about 10 μl of growth medium. To ensure hydration, the parts of the seedling not under the coverslip were covered with agar growth medium wetted with a few microlitres of growth medium. The well slide was kept covered to decrease evaporation during imaging.
The fluorochrome, 5(6)-carboxyfluorescein (CF) was prepared as a 5 mM stock solution in 10 mM KOH to improve solubility, and stored at –20 °C. An ∼10 μl drop of the CF stock solution was applied to the root along one edge of the coverslip, then excess fluid was blotted from the opposite edge, perfusing CF into the mounting medium. In some experiments, the same perfusion process was subsequently repeated with dye-free growth medium to displace the CF Solution.
To stain for suberin lamellae, berberine was used, modifying the procedure of Brundrett et al. (1988). Briefly, intact seedlings were suspended in a solution of 0.5% (w/v) berberine hydrochloride for 10 min, rinsed in distilled water (3×5 min), incubated briefly in 4% (w/v) n-propylgallate and 0.1% (w/v) FeCl3 to suppress photobleaching, and then mounted in this solution as described above.
Roots were imaged using a Zeiss LSM 510 Meta confocal microscope with 488 nm excitation. Reconstructions from z-stacks and other image processing were done with ImageJ 1.36b (NIH, http://rsb.info.nih.gov/ij/). Curve fits were done using Kaleidagraph 3.6.4 (Synergy Software, Reading, PA, USA).
The diffusion of CF may depend on its charge. CF has three ionizable groups—a hydroxyl group attached to a tricyclic xanthene and two carboxyl groups attached to an isolated benzene ring (Vallotton and Vogel, 2000). Each of these groups is characterized by its acid–base dissociation constant (pKa). The commonly cited pKa of CF is for the hydroxyl group (pKa ∼6.5) (Bramhall et al., 1987; Vallotton and Vogel, 2000). There are no known published values for the pKas of the carboxyl groups. However, upper bounds can be placed on these pKas using the octanol/water partition data of CF provided by Bramhall et al. (1987). Curve fits to the partition coefficient as a function of pH give pKa1 <3.8 and pKa2 <4.3. The pH of the Hoagland's medium used in the experiments is weakly buffered near 4.5, the pH of the CF solution used for perfusion is near 5.0, and the apoplastic pH of Arabidopsis roots in the region under investigation is generally maintained between 4.8 and 5.5 (Fasano et al., 2001). Thus, the CF in the apoplast is expected to be predominantly in charged forms, with <2% in the neutral form.
To calculate values for Dcw, three anatomical parameters are used: the radial length of an epidermal cell wall, L, the cross-sectional area of an apoplastic space, A, and the cell wall thickness, h. A and L were measured in transverse sections from software reconstructions of z-stacks. L fell in the range 8–11 μm and A in the range 4–10 μm2. For purposes of error propagation, these are taken as the 95% confidence intervals (4σ), so L=9.5±0.8 μm and A=7.0±1.5 μm2. The cell wall thickness, h is estimated as 200±30 nm, based on Fig. 9B in Andème-Onzighi et al. (2002), where the uncertainty reflects the changes in wall thickness that can result during fixation and sectioning.
Results
Diffusion of CF in water
To determine the aqueous diffusion coefficient of CF, a small volume of the aqueous CF solution was placed between two coverslips, forming a thin film between 20 μm and 100 μm thick. Under the confocal microscope, a circular spot with a radius of ∼200 μm and an optical thickness greater than the fluid thickness (to avoid measurement artefacts due to diffusion in the z-direction) was bleached. Then the half-time for fluorescence recovery, t1/2, was determined as the time needed for the intensity at the centre of the disc to reach 50% of the asymptotic recovery value. The exact solution to the diffusion equation, assuming an initial bleached disc of radius R, gives D=R2/[4ln(2)t1/2]=(0.36R2)/t1/2 (Crank, 1985). The aqueous diffusion coefficient for CF determined in this way was D=(4.87±0.22)×10−10 m2 s−1 (mean ±SE, n=4). This value falls in the expected range (Nitsche et al., 2004; Lide, 2006). In the remainder of the paper, D=4.87×10⁻¹⁰ m2 s−1 is used.
Apoplastic spaces in the root
Living roots were immersed in growth medium containing CF, and fluorescence within the root was imaged by confocal fluorescence microscopy. The optical sectioning capability of confocal microscopy allows images to be obtained at appreciable depths within the Arabidopsis root (Fig. 1). In regions of the root outside of the growth zone (henceforth, mature zone), there were prominent spaces at the three-cell junctions between the epidermis and the cortex, and at many of the three-cell junctions between the cortex and endodermis. These spaces were first apparent near the proximal end of the elongation zone, and are clearly visible as longitudinal, CF-bright columns. Using transverse sections reconstructed from confocal z-stacks (Fig. 1C), it was estimated that the apoplastic spaces have a cross-section area of 4–10 μm2 (see Materials and methods).
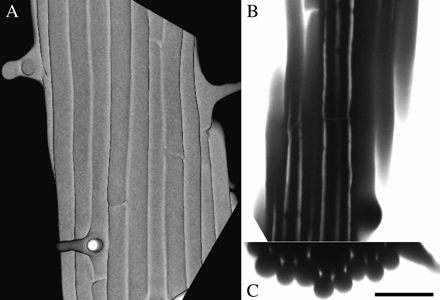
Three views of the same root segment, immersed in CF solution, and imaged on the confocal microscope. (A) Reconstructed images of the root surface, showing epidermal cell files and several root hairs. (B) Optical section through the root tangential to the surface, showing several longitudinal apoplastic spaces filled with CF. (C) Transverse optical section, reconstructed from a z-series, showing epidermal and cortical cell layers and the CF-filled spaces at three-cell junctions. Scale bar=50 μm.
The fluid in each apoplastic space typically appeared to be continuous. Bleaching the CF in a small region within one of these apoplastic spaces usually caused a rapid (<5 s) decrease in brightness over the entire, imaged length (at least 100 μm) of the space. However, occasionally there was a break in the continuity of the apoplastic space, indicated by a constriction of the fluorescent signal, limiting the movement of bleached CF. Away from these obstructions, the diffusion coefficient of CF in fluid-filled spaces was estimated by measuring the rate of broadening of a bleached profile with time (data not shown). Based on this, the diffusion coefficient of CF within the apoplastic spaces was comparable with, or somewhat smaller than, the aqueous value, although the data have limited accuracy because of the rapidity of the diffusion. Because of the speed of diffusion as well as the intensity of the signal, these spaces were considered to be primarily filled with water. They probably also contain some diffuse pectin, which may have contributed to the smaller diffusion coefficient measured.
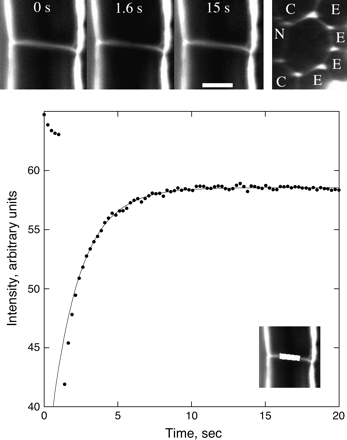
Bleaching one apoplastic space
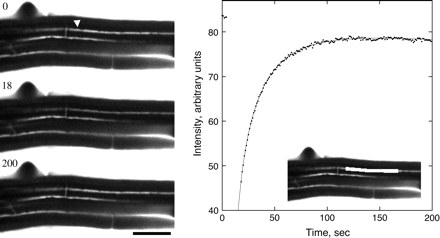
Fluorescence recovery after photobleaching an apoplastic space. Left: three stills from the sequence, showing the root initially, immediately after the bleach, and after recovery. Time in seconds is given at the upper left. The arrowhead indicates the apoplastic space to be bleached. Note that the spaces continue across the entire frame, but appear to end where they pass out of the focal plane. Scale bar=50 μm. Right: mean intensity versus time of the bleached space. Symbols are the measurements; the solid line shows the fit to the data using Equation 1. Bleach interval was from 4 s to 18 s. Inset: the white box shows the region whose intensity was measured.
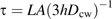
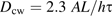
To obtain a diffusion coefficient from the time constant, τ, a solution for this case was derived approximately ( Appendix 1, Equation 1.2), giving D=LA(3hτ)−1, where A is the cross-sectional area of the space, L is the length of the walls separating the space from the adjacent reservoirs, and h is the cell wall thickness. Substituting A=7.0±1.5 μm2, L=9.5±0.8 μm, and h=200±30 nm (see Materials and methods), the diffusion coefficient is Dcw=(2.5±0.7)×10−12 m2 s−1 (mean ±SD). This amounts to a reduction of the aqueous diffusion coefficient by about 1/190.
Perfusion-based recovery
As an alternative to photobleaching, a dye-saturated root was perfused with dye-free solution and the loss of fluorescence intensity was followed as the CF diffused out of the apoplast (Fig. 3). The apoplastic spaces contain a large volume of CF and hence contribute appreciably to the kinetics of fluorescence decay. Because these spaces are small or absent in the elongation zone, the following treatment considers the elongation and mature zones separately.
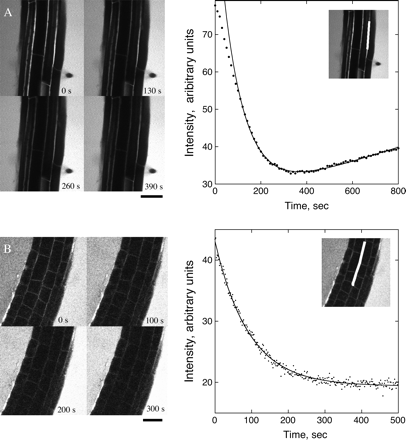
Fluorescence decay following perfusion with dye-free media. (A) Mature zone. Perfusion began approximately 45 s before recording. Left: stills showing the decrease in brightness in the apoplastic spaces. Right: mean intensity versus time of the region shown in the inset (white box is the region measured). Symbols are the measurements; the solid line shows the fit to the data using Equation 2. Intensity during the first ∼100 s deviates from mono-exponential behaviour. (B) Elongation zone. Perfusion began approximately 45 s before recording. Details as for (A). Intensity of the surrounding fluid increases gradually due to diffusion of CF out of the root. Scale bar=50 μm.
Mature zone
In the mature zone, the total cross-sectional area of the cell walls is small compared with the area occupied by apoplastic spaces. In addition, only a small portion of the cell wall constitutes accessible volume. Thus, the majority of CF will be found in the spaces. For modelling the diffusive loss of fluorescence from the mature zone, only apoplastic spaces were considered. The geometry of the apoplastic reservoir of CF was approximated as shown in Appendix 2, Fig. 2.1. Each trichoblast (root hair-forming epidermal cell) is located at the junction of two cortical cells and separated by two atrichoblasts (non-root hair-forming epidermal cells). The length of all walls is L=9.5±0.8 μm, as above.

Elongation zone
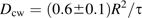
In the elongation zone, apoplastic spaces are not conspicuous in the confocal images and presumably have not opened yet. As a result, the simplified geometry depicted in Fig. 2.1 is inapplicable and a mathematical or computer model of the entire root apoplast is needed. An accurate, geometric model is beyond the scope of this paper, but an approximate solution to the perfusion problem is presented in Appendix 3. The wall intensity will decay exponentially, as in the previous section, so the intensity data are again fitted to Equation 2. The relationship between the time constant and the apoplastic diffusion coefficient is τ=(0.6±0.1) R2/Dcw, where R is the radius of the root (Equation 3.1). A mean decay time of τ=71±11 s is found (n=3 roots, mean ±SE; Fig. 3B). Estimating the radius of the root from confocal images to be 60 μm gave a value of Dcw=(3.0±0.7)×10−11 m2 s−1 (mean ±SD) for the elongation zone apoplast. This amounts to a reduction of the aqueous diffusion coefficient by approximately 1/16.
Bleaching transverse walls in the mature cortex
Both previously discussed measures of the diffusion coefficient in the mature zone include epidermal cell walls. As an independent check, the diffusion coefficient was measured in several transverse walls between pairs of cortical cells (Fig. 4). Viewed in a single section, these walls are seen edge-on. Reconstructions based on z-stacks show that the transverse walls are polygonal, with the longest diameter being about 25 μm. CF-filled apoplastic spaces generally pass through all of the (typically) seven corners, though there was some tendency for the spaces to be constricted near the transverse wall.
Fluorescence recovery after photobleaching a transverse wall between cortical cells in the mature zone. Top left: three stills from the sequence, showing the root initially, immediately after the bleach, and after recovery. Scale bar=10 μm. Top right: the same wall as seen face-on in a transverse optical section. Adjacent cells belong to the epidermis (E), cortex (C), and endodermis (N). Note that the two apoplastic spaces adjacent to the endodermis appear narrowed or blocked. Bottom: mean intensity versus time of the region shown in the inset. Symbols are the measurements; the solid line shows the fit to the data using Equation 3. Bleach interval was from 1 s to 1.5 s. Intensity during the first ∼2.5 s deviates from mono-exponential behaviour.
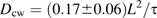
To relate the measured time constant, τ, to the diffusion coefficient Dcw, a computer model was made of a bleach conducted on a thin hexagonal wall of uniform thickness (see Appendix 4). Boundary conditions were chosen to mimic CF-filled apoplastic spaces passing through either four or six corners, allowing for the possibility that two spaces were completely blocked at the wall. Spaces of varying diameter, from 0.5 μm to 3.0 μm, were tested, to obtain a range of likely time constants. Simulated bleach results were similar to real bleaches: the brightness at the centre of the wall showed a short-time behaviour that depended on the bleach geometry, but recovery at longer times was strictly mono-exponential. The relationship between τ and Dcw depends on the size and location of the modelled apoplastic spaces, but plausible versions fell in the range τ=(0.17±0.06) L2/Dcw, where L is the long diameter of the hexagon (Equation 4.1). This gave Dcw=(3.4±1.2)×10−11 m2 s−1, which is approximately 1/14 of the aqueous value.
Epidermal permeability barrier
The values for the apoplastic diffusion coefficient, Dcw, measured here for CF are summarized in Table 1. All values are smaller than the aqueous value by at least one order of magnitude. In the mature zone, evidence was found for two distinct coefficients. Transverse walls in the mature zone cortex have a diffusion coefficient comparable with that of the longitudinal epidermal walls in the elongation zone; on the other hand, both whole-root perfusions and bleaches of a single, mature zone apoplastic space give a much lower value for diffusion in longitudinal, epidermal walls. These results can be reconciled if the epidermal cell walls have a specifically lowered diffusion coefficient. If so, then the walls of the epidermis would be the primary barrier to the diffusion of CF into and out of the root.
Summary of measured diffusion coefficients for CF within the cell walls of living Arabidopsis roots
| Protocol | Figure | Tissue | Dcw×1012 m2 s−1 | Fold reduction, D/Dcw |
| Bleach | 2 | Mature epidermis | 2.5±0.7a | 195 |
| Perfusion | 3A | Mature epidermis | 7.5±2.0b | 65 |
| Perfusion | 3B | Elongation-zone | 30±7c | 16 |
| Bleach | 4 | Mature cortex | 34±12c | 14 |
| Protocol | Figure | Tissue | Dcw×1012 m2 s−1 | Fold reduction, D/Dcw |
| Bleach | 2 | Mature epidermis | 2.5±0.7a | 195 |
| Perfusion | 3A | Mature epidermis | 7.5±2.0b | 65 |
| Perfusion | 3B | Elongation-zone | 30±7c | 16 |
| Bleach | 4 | Mature cortex | 34±12c | 14 |
Dcw data show the mean ±SD. Superscripts (a, b, and c) distinguish means whose equivalence is rejected by t-test (P <0.05). The last column presents the fold reduction of Dcw compared with D, the aqueous value.
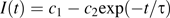
Permeability barriers have been reported previously in the root epidermis, due to hydrophobic molecules chemically similar to those of the Casparian strip (Wilson and Peterson, 1983). To test whether Arabidopsis has a similar barrier, a berberine stain commonly used to detect suberin (Brundrett et al., 1988) was applied. As expected, berberine labelled the Casparian strip and suberin lamella of the endodermis, and in addition, cell walls in the mature zone epidermis (Fig. 5A). A second test for suberin-like compounds is autofluorescence under blue or ultraviolet light (Wilson and Peterson, 1983). Using blue (488 nm) excitation, the Casparian strip and suberin lamella of the endodermis of Arabidopsis were autofluorescent, while the xylem vessels were not; additionally, the outer walls of mature zone epidermis were autofluorescent (Fig. 5B). Thus, it appears that epidermal cell walls contain a permeability barrier with constituents chemically similar to suberin.
Confocal micrographs indicating hydrophobic cell wall modifications in the mature zone. (A) Berberine staining. Note the stained epidermis, and root hair (arrow). (B) Autofluorescence. The arrow indicates the outer cell wall of the epidermis. Arrowheads indicate the presumptive Casparian strip. En indicates endodermis. Scale bar=50 μm.
Discussion
As far as is known, the structure and composition of the apoplast of Arabidopsis is typical of dicots (Somerville et al., 2004). Advantage was taken of the fact that Arabidopsis roots are relatively small and transparent. This allows a confocal microscope to acquire optical sections dozens of microns below the surface of an intact root.
A variety of perfusion and bleaching protocols were applied to probe the diffusion of CF, a charged fluorescent dye, in the apoplast. Taken together, the results show two distinct regimes for diffusion of an organic acid in the Arabidopsis root apoplast. In the mature cortex and elongation zone epidermis and cortex, diffusion within the apoplast is of the order of 10-fold slower than in water; whereas, in mature epidermis, diffusion within the apoplast is of the order of 100-fold slower than in water (Table 1). For the mature epidermis, the two estimates for the apoplastic diffusion coefficient are not statistically equivalent, as determined by a t test (Table 1). This probably indicates that the assumptions used to derive Dcw from fluorescence measurements are simplistic; for example, it may not be accurate to assume that there are just two permeabilities, one for epidermal cell walls and one for cortical walls. In addition, the larger coefficient measured by the perfusion method may be due to fluid-filled anastomoses connecting the apoplastic spaces with the exterior solution. Regardless of this discrepancy, it is clear that the epidermal cell walls are less permeable than the cortical walls by an order of magnitude. The best measure for the diffusion coefficient of CF in mature epidermis is considered to be the bleach of the apoplastic space, namely Dcw=(2.5±0.7)×10−12 m2 s−1, and the best measure for the diffusion coefficient of CF in unmodified apoplast is considered to be the mean of the elongation zone and cortex results, namely Dcw=(3.2±1.4)×10−11 m2 s−1. Expressed as a fraction of the aqueous diffusion coefficient, these are 1/195 and 1/15, respectively.
The reduction in permeability measured in the mature epidermal apoplast is plausibly explained by the presence of hydrophobic molecules that limit diffusion (Fig. 5). An epidermal barrier has been reported previously (Schreiber et al., 1999; Hose et al., 2001). Indeed, Wilson and Peterson (1983) found evidence for wall modifications in the root epidermis of all 27 species they examined. The barrier typically contains suberin, although its composition varies among species, and it typically develops within a few centimetres of the root tip. A detailed study in onion (Allium cepa) roots indicated that the modification process starts within 1.5 cm of the root tip, with barrier compounds deposited first in the outermost tangential wall of the epidermis, followed later by deposition in the radial and inner tangential wall (Peterson et al., 1978).
Comparison of the diffusion coefficients reported in Table 1 with those reported previously for the apoplastic diffusion of organic molecules in roots is problematic. Earlier reports have usually been based on the movement of a tracer through an appreciable amount of tissue, with limited ability to distinguish between diffusion through apoplastic spaces, unmodified cell walls, and cell walls with varying degrees of permeability barrier.
Richter and Ehwald (1983) measured the flux of radiolabelled sucrose (molecular weight 342 Da) across discs of parenchyma 2.4 mm thick cut from sugar beet (Beta vulgaris) storage tissue. They estimated a value for Dcw between D/6 and D/9 [with the value for D taken from Lide (2006)]. However, this tissue contains enlarged apoplastic spaces at three-cell junctions (Marry et al., 2006), which are almost certainly filled with fluid rather than air in hydrated tissue. Considering that diffusion through the apoplast is at least an order of magnitude slower than that through water, even a thin film of fluid lining the apoplastic spaces could make a disproportionate contribution to the overall permeability. For example, in the hypothetical case of Dcw=D/10, an aqueous film 100 nm thick could carry the same flux as a wall 1 μm thick. A further complication is that sucrose is taken up actively by sugar beet cells and may have been translocated by cytoplasmic streaming. Thus, the diffusion coefficient in the cell walls of sugar beet parenchyma is probably less than D/9.
Canny and co-workers studied the penetration of the fluorescent dye, sulphorhodamine G (SG, a zwitterion with molecular weight 533 Da) in roots of several species. Their technique involved the application of SG to the external surface of fresh root segments. In live sections viewed under a coverslip, or in sections frozen and subsequently imaged, they observed the gradual penetration of a fluorescent front and assigned a value for the net apoplastic permeability based on an equivalent homogeneous tissue model (i.e. no distinction between cell walls, spaces, or cells). They found a range of values, depending on species and position within the root tip, ranging from D/18 to D/17 000 (Canny and Huang, 1994; Bayliss et al., 1996). They interpreted the lower values as reflecting the development of an epidermal permeability barrier although they did not test for its presence explicitly. Although crude, their results are reasonably consistent with those reported here: unmodified apoplast has a permeability approximately one order of magnitude smaller than the aqueous value, and a hydrophobic barrier can reduce this by at least another order of magnitude.
Finally, Aloni et al. (1998) used a protocol in which berberine (an organic cation with molecular weight 336 Da) reacts within the root with thiocyanate to produce a fluorescent precipitate. In sunflower (Helianthus annuus), they observed a front of precipitation, moving across the epidermis and advancing into the cortex. While they did not report a value for the diffusion coefficient, we estimate from their data a value of D/10 for both primary and lateral roots.
Consequently, the present results and others agree that Dcw is at least 10 times smaller than D. Why should diffusion in the apoplast be slower than in water? One reason is excluded volume: the volume occupied by the molecules that comprise the cell wall decreases the effective cross-sectional area available for diffusion (Grignon and Sentenac, 1991). The excluded volume may include some water molecules that are strongly bound to cell wall polymers, forming a hydration layer inaccessible to a diffusing solute (Dominguez and Heredia, 1999; Mercado et al., 2004). Another reason is steric hindrance: solvent pathways through the wall can be described as a network of pores, and some pores may be too narrow to pass these molecules (Carpita et al., 1979; Baron-Epel et al., 1988). Also, a pore that allows passage may have a tortuous geometry, which increases the path length of diffusing solute molecules (Grignon and Sentenac, 1991). A final reason is due to the large number of fixed negative charges in the cell wall, largely in the form of ionized carboxyl groups. These are expected to repel negatively charged solute molecules, reducing the effective pore diameter. It would be of interest to explore the contributions of these various factors by repeating the present experiments with fluorochromes of different shape, size, and charge.
In the Introduction, it was mentioned that this study was motivated by a desire to quantify the ability of auxin to diffuse through the apoplast. The previous estimate for cell wall permeability, Dcw ∼ D/10, was based on published reports using tracers without a carboxyl group, in not very well-defined protocols (reviewed above). The results here confirm that this value is reasonable for carboxylic acids, such as IAA, and refine the previous estimate downward to approximately D/15. However, the issue of apoplast permeability is complicated: the elongation zone apoplast is homogeneous as far as could be determined, but the mature apoplast has a complex geometry and large spatial variations in permeability.
This technique has not yet been applied to measure the permeability of the Casparian strip. The CF signal in the root endodermis was too faint to allow a localized bleach, like that applied in the cortex, and the perfusion protocol in the mature zone was dominated by the CF in the apoplastic spaces, all of which are exterior to the endodermis. The Arabidopsis roots in the present study did not develop an exodermis, which is to say there was no second Casparian strip in the layer of cells just beneath the epidermis (Hose et al., 2001). It may be possible to probe the Casparian strip with a refinement of the technique, for example with two-photon microscopy, which often allows imaging to greater depths. While the Casparian strip is widely regarded as being universally impermeable, there are some suggestions that the barrier may be permeable to some chemical species, including the protonated form of abscisic acid (Freundl et al., 1998; Hose et al., 2001; Ranathunge et al., 2005).
Apoplastic diffusion of small organic molecules is likely to be important throughout plant development and physiology. Specifically with respect to auxin, apoplastic diffusion constrains the efficiency of transcellular transport and is likely to be important in the regulation of many developmental events (Kramer, 2006). In the mature zone of the root, for example, auxin is a pivotal signal in root hair development. While the fate of epidermal cells to form hair or non-hair cells is determined in the meristem, auxin continues to be required for proper root hair development proximal to the elongation zone (Pitts et al., 1998; Schiefelbein, 2000; Lee and Cho, 2006). As another example, auxin from an emerging lateral root primordium functions as a signal to the cells of the outer root, initiating cell separation and facilitating lateral root emergence (Laskowski et al., 2006; Malcolm Bennett, personal communication). Quantitative models of these processes, among others, will need to incorporate the complexities of diffusion through the apoplast.
This work was supported by the US National Science Foundation, award IBN 0316876 to TIB. The confocal microscopy was accomplished at the Central Microscopy Facility at the University of Massachusetts, Amherst. We thank Alenka Lovy-Wheeler, Alex Bannigan, Dale Callaham, Peter Hepler, David Myers, and Abidur Rahman for invaluable advice and support, and Alex Cobb for a careful reading of the manuscript.
Appendix 1. Fluorescence recovery after photobleaching one apoplastic space
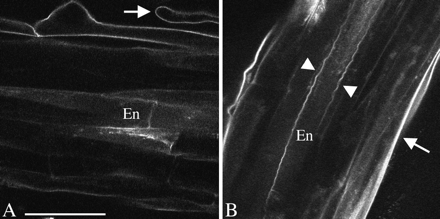
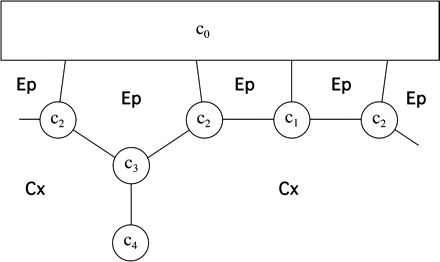
The simplified geometry used for this analysis is shown in Fig. 1.1. The majority of the apoplastic CF is located in the apoplastic spaces present at each three-cell junction between the cortex and epidermis. Each space has a cross-sectional area A and an effectively infinite extent parallel to the root axis. Cell walls that separate the spaces from each other and from the exterior fluid all have length L, thickness h, and a diffusion coefficient Dcw.
Sketch of the apoplastic geometry used in Appendix 1. The large rectangle at the top denotes the exterior fluid with dye concentration c0. Smaller circles are three adjacent apoplastic spaces, with the centre one bleached, having concentration c. Lines connecting fluid reservoirs are cell walls. Ep and Cx denote epidermis and cortex, respectively.
The following approximations were made for the bleach. A longitudinal length l of one apoplastic space is bleached for a time Δt, then the fluorescence is allowed to recover. In experiments, it was found that the dimming of the signal in apoplastic spaces adjacent to the bleach target was typically small (<20%), indicating that the longitudinal diffusion of CF within those spaces is adequate to keep the concentration of CF approximately time independent during the bleach. This reflects the fact that the diffusion coefficient in the wall, Dcw, is small compared with the diffusion coefficient within the fluid-filled spaces, D’ (D’ ∼ D; see Results). Diffusion in the fluid outside the root is also fast. Thus, as shown in Fig. 1.1, the concentration in the three compartments adjacent to the bleach target was taken to be equal and uniform.


Appendix 2. Time scale for dye loss in the mature zone due to perfusion
It is assumed that the majority of the apoplastic CF is located in the apoplastic spaces present at each three-cell junction between the cortex and epidermis, and between the cortex and endodermis. The geometric approximation, as shown in Fig. 2.1, is similar to that used in Appendix 1. Each compartment has a uniform concentration ci. Due to symmetry considerations, there are only four distinct concentrations.
Sketch of the apoplastic geometry used in Appendix 2. All symbols are as in Fig. 1.1.
Before time 0, the CF concentration is in diffusive equilibrium with an infinite reservoir outside the epidermis. At time 0, dye-free solution is assumed instantly to replace all exterior fluid, so c0=0 for all t ≥0. Confocal microscopy did not show a significant boundary layer in the exterior fluid. Any boundary layer is expected to be small because apoplastic CF diffuses outward along walls that are about 200 nm thick, but the effective width of the diffusive ‘channel’ broadens abruptly to the whole width of a cell (∼10 μm) at the root surface.

If the epidermal walls have a small diffusion coefficient, the perfusion time scale is dominated by the permeability of the epidermal walls and is relatively insensitive to the value for cortex Dcw.
Appendix 3. Time scale for dye loss in the elongation zone due to perfusion
An exact determination of Dcw would require an accurate map of the elongation zone apoplast and a model for diffusion within it. Barring this, the elongation zone geometry was approximated as follows. Consider a hypothetical longitudinal-radial cell wall that covers the full diameter of the cylindrical root. The wall has diffusion coefficient Dcw, uniform thickness h, width 2R (where R is the radius of the root), and effectively infinite extent parallel to the root axis. Before time 0, the CF concentration is in diffusive equilibrium with an infinite reservoir outside the epidermis. At time 0, dye-free solution is assumed instantly to replace all exterior fluid, so c0=0 for all t ≥0. The boundary layer can be ignored for reasons discussed in Appendix 2. The long-time solution for the concentration is c(r, t)=A cos(πr/2R) exp(–t/τ) where A is an arbitrary constant, and the time constant τ=(4/π2) R2/D=0.4053 R2/Dcw.
Appendix 4. Recovery in a cortical wall

Left: hexagonal simulation domain used in the program HexDiff. The concentration at each corner (black) is fixed to a constant value, due to CF in the apoplastic spaces. Right: CF concentration in the domain immediately following a simulated bleach. Black denotes the highest concentration. The laser passes vertically from the top to the bottom of the domain.

Comments