


Abstract
Rop/Rac GTPases are plant-specific signalling proteins with multiple roles, some of which have implications in plant development and in hormone signal transduction. Using expressed sequence tag (EST) and gene database analyses, members of the Rop family were characterized for the first time in a perennial species (Vitis vinifera). The grapevine genome was found to contain seven expressed VvRops. The phylogenetic analyses indicated that VvRops could be distributed into four groups, as described in the literature for model plants. Genetic mapping was successfully performed for five VvRops, which were localized on independent linkage groups. Conserved and divergent regions were identified on the protein sequences. The results of VvRop expression obtained by real-time quantitative reverse transcription-PCR analyses indicated that all the organs investigated displayed VvRop expression, however with different patterns. Whereas no total organ specificity for VvRop expression could be evidenced, VvRop9 displayed high expression in developing berries only. During berry development, the transcript profile was generally similar for all the VvRops, i.e. displaying a peak early in the herbaceous phase followed by a decline towards veraison and thereafter. Western blotting gave a similar expression profile for VvRop proteins. Response to growth regulators was generally specific to each VvRop. The potential involvement of specific VvRops in grapevine development is discussed.
Introduction
Rop (Rho-related GTPase from plants)/Rac are plant-specific small GTP-binding proteins of the Ras superfamily. Rops/Racs have been proposed to act as predominant switches to control the transmission of extracellular signals in plants (Zheng and Yang, 2000; Yang, 2002), integrating multiple incoming signals and co-ordinating cross-talk between diverse pathways. Studies have implicated Rop/Rac in many pathways important for development and environmental responses in plants. In particular, it has been shown that Rops/Racs are involved in processes such as seed germination and pollen tube growth, as well as in the development of embryos, root hairs, secondary cell walls, and vacuoles (Potikha et al., 1999; Li et al., 2001; Neil et al., 2002; Yang, 2002; Vernoud et al., 2003). Moreover, there is strong evidence that Rops/Racs also participate in regulating plant responses to several hormones such as abscisic acid (ABA), auxin, or brassinosteroids (Li et al., 2001; Tao et al., 2002, 2005; Zheng et al., 2002; Xin et al., 2005).
Several genes encoding Rop/Rac proteins have been isolated from a number of plant species such as Arabidopsis (Li et al., 1998), barley (Schultheiss et al., 2003), rapeseed (Chan and Pauls, 2007), cotton (Delmer et al., 1995; Kim and Triplett, 2004), maize (Hassanain et al., 2000), tobacco (Morel et al., 2004), and rice (Christensen et al., 2003). The Arabidopsis genome contains 11 Rop/Rac GTPases (Winge et al., 2000): AtRop1 (AtRac11), AtRop3 (AtRac1), and AtRop5 (AtRac6) GTPases are functionally redundant and involved in establishing cell polarity in growing pollen tubes (Kost et al., 1999; Li et al., 1999; Vernoud et al., 2003). AtRop2 (AtRac4), AtRop4 (AtRac5), and AtRop6 (AtRac3) GTPases are involved in root hair growth (Molendijk et al., 2001; Jones et al., 2002), and AtRop10 (AtRac8) in ABA signalling (Zheng et al., 2002).
In Vitis vinifera, berry development involves numerous biological processes, including cell division and enlargement, and primary and secondary metabolism changes (Coombe, 1973; Hrazdina et al., 1984; Robinson and Davis, 2000). Much progress has been made regarding the identification of changes at the molecular level occurring during grape berry ripening (Goes da Silva et al., 2005; Terrier et al., 2005). Recent data have suggested a role for different hormone signalling during grape ripening, including ABA, auxin, or ethylene (Harpster et al., 1998; Cakir et al., 2003; Castillejo et al., 2004; Chervin et al., 2004; Tesniere et al., 2004; Symons et al., 2006). However, we have little knowledge of the mechanisms underlying signalling cascades leading to grape berry ripening. In this context, basic information on the major molecular determinants of development and ripening signalling in grape berries is strongly required. The implication of Rop GTPases in different cellular processes in various plant species suggests that they could play an important role in the biology of grape berry development.
As a preliminary step to the genetic dissection of the function of individual Rops in fruit development, (i) VvRops have been identified by searching expressed sequence tag (EST) and genome project databases; (ii) a molecular description of the VvRop gene family with phylogenetic analysis and genome map positioning has been undertaken; and (iii) the possible organ specificity of VvRops, as well as their expression patterns throughout berry development and in response to different treatments (including hormones) in suspension cells have been analysed by real-time quantitative reverse transcription-PCR (RT-PCR).
Materials and methods
In silico sequence analysis
To search databases for ESTs encoding VvRops, two characteristic motifs (SRFIKCVTVGDGAVGKTC and NLGLWDTAGQEDYNRLRPLSYRGAD) were used to identify these sequences. Working with this set on NCBI resources, the sequences recovered were translated and compared by tBLASTN with GenBank data. In order to obtain a unigene set, the EST sequences matching these two motifs were clustered and assembled using the Phrap software (http://www.phrap.org/phredphrap/phrap.html). Each member of this set was studied individually in order to check whether it represented or not a complete sequence, and whether its domain could qualify as an authentic Rho domain, finally controlling the transcript for redundancy.
For phylogenetic analysis, sequence alignments and comparisons of the seven VvRop nucleotide sequences from grapevine with the 11 AtRop proteins from Arabidopsis thaliana were performed with ClustalW software (Thompson et al., 1994). An unrooted phylogenetic tree was generated using the Phylip protein sequence parsimony method (Felsenstein) software (http://bioweb.pasteur.fr/seqanal/interfaces/protpars.html).
To investigate the VvRop gene molecular organization, the VvRop full-length cDNA sequences were blasted (Altschul et al., 1997) against the Genoscope blast server for V. vinifera (http://www.cns.fr/cgi-bin/blast_server/projet_ML/blast.pl), resulting in several trace names corresponding to the best blast hits on the query sequence. Sequences related to these trace names and corresponding to the shotgun grapevine genome sequencing were obtained from the NCBI trace archive server (http://www.ncbi.nlm.nih.gov/Traces/trace.cgi). To evaluate the intron–exon organization, genomic sequences were aligned with the cDNA sequences and translated using the ExPaSy Proteomics server (http://www.expasy.org/).
Plant material and treatments
The plant material used in this study was from V. vinifera L. (cv Cabernet Sauvignon) field-grown vines, greenhouse-grown cuttings, and cell cultures. Representative samples were taken from various organs: dormant buds, young expanding leaves, fully developed leaves, tendrils, inflorescences, stamens, pistils, flowers, and pips. In order to randomize biological variations, samples were pooled from five different plants or cuttings (in the case of root samples). Fruits were harvested to constitute a developmental series of eight stages, from 3- (early green stage) to 12- (fully ripe) weeks post-flowering (WPF) berries. In order to randomize biological variations, samples were pooled from five different plants or cuttings (in the case of root samples). One hundred berries were taken at each stage from at least five bunches, with 20 berries from each plant. All the samples were frozen in liquid nitrogen and stored at –80 °C.
Cell suspensions were grown on a rotary shaker as previously described (Torregrosa et al., 2002). Flasks containing 100 ml of suspension cells (5-d-old subcultures, exponential growth phase) were treated with 2-chloroethylphosphonic acid (CEPA, 50 μM), an ethylene-releasing chemical (Abeles et al., 1992), 1-methylcyclopropene (MCP, 1 ppm), a specific inhibitor of ethylene receptors (Blankenship and Dole, 2003), ABA (50 μM), or α-naphthalene acetic acid (NAA, 50 μM). As ABA and NAA were dissolved in 1% ethanol, a corresponding control was also included. Before and 15 min, 1 h, and 24 h after treatment, cell aliquots were collected on a Whatman filter by vacuum filtration, immediately frozen in liquid nitrogen, and stored at –80 °C. Two separate experiments were performed.
RNA extraction and real-time quantitative RT-PCR analysis
Total RNAs were isolated from powdered tissues using the SV Total RNA Isolation System (Promega, France) for cells, and using the Rneasy Plant Mini Kit (Qiagen) for other tissues. First-strand cDNA was synthesized using 0.5 μg of total RNAs by priming with an oligo(dT) anchor at 42 °C for 50 min using Superscript-II reverse transcriptase (Invitrogen) according to the manufacturer's instructions.
Real-time quantitative RT-PCR was conducted with SYBR Green PCR Master Mix and gene-specific primers (Table 1). Each PCR (20 μl final volume) contained 5 μl of template cDNA, 250 nM of each primer, and 1× SYBR® Green PCR master mix (Applied Biosystems, Warrington, UK). Thermocycling conditions were as follows: an initial enzyme activation of 10 min at 95 °C, followed by 40 cycles of denaturation for 15 s at 95 °C, annealing and extension for 1 min at 60 °C, with a final melt gradient starting from 60 °C and heating to 95 °C at a rate of 0.03 °C s−1. The real-time PCRs were carried out in a 7300 Fast Real Time PCR System (Applied Biosystems). The fluorescence of reactions was measured at wavelengths of 497 nm (excitation) and 521 nm (detection) at the end of each extension step and at each 1 °C increment of the melt profile. Primer specificity was confirmed by analysing dissociation curves of the PCR amplification products.
5′- and 3′-end primers used for full-length cDNAs
| Pair name | 5′-end forward primer sequence | ATG codon | 3′-end reverse primer sequence | Stop codon | Product length |
| VvRop1 F1/R1 | TTGTGGAGGTCGTGTGATCAGG | –58 | TGAATATGGTGGGAGAATAGAGG | +31 | 702 bp |
| VvRop7 F1/R1 | AGCGTTTCTAAGTCAAGAGG | –52 | GAAATTAACATGGAAATTGGC | +25 | 664 bp |
| VvRop8 F1/R1 | TGATGGAGAGAATGAGAGTTCC | –136 | ATCTGATCATGGAACTGTGAGG | +52 | 808 bp |
| VvRop9 F1/R1 | TTCTTGTTTGTGGTCTTGAGGG | –26 | CTGTCAAAGGTTGGATATCACC | +29 | 713 bp |
| VvRop11 F1/R1 | AGTTGAAAACTTTGGTTCTGGG | –63 | GACTGCATATTAGTGTGGTTGG | +50 | 763 bp |
| VvRop12 F1/R1 | CAGCAGCTGACATTGAATTAGG | –73 | TGCAGCTTCCTCAAAGTGG | +89 | 778 bp |
| VvRop13 F1/R1 | TTTACCAGATGCACATCTGAGG | –96 | ATAACAGTGACTGAGAGACTGC | +59 | 770 bp |
All cDNA samples to be compared for transcript levels were analysed in triplicate in a single batch for each primer pair for each gene. To ascribe a relative transcript copy number to each cDNA sample, a purified PCR fragment of each gene sequence was serially diluted 10-fold to obtain template standards. The most concentrated standard was assigned an arbitrary transcript copy number and the subsequent serially diluted standards were assigned relative copy numbers according to the n-fold dilution. Standards from 10−5 to 10−9 of the gene to be analysed and from EF1-α were included in the real-time PCR assay of cDNA samples. In each case, dilution series of standards showed a linear change in cycle threshold values, and cDNA templates were thus ascribed a relative transcript copy number by comparing their cycle threshold values with the standards. All templates and standards were run in triplicate and expressed as the average ±SD. Sample values were corrected using the corresponding expression level of EF1-α, a constitutively expressed isogene (Terrier et al., 2001). The specificity of the PCR product generated for each set of primers was tested by cloning in pGemT-Easy (Promega, Madison, WI, USA) and sequencing (MWG, France) the product.
Cloning and sequencing of VvRop small GTPases
Rapid amplification of 3’ cDNA ends (3’ RACE) was performed to obtain full-length VvRop11 cDNA. First-strand cDNA was synthesized using 2.5 μg of total RNAs by priming with an oligo(dT) adaptor primer (Frohman et al., 1988) at 42 °C for 50 min using Superscript-II reverse transcriptase (Invitrogen) according to the manufacturer's instructions. The PCR amplifications were carried out using the adaptor primer and the sense primer 5′-TGGATTCCTGAGCTTCAGC-3’ designed from the sequence with GenBank accession no. CB972104. An antisense primer 5′-ATTGCAGCATCAAAGACAGC-3’ was also used to control the amplicon specificity.
For all the VvRops, the full-length cDNAs were obtained using the primer pairs designed respectively in the 5′- and 3′-end regions of the coding sequences (Table 2). The PCRs were cycled 30 times at 94 °C for 1 min (4 min for the first cycle), 50 °C for 1 min, and 72 °C for 1 min (15 min for the final cycle). The amplified products were cloned in the plasmid pGemT-Easy (Promega, France) and sequenced (MWG, France).
3′-end primers used for real-time quantitative RT-PCR experiments
| Pair name | 3′-end forward primer sequence | Stop codon | 3′-end reverse primer sequence | Stop codon | Product length |
| VvRop1 F2/R2 | TTGTGAAGCATCAAGCGACT | +131 | GGAGGCAAATTTCGTGCTTA | +380 | 249 bp |
| VvRop7 F2/R2 | CTGCAATCCCTCCTTCAATC | +37 | CTGCAATCCCTCAATCCAAT | +218 | 181 bp |
| VvRop8 F2/R2 | TGCTGCTGCTGATGTTCTGT | +11 | CACAAGATGCAATTCCCACA | +163 | 152 bp |
| VvRop9 F2/R2 | GTTGAAACCAGGATGGATGG | +14 | CAATTCCCACTTGCTCTTCC | +187 | 173 bp |
| VvRop11 F2/R2 | CAACCACACTAATATGCAGTCCA | +48 | CGAAACCGATAACAGCCATAA | +203 | 155 bp |
| VvRop12 F2/R2 | GTGTGGGGAGGAAAAGATGA | +16 | GAACCAAATTGAAGCGGTGT | +252 | 236 bp |
| VvRop13 F2/R2 | CTGCCAGCCCTCTGACTG | +42 | GGAATGCCAGTCATCCAGTT | +220 | 178 bp |
Western blot analysis
Powdered berry tissues were suspended in 50 mM TRIS-HCl pH 7.5 extraction buffer containing 7 M urea, 2 M thiourea, 2% Triton X-100 (w/v), 2% polyvinyl polypyrrolidone (PVPP; w/v) and 1% dithiothreitol (DTT) (Perugini and Schubert, 2002). Cell debris was removed by centrifugation at 3000 g for 30 min at 4 °C. Supernatant proteins were precipitated by trichloroacetic acid [TCA; 12% (w/v) final concentration] and centrifuged at 13 000 g for 15 min at 4 °C. Pellets were washed twice with acetone and centrifuged in the same conditions. Proteins were solubilized in a lysis solution containing 7 M urea, 2 M thiourea, 2% Triton X-100 (w/v), 2% CHAPS (w/v), 2% ampholines (v/v), and 0.2% DTT (w/v). After dilution (1/10), aliquots of the solution were used for protein content determination (Bradford, 1976). Equal amounts of protein were loaded and separated by SDS-PAGE (14%) along with molecular weight markers. Protein bands were transferred to nitrocellulose membranes by electrophoretic blotting (Trans Blot Cell, Bio-Rad). Membranes were blocked with 5% (w/v) milk powder in phosphate-buffered saline (PBS; 0.8% NaCl, 0.02% KCl, 0.14% Na2HPO4, 0.02% KH2PO4, pH 7.4) for 120 min at room temperature, then incubated for 120 min at 4 °C with appropriate concentrations of antibodies (1:2000). After rinsing three times for 10 min in PBS, membranes were incubated for 60 min at room temperature with secondary antibodies (1:2000) labelled with alkaline phosphatase (Sigma) in 50 mM TRIS-HCl pH 7.5 containing 150 mM NaCl. After rinsing in this last buffer, the blots were stained with 5-bromo-4-chloro-3-indolylphosphate toluidine salt–nitro-blue tetrazolium chloride (Sigma) following the manufacturer's instructions. After staining, the reaction was stopped by the addition of deionized water.
Mapping the VvRop genes on the grapevine genome
The genes were anchored on bacterial artificial chromosome (BAC) clones from a Cabernet Sauvignon library as described in Lamoureux et al. (2006), using the primers designed for the expression analysis (Table 1). The fingerprint-based contig assembly of BAC clones using the FPC software (Soderlund et al., 2000) was described in Castellarin et al. (2006), and the links established with the consensus grapevine genetic map published by Doligez et al. (2006) were described by Lamoureux et al. (2006). The integration of all these data was used to place the genes onto the linkage groups of the grapevine genetic map.
Results
Cloning of VvRop cDNAs and sequence comparison
To start a detailed examination of the Rop GTPase subfamily proteins from Vitis species, an EST database search was performed starting with sequence information of two conserved motifs (see Materials and methods). Fifty EST sequences were obtained matching these two motifs that could be assembled into tentative mRNA sequences in silico (data not shown). The resulting unigene set had 10 contigs and one singlet. After checking for redundancy, chimeric proteins, and Rho signature, seven different Vitis Rop GTPase homologous proteins were obtained (Table 3). For one of them, whose 3’ region was missing, the partial contig was completed with a 3’ RACE experiment with the appropriate primers (see Materials and methods). For all seven sequences, the correct assembly was checked by sequencing the full-length cDNAs obtained by RT-PCR from V. vinifera RNA. The VvRops were named according to their clear sequence similarity to Rops from A. thaliana (AtRops).
Characteristics of the VvRop unigene set (c, reverse complement)
| GenBank accession no. | Positions on the contig | |
| VvRop1 | CF202215 | 1–759 |
| CF216120 | 17–721 | |
| CF202269c | 391–1215 | |
| VvRop8 | CF512264 | 1–852 |
| CF512176c | 220–1094 | |
| VvRop9 | CF209883 | 1–721 |
| CN605040 | 22–681 | |
| CF209964c | 43–913 | |
| CX017564 | 223–670 | |
| CX017375 | 223–670 | |
| VvRop11 | CB972104 | 1–695 |
| 3' RACE | 105–1034 | |
| VvRop12 | CF405385 | 1–635 |
| CN006771 | 7–693 | |
| CF355591 | 10–842 | |
| CF355592 | 10–720 | |
| CB004006c | 427–1018 | |
| CN603780c | 454–1131 | |
| VvRop13 | CF214883c | 1–803 |
| CV098231c | 20–851 | |
| CB910212c | 53–687 | |
| CD007465c | 145–789 | |
| CN545296c | 287–697 | |
| CN546366c | 356–943 | |
| CB976795c | 500–941 | |
| CF212782c | 514–1242 | |
| CF215290c | 525–1313 |
The open reading frames of the VvRop GTPases showed high amino acid sequence similarities, ranging from 62.2% to 98.5% (Fig. 1). The VvRop cDNAs encoded proteins of 196–210 residues, with predicted molecular masses of around 22 kDa, and theoretical isoelectric points from 9.2 to 9.4 (Table 4). The amino acid sequences of all VvRop GTPases typically contained the seven functional domains presented in Zheng and Yang (2000). The GTPase domains (I and III), the GDP/GTP-binding domains (IV and VI), and the effector domain (II) were highly conserved among all seven homologues (Fig. 1). In contrast, the insert region (V) that is probably responsible for downstream signalling and the C-terminal hypervariable region (HVR, VII) that contains signals targeting the protein to specific membranes are domains with high divergence among all the VvRop GTPase subfamily members. VvRops could be divided into three groups according to the HVR at the C-terminus: five of them (VvRop1, VvRop7, VvRop8, VvRop12, and VvRop13) contained the geranylgeranylation motif CaaL (C, cysteine; L, leucine; a, aliphatic amino acid), and the two others exhibited a longer C-terminal region with a CAAA motif (VvRop9), or an incomplete three-residue CFK motif (VvRop11). In addition, all VvRop GTPases contained putative serine/threonine phosphorylation sites (SNK, SYR, SKK, and SSK/SAK), which might be targets for receptor-like kinases (RLKs) when assembled into signalling complexes with Rop GTPases (Trotochaud et al., 1999). Some of these sites are specific to subgroups: SNK for VvRop9 and VvRop11; and SKK for VvRop1, VvRop7, and VvRop8. Finally, the T38, V39, D41, A62, Y67, R69, and H106 residues, which have been shown to be involved in the Rac/Rho–GDI protein–protein interface (Hoffman et al., 2000; Scheffzek et al., 2000), are conserved between all VvRops (indicated by an arrow in Fig. 1), except VvRop9 which displays a R106 residue.
Characteristics of the VvRop cDNA deduced proteins
| No. of residues | Predicted molecular mass (kDa) | Theoretical pI | |
| VvRop1 | 197 | 21.7 | 9.2 |
| VvRop7 | 196 | 22.1 | 9.2 |
| VvRop8 | 198 | 21.7 | 9.4 |
| VvRop9 | 210 | 22.9 | 9.4 |
| VvRop11 | 210 | 23.4 | 9.3 |
| VvRop12 | 198 | 21.8 | 9.4 |
| VvRop13 | 197 | 21.6 | 9.3 |
| No. of residues | Predicted molecular mass (kDa) | Theoretical pI | |
| VvRop1 | 197 | 21.7 | 9.2 |
| VvRop7 | 196 | 22.1 | 9.2 |
| VvRop8 | 198 | 21.7 | 9.4 |
| VvRop9 | 210 | 22.9 | 9.4 |
| VvRop11 | 210 | 23.4 | 9.3 |
| VvRop12 | 198 | 21.8 | 9.4 |
| VvRop13 | 197 | 21.6 | 9.3 |
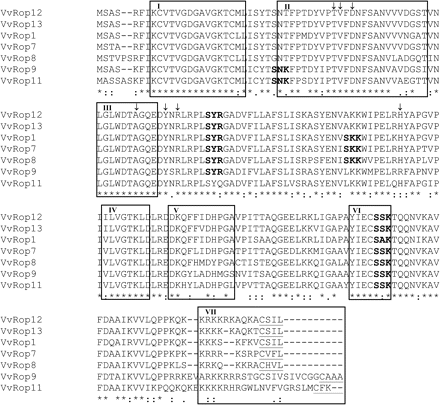
Multiple alignment of the Vitis vinifera Rop deduced amino acid sequences. Identical residues are indicated by an asterisk. Distinct functional domains are designed according to Zheng and Yang (2000): GTPase domains (I and III), GDP/GTP-binding domains (IV and VI), effector domain (II), RHO insert region (V), and membrane localization domain (VII) or hypervariable region (HVR). In the VII domain, residue C (underlined) is conserved in all GTPases, and the geranylgeranylation motif CaaL is present except in VvRop9 (in which the isoprenylation motif is not present) and in VvRop11, which displays instead the CaaX (the terminal X can be any amino acid except L) farnesylation motif. The four motifs (SNK, SYR, SKK, and SSK/SAK) shown in bold are putative serine/threonine-dependent phosphorylation sites. Variations in these phosphorylation sites are observed between the different Rop GTPases. Residues shown by arrows are putatively involved in Rop/Rop–GDI interaction by homology with animal GTPase data.
Phylogenetic analysis of Rop GTPases expressed in Vitis vinifera
A comparison of the seven deduced VvRop proteins with the 11 encoded AtRop proteins was used as a boostrap analysis to construct an unrooted consensus phylogenetic tree (Fig. 2). Examination of the resulting tree indicated that the VvRops were distributed into the four Arabidopsis groups defined by Zheng and Yang (2000). For group I, VvRop8 belongs to the same clade as AtRop8 (AtRac9), with the same C-terminal CHVL sequence. VvRop9 and VvRop11 group together in a clade with AtRop9 (AtRac7), AtRop10 (AtRac8), and AtRop11 (AtRac10) corresponding to group II with various C-terminal sequences. VvRop7 belongs to the same clade as AtRop7 (AtRac2) in group III. VvRop1 belongs to the same clade as AtRop1 (AtRac11), AtRop3 (AtRac1), and AtRop5 (AtRac6) in group IV, as well as VvRop12 and VvRop13 which belong to a distinct subgroup with almost the same C-terminal KAQK(A/T)CSIL sequence. This high similarity between VvRop12 and VvRop13 proteins suggests that this is a relatively recent duplication. However, it is not excluded that VvRop12 and VvRop13 could be allelic forms of the same gene, as V. vinifera is highly heterozygous.
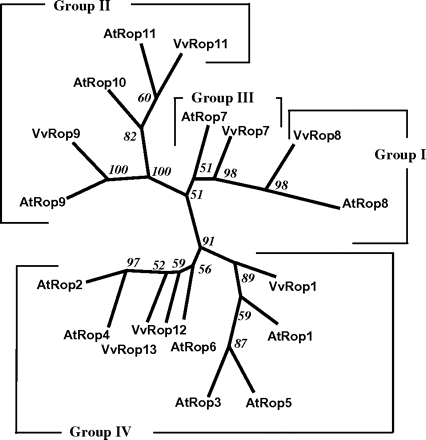
Bootstrap consensus tree from the parsimony analysis showing the phylogenetic relationship among the seven Vitis vinifera Rop sequences, and the 11 A. thaliana Rop sequences. The four groups identified previously for AtRop sequences (Zheng and Yang, 2000) are shown. GenBank accessions numbers for the sequences are as follows: AtRop1 (AAC78390); AtRop2 (AAC78391); AtRop3 (AAF40237); AtRop4 (AAF40244); AtRop5 (AAF40245); AtRop6 (AAF40242); AtRop7 (AAF40241); AtRop8 (AAD42972); AtRop9 (AAF40246); AtRop10 (AAF40247); AtRop11 (BAB10857). The numbers on the branches indicate the number of times the partition of the species into the two sets which are separated by that branch occurred among the trees, out of 100 trees.
VvRop gene structure
The VvRop gene molecular organization was evaluated using the data obtained from the shotgun grapevine genome sequencing project (http://www.cns.fr/externe/Francais/Projets/Projet_ML/projet.html#biblio). The selected grapevine genomic sequences were annotated to determine the intron–exon structure of the VvRop genes (Fig. 3). Analysis of the intron–exon junctions deduced from alignement with the VvRop cDNA sequences revealed seven exons and six introns for VvRop1, VvRop7, VvRop8, VvRop12, and VvRop13, and an additional exon and intron for VvRop9 and VvRop11. Introns 4 from group IV VvRop were the longest introns (∼2 kb), whereas the other introns were shorter (ranging from 74 bp to 1.4 kb). Exons were relatively short (ranging from 34 bp to 111 bp), exon 8 (when present) being the shortest.
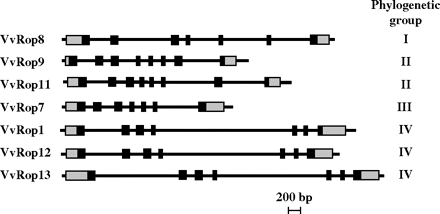
Molecular organization of the seven Vitis vinifera Rop GTPases. Coding regions are shown as dark rectangles, untranslated regions as grey rectangles, and introns are represented by straight lines. The phylogenetic group to which each VvRop gene belongs (see Fig. 2) is noted on the right.
Localization of the VvRop genes on the grapevine genome
One to ten positive BAC clones were identified in the screened library. Among these anchored clones, 1–6 were fingerprinted and contiged. The integration of all this information allowed four out of seven members of this gene family to be located unambiguously and a likely position for another one to be proposed. These results are summarized in Fig. 4, and the details can be accessed at http://urgi.versailles.inra.fr/GnpMap/welcome.do.

Genetic distribution of part of the Vitis vinifera Rop GTPase gene family. Linkage groups are drawn according to Doligez et al. (2006). The approximate location of the gene is indicated by an arrow followed by the name of the gene.
VvRop1 was found in two allelic contigs (ctg1769 and ctg2230). The first one was also anchored by two simple sequence repeat (SSR) markers from linkage group 4, VRZAG83 and VVIP77, and could thus be placed near these two markers on the genetic map. VvRop7 was found in two small allelic contigs, not genetically anchored. VvRop8 anchored ctg2260 together with SSR markers VVIB22 and UDV011, from linkage group 7. VvRop9 anchored ctg56, which contained the marker VVMD25 from linkage group 11. VvRop11 anchored contig ctg2157, together with SSR markers VMC9G4 and VVC82 from linkage group 17. The two contigs anchored by VvRop12 (ctg2134 and ctg438) contained no mapped markers. The two contigs anchored by VvRop13, ctg2226 and ctg42, were chimeric: ctg2226 contained the SSR markers VMC3E5 from linkage group 18 and GT183H07 from linkage group 13; and ctg42 contained VMC4H5 from linkage group 6 and UDV108 from linkage group 18. Both contigs were thus re-analysed with a more stringent cut-off (e-55 and e-60 instead of e-40). At e-60 cut-off, ctg2226 was split into three pieces, one containing the two clones anchored by VvRop13, one containing the two clones anchored by VMC3E5, and the last containing the clones anchored by GT183H07. At e-55 cut-off, ctg42 split into six pieces, one containing UDV-108 and the five others containing allelic contigs anchored with either VvRop13 or VMC4H5. Two contigs could be linked to each other by VvRop13 and two by VMC4H5, with some of their clones interspaced in the relaxed version of the map. It is thus very likely that VvRop13 is localized on linkage group 6 close to VMC4H5.
Grapevine organ profiling of VvRop transcripts
To elucidate the physiological functions of different members within this subfamily, the constitutive expression levels of the VvRop transcripts in different grapevine organs were analysed next: RNA samples from roots, buds, young expanding leaves, fully developed leaves, tendrils, inflorescences, stamens, pistils, flowers, and pips were amplified using real-time quantitative RT-PCR with sense and antisense 3’ gene-specific primers. Normalization of the results against the expression of the constitutive elongation factor EF1-α and control of similar amplification efficiencies was performed to allow for comparisons between organs and between the different members of the VvRop subfamily. Analyses showed that VvRop genes were expressed in all grapevine organs investigated (Fig. 5), except in cell suspensions for VvRop7, in roots for VvRop1, VvRop7, and VvRop9, in stamens for VvRop7, VvRop 8, and VvRop9, and in pips for VvRop7. VvRop1 transcripts were 4–16-fold more abundant in tendrils than in all other organs. VvRop7 transcripts, which generally exhibited a low expression level, were more abundant in tendrils and in inflorescences. VvRop8 and VvRop12 transcripts were similarly abundant in most tissues analysed, but 5–15-fold less abundant in pistils, flowers, and pips in the case of VvRop8. VvRop9 transcripts displayed a significantly higher tissue specificity, with the highest levels in cell suspensions, buds, and young expanding leaves. VvRop11 transcripts were 5–10-fold more abundant in cell suspensions, expanding leaves, and stamens than in all other tissues. VvRop13 transcripts were 4–20-fold more abundant in stamens than in all other tissues.
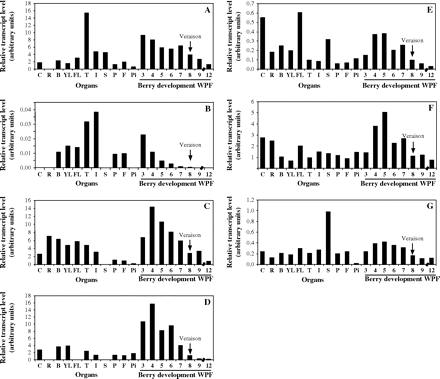
Transcript profiling of VvRops in various Cabernet Sauvignon grapevine organs and during berry development. Total RNAs were isolated from suspension cells (C), roots (R), buds (B), young expanding leaves (YL), fully developed leaves (FL), tendrils (T), inflorescences (I), stamens (S), pistils (P), flowers (F), pips (Pi), and 3–12-week post-flowering (WPF) berries. VvRop transcript levels were normalized to EF1-α transcript level used as an endogenous reference (for correcting results from differing amounts of input RNA), and expressed as arbitrary units. (A) VvRop1; (B) VvRop7; (C) VvRop8; (D) VvRop9; (E) VvRop11; (F) VvRop12; (G) VvRop13. Veraison is indicated by an arrow.
Grape berry developmental profiling of VvRop transcripts and proteins
It was of interest to determine whether the grapevine VvRops were expressed during the development of grape berries, and, if so, whether the different genes were expressed in distinct patterns. As shown in Fig. 5, all seven VvRops were strongly expressed in grape berries and exhibited mainly similar, developmentally regulated patterns of expression. VvRop transcript levels generally peaked at 4–5 WPF, being 2–20-fold more abundant in early herbaceous stages than at the onset of ripening (veraison). After veraison, from eight to 12 WPF, VvRop expression declined coincidently with the ripening. The same results were observed in a repeat experiment using all eight stages for VvRop 9 (more specifically expressed in berries) and four stages for all other Rops (data not shown).
Using specific anti-Rop antibodies, western blot analysis from a series of developing berries extracts revealed a band (∼22 kDa) corresponding to the Rops’ molecular mass (Fig. 6). VvRops proteins were found to be mainly expressed in the first stages of fruit development, whereas no expression was detected after veraison and during ripening.
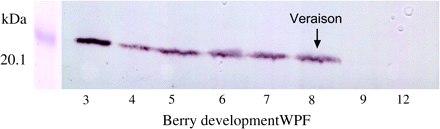
Western blot analysis using anti-Rop GTPase antibodies with protein extracts from a series of developing berries. Equal amounts of protein (33 μg) were loaded in each lane. Protein markers for the indicated molecular masses were co-separated and stained with Coomassie blue. Veraison is indicated by an arrow.
Effect of treatments on grapevine suspension cells
Expression of VvRops was also examined by real-time quantitative RT-PCR in grapevine suspension cell cultures before and after different treatments including growth regulators. Only data obtained after 24 h are reported, as shorter periods (15 min or 1 h) yielded mainly similar results. Treatments of grapevine cells with CEPA, MCP, ABA, or NAA led to various responses according to the VvRops (Fig. 7). CEPA treatments significantly enhanced (VvRop1 and VvRop11) or decreased (VvRop8 and VvRop12) transcript levels. Except for VvRop12, these variations disapeared when cells were treated with MCP. ABA treatment led to a significant reduction of VvRop8 and VvRop9 expression. VvRop1, VvRop8, VvRop11. and VvRop12 transcript levels were also reduced significantly in cells treated with NAA. No expression of VvRop7 was observed in suspension cells whether they were treated or not.
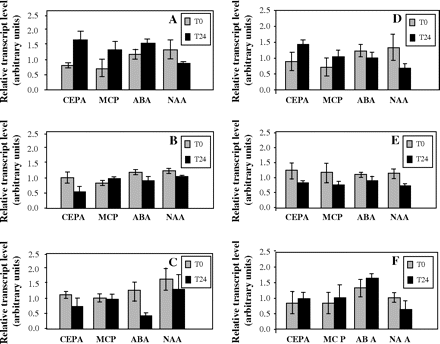
Transcript profiling of VvRops in suspension cells from Cabernet Sauvignon after different treatments. VvRop transcript levels were normalized to the EF1-α transcript level used as an endogenous reference (for correcting results from differing amounts of input RNA), and expressed as arbitrary units (bars=SD). (A) VvRop1; (B) VvRop8; (C) VvRop9; (D) VvRop11; (E) VvRop12; (F) VvRop13. No VvRop7 expression was detected in suspension cells.
Discussion
A total of 342 576 ESTs and 109 150 genomic sequences of V. vinifera are now available in databases to be used in genetic and molecular research. In the present study, these databases have been examined (January 2007) for a study of the VvRop gene family, as this class of genes plays a fundamental role in the control of various processes of plant development. By using the nucleic acid and protein sequence BLAST searching software, clustering and assembling these sequences, seven full-length cDNAs encoding VvRops were found. This number of expressed grapevine Rops compares with the number of Rops/Racs found in other plant species (Li et al., 1998; Hassanain et al., 2000; Schultheiss et al., 2003; Morel et al., 2004).
The comparisons of the VvRop gene structure with the known Rop/Rac structures in rice (Christensen et al., 2003) and in Arabidopsis (Winge et al., 2000) revealed an almost complete conservation of the gene exon–intron structure and the presence of an additional exon in the 3’ end of a subset of Rop genes (Winge et al., 2000; Lavy et al., 2002). The VvRops could all be placed in the four different phylogenetic groups of the plant Rop/Rac subfamily, and were numbered in accordance with their similarities to the A. thaliana Rops. VvRops from groups I, III, and IV displayed seven exons, and those from group II eight exons. All the identified VvRops shared the seven typical domains, with five perfectly conserved domains I, III, IV, VI, and II corresponding to the effector loop that is thought to be responsible for interaction with GTPase-activating proteins (Moodie et al., 1995). The insert region (V) that is probably responsible for downstream signalling (Valster et al., 2000) was very similar in VvRop1, VvRop12, and VvRop13, suggesting different functions for the other VvRops. The second domain of the VvRop proteins without high similarities was the HVR (VII) at the C-terminus, thought to be required for subcellular targeting (Bischoff et al., 2000; Lavy et al., 2002). However, the basic character of this region was always conserved, as well as the cysteine residues. Interestingly, group II VvRop9 and VvRop11 shared an additional intron in this region with genes belonging to the same group II in other species (Winge et al., 2000). In this additional intron 7, an immediate in-frame stop codon was present in VvRop9 and in VvRop11 as previously described in AtRop9 (AtRac7), ZmRop6, and ZmRop7 (Ivanchenko et al., 2000). This suggests that each of these genes could produce two transcripts encoding isoforms with distinct HVRs. Moreover, the three internal cysteines present in these Rops (Ivanchenko et al., 2000) were also conserved in VvRop9, but were lacking in VvRop11. All VvRop-encoded proteins, except those from group II, terminated with the consensus C-terminal CaaL (a, aliphatic amino acid) motif required for membrane association. The presence of leucine specified the addition of a geranylgeranyl group (Casey and Seabra, 1996; Trainin et al., 1996), whereas the presence of alanine in the C-terminal CaaA motif of VvRop9 signalled the addition of a farnesyl group (Lavy et al., 2002). In contrast to maize group II Rops (Ivanchenko et al., 2000), no additional internal CaaX box (X, serine, methionine or leucine) was present in VvRop9 or VvRop11. All these data suggest the absence in group II VvRops of the usual elements required for plasma membrane targeting. However, it is not excluded that VvRop9 could be targeted to the plasma membrane by a mechanism similar to that described for AtRop9 (AtRac7), AtRop10 (AtRac8), and AtRop11 (AtRac10) (Lavy et al., 2002). In fact, VvRop9 possessed the conserved GC–CG box, a motif required for membrane association present in group II AtRops (Lavy and Yalovsky, 2006).
Five out of seven VvRop genes could be quickly placed on the map of the V. vinifera genome, each located on a different chromosome as expected from the ubiquitous repartition of small GTPases gene families in other species (Jiang and Ramachandran, 2006). In the same study, it was also shown that a high proportion of the members of these gene families, from 53.6% in rice to 93.3% in human, is found in duplicated regions of the genome. Complete data on duplications in the grape genome are not yet available (www.cns.fr); however, the fact that VvRop13 was found in two chimeric contigs is an indication that it could belong to a duplicated region causing chimeric assemblies of fingerprint patterns. Finally, no evidence of any tandem clustering of these genes was found, which was however observed for around 13% of the small GTPases in model species (Jiang and Ramachandran, 2006). The Rop GTPase gene family in grapevine thus contains the same classes of genes as in other plants, with no indication of expansion or retraction of the gene family. Thus, even if this family has undergone multiple and specific duplication events in its history (Blanc and Wolfe, 2004; Adams and Wendel, 2005), the same global pattern of evolution as in other plants was found in grapevine.
Possible functions of VvRops were investigated through expression studies in various organs, during fruit development and in response to different cell treatments. As in other studies (Li et al., 1998), the current results showed that VvRops were differentially regulated in different organs. For instance, VvRop11, VvRop12, and VvRop13 were expressed in all the organs sampled, whereas expression of the other VvRops was restricted to some of these. Except for VvRop7 and VvRop9, expression of all VvRops was detected at higher levels in fully developed leaves, compared with buds and young expanding leaves. This contrasts with the observation that Rop transcripts were down-regulated in maize mature leaf tissue, compared with shoot apex (Christensen et al., 2003). None of our data has evidenced a single VvRop gene with expression restricted to a specific organ. However, VvRop9, which was only expressed a little in other organs, displayed a very high expression level in immature berries. To a lesser extent, VvRop1 was expressed strongly in tendrils and VvRop13 in stamens.
Gene expression for the seven VvRops was apparently not co-ordinated in the different tissues tested, displaying instead a unique developmental expression profile during berry development. In fact, high expression levels for all the seven VvRops were correlated in grape berries to those stages undergoing rapid cell division and/or expansion. In contrast to other grapevine organs, this pattern of high Rop expression in dividing and differentiating cells, and low expression in mature cells has already been observed in maize (Christensen et al., 2003), and points to a role for Rop genes in grape berry early development. Interestingly, the expression patterns of VvRop protein and related gene in berries were found to be similar, evidencing a limited post-transcriptional control of VvRop expression.
Phylogenetic grouping of VvRops is not associated with a particular expression pattern or level in organs, during fruit development or in response to cell treatments. These results demonstrated that VvRop transcripts were generally constitutively and differentially expressed in grapevine, suggesting a constitutive and/or specific function of these genes throughout the entire plant lifetime. A 24 h treatment with ethylene increased the transcript levels of VvRop1 and VvRop11, and decreased those of VvRop8 and VvRop12, whereas NAA treatment decreased all of these. These data suggested an involvement in ethylene or auxin signalling, which has been reported in other plant species (Li et al., 2001; Tao et al., 2002). Treatment with ABA for 24 h down-regulated VvRop9 gene expression with a dramatic 70% decrease in transcript levels. Interestingly, the other treatments did not affect VvRop9 expression. The ABA-specific down-regulation of VvRop9 is related to the specific function of AtRop10 (AtRac8) in the regulation of ABA responses (Zheng et al., 2002; Xin et al., 2005). Marked changes in the expression level of some VvRop genes after growth regulator treatment suggest that these VvRop proteins participate in cellular events triggered by plant hormones. As regards the response of VvRop9 to ABA, this expression pattern, as well as their conserved sequence, suggests that VvRop9 is functionally analogous to the AtRop10 (AtRac8) group which is implicated as a negative regulator of ABA responses in Arabidopsis.
The present results are consistent with a regulation of expression of VvRops by developmental and hormonal signals. Whereas VvRops probably respond to distinct signalling pathways (as inferred from their various responses to plant hormones), they are however all involved in grape berry early development, with a higher expression level at the green berry stage. This suggests that a common specific signal could control the expression of this gene family in grape berries. Compared with other VvRops, VvRop9 exhibited strong berry specificity, a specific response to ABA, and distinct sequence elements that suggest specific protein–protein interaction, as well as a distinct subcellular localization. Thus, it would be interesting to investigate further the function of this gene in relation to berry development. Studies of constitutive activated forms/dominant negative forms of the VvRop9 protein would facilitate definition of this function.
We wish to thank Dr F Doignon for critical reading of the manuscript, Dr Bailey-Serres for generously providing the anti-Rop antibodies, and Dr G Albagnac for supporting our research effort.

Comments