-
PDF
- Split View
-
Views
-
Cite
Cite
BH Wu, M Génard, P Lobit, JJ Longuenesse, F Lescourret, R Habib, SH Li, Analysis of citrate accumulation during peach fruit development via a model approach, Journal of Experimental Botany, Volume 58, Issue 10, July 2007, Pages 2583–2594, https://doi.org/10.1093/jxb/erm126
Close - Share Icon Share
Abstract
Based on the citrate model of Lobit and colleagues and measured data, a new model, which is able to reproduce the variation over time of citrate concentration in two peach cultivars, has been proposed. As in the original one, the new model calculates the rate of citrate synthesis or degradation as the product of a ‘synthesis potential’ and an ‘efficiency level’. While in the old model the ‘efficiency level’ was a simple linear function of temperature and respiration, in the new one its relationship with respiration is accounted for by a coefficient that decreases throughout fruit development. The differences in model parameters between the two cultivars were investigated: late-maturing cv. Suncrest had significantly lower citrate synthesis potential than mid-maturing cv. Fidelia. The responses of citrate concentration to model parameters, temperature, fruit respiration, and growth curves were studied. The most important parameter in the new model, k4,2, represented the date when the relationship between respiration and ‘efficiency level’ changed from positive to negative. Raising mean temperature increased the citrate concentration at the beginning and decreased it near maturity for cv. Suncrest, while citrate concentration increased throughout fruit development and more strongly for cv. Fidelia. An increase in the mesocarp dry weight increased both fruit respiration and citrate concentration at the beginning of fruit development, while near maturity it increased fruit respiration but decreased citrate concentration. The model was also able to reproduce the effect of assimilate supply (leaf:fruit ratio). Further potential uses of the model were discussed.
Introduction
Organic acids are important components of fruit flavour and, as such, contribute with soluble sugars and aromas to the overall organoleptic quality (Sweeney et al., 1970). Citrate is one of the most important organic acids for many fruits (Tucker, 1993). Understanding the development of acidity during fruit development requires studying the mechanisms involved in the accumulation of citrate. The ongoing studies of metabolism, enzyme activities or gene regulation throughout fruit development have not yet advanced adequate explanations to elucidate the complexity of the mechanisms involved in citrate accumulation. Moing et al. (1999, 2000) found that PEP-carboxylase, a key enzyme in organic acid biosynthesis, might participate in the control of organic acid accumulation during fruit development in the normal-acid peach fruit of cv. Fantasia with juice pH about 3.5 at maturity, while little relation between PEP-carboxylase activity and acid accumulation was found in the low-acid peach fruit of cv. Jalousia with juice pH about 4.5 at maturity. They suggested that mechanisms other than organic acid synthesis might account for the differences in acidity between normal-acid and low-acid peach fruit. Similarly, studies focusing on tonoplastic transport system (Canel et al., 1995) or mitochondrial citrate synthase (Canel et al., 1996) failed to explain the differences in citrate accumulation between high- and low-acidity citrus cultivars. In addition, Etienne et al. (2002) detected six genes involved in organic acid metabolism and found that their expression patterns were also not always correlated with the changes in organic acid concentration in peach. It appears difficult to identify single steps controlling acid accumulation.
Recently, a physiological model, constructed by Lobit et al. (2003), was proposed to be an integrating approach for analysing citrate accumulation at the whole fruit level. This citrate model was based on metabolic control theory (Fell, 1997) and a ‘top-down’ approach (Kell and Mendes, 2000): the fluxes in the citrate cycle, the transport of metabolites between the cytosol and the mitochondria, and the regulatory behaviour for the related enzymes were represented as linear combinations of regulatory factors (temperature, energy state, and metabolite concentrations); then groups of successive reactions were modelled as a single reaction. It has been successfully used to analyse the response of citrate concentration in peach fruit to variations of temperature and fruit growth (Lobit et al., 2003).
In this study, the focus was on improving the citrate model of Lobit et al. (2003) with a large body of experimental data sets incorporating different peach cultivars, assimilate availabilities, and years, and the sensitivities of citrate concentration to model parameters, temperature, fruit respiration, and growth were analysed further. The ability of the model to predict the relative importance of metabolism and dilution as a result of increasing fruit size was also analysed.
Description of the model
Citrate model established by Lobit et al. (2003)

 the net citrate production (mmol fruit−1 d−1). T0 is an arbitrary temperature (25 °C), and T is the mean temperature at date t. Resp is the respiration of fruit mesocarp in mmol CO2 d−1. k1 (mmol d−1) is the rate of net citrate production when T is equal to T0 and Resp is zero. k2 and k3 (°C−1) are temperature response coefficients. k4 (d mmol−1 CO2) is related to respiration and equal to
  when T is equal to T0 and
  is zero.
 over the monitored period, starting with citrate concentration observed at the beginning of this period. Citrate concentration in the mesocarp is obtained by dividing the total citrate amount by the mesocarp fresh weight:
Model inputs
The daily respiration of fruit mesocarp (Resp in mmol CO2 d−1), daily mean temperature (T in °C), days after full bloom (DAB), and daily estimates of fresh mesocarp weight (FW in g) are needed as entries of the model.

 (g d−1) the growth rate of dry mesocarp weight. Daily fresh and dry mesocarp weights were calculated using weekly measured values by local regression.
Modifications to the citrate model of Lobit et al. (2003)


Variations in k4 (day mmol−1 CO2), a parameter related to fruit respiration in the citrate model (equation 1), with days after bloom (DAB) for cv. Fidelia in 1995 and 1996. These variations were calculated using equation 2 with k1=0.0101 mmol d−1, k2=0.1180 °C−1, and k3= –2.2655 °C−1 taken from Lobit et al. (2003). The curves were smoothed by the S-plus ‘supsmu’ function.

Materials and methods
Plant material
Data from two peach cultivars (Set I and Set II) were included in our study. Sets I and II were introduced in detail by Lobit et al. (2003) and Génard et al. (2003), respectively. A brief description of them is given hereafter.
Set I was obtained on mid-maturing peach cultivar ‘Fidelia’ (maturity at mid-July) in 1995 and 1996. Trees were planted in 1992 in an orchard in the Nîmes region (South France) and received standard commercial practices. Samples were harvested weekly from the date of stone hardening to maturity and prepared for analysis. At each harvest date, 24 replicate samples, each one consisting of eight fruits in 1995 and four fruits in 1996, were analysed.
Set II was obtained from trees treated to obtain contrasting assimilate supplies to fruit over four crop seasons using late-maturing peach ‘Suncrest’/GF677 (maturity at the beginning of August). Trees were planted at the orchard of the INRA Avignon Centre (South France) in 1981 and received standard horticultural care.
At the end of May 1993, the beginning of June 1996, and mid-May 1997, about 240 fruit-bearing shoots on different trees were isolated by girdling. They were pruned to 6, 18, and 30 leaves per fruit (LF6, LF18, and LF30) in 1993 and 1996, and 10 and 30 leaves per fruit (LF10 and LF30) in 1997. Fruits were collected weekly until maturity and pooled to obtain four to five replicate samples in each leaf/fruit ratio treatment. These three experiments consisted of Set II-1.
The fourth experiment, called Set II-2, was performed on 27 June 1994 to suppress assimilate supply to the fruit by girdling the shoot. In this experiment, the shoots were girdled on both sides of the 29 fruit pedicels (G) while 29 control fruits that did not receive any treatment (C) were defined. Fruits were sampled four times until maturity.
The detailed procedures of citrate analysis, growth measurement and temperature recording can be found in Lobit et al. (2003) for Set I, and in Wu et al. (2002) and Génard et al. (2003) for Set II.
Model parameterization and comparison of parameters between two cultivars


The adjustment quality of equation 5 for Set I and of equation 6 for Set II-1 were compared with that of equation 4 by an analysis of variance table (S-Plus ‘Anova’ function). This table points out significant pairwise differences between the models and helps to select the best model.

Goodness of fit and predictive quality of the model
A criterion was computed to evaluate (i) the goodness-of-fit of the model on the basis of data Set I and Set II-1, which were separately used for parameterization, and (ii) the predictive quality of the model for the independent data Set II-2, which is a special situation of Set II-1.


Cross-validation, a common approach to estimating prediction error, was performed on data Set II-1 to review the predictive quality of the model further. The principles of cross-validation are as follows (Wallach et al., 2001). The data Set II-1 is split into two parts: one part has only a single situation (the target situation); the other part has all the data independent of the target situation. In this case, the second part of the data only includes situations that are not from the same year as the target situation. The parameters are estimated using the second part of the data, and the resulting parameter values are used to calculate RMSE and RRMSE for the target situation. The procedure is repeated using every situation in turn as the target situation. Averaging the RMSEs or RRMSEs over all the target situations gives the overall estimate of the absolute or relative root mean squared error of prediction (RMSEP or RRMSEP).
Sensitivity analysis
A sensitivity analysis was performed to investigate model responses to parameters, temperature, and fruit growth. The sensitivity of the responses to parameters and temperature was quantified by the normalized sensitivity coefficients, defined as the ratio between the relative variations of predicted citrate concentration and the relative variation of parameters and temperature. These coefficients were estimated by computing the responses of citrate concentrations to variations of±0.01% on the parameters and temperature.


Values of Gmax, Dmax, DW0, and DWmax obtained by fitting to the data were multiplied by ratios of 0.5, 1, and 1.5 to obtain different growth curves. In order to apply equation 7, a2 was first calculated by solving equation 9 with the root finder for continuous functions of S-Plus software, then a1 was calculated from equation 8.


Application of the model to analyse the effect of metabolism and dilution


Results
Model parameterization, adjustment, and predictive quality
The equation 4 was fitted to Set I and Set II-1, and the parameters were estimated (Table 1). The standard error for k2 in Set I was found rather high, as well as for k2 and k3 in Set II-1. Their estimated values were not significantly different from zero at P=0.05 level. Thus in equation 4, k2 for Set I as well as k2 and k3 for Set II-1 were supposed to be zero, and equations 5 and 6 were further proposed for Set I and Set II-1, respectively.
Parameter values and standard errors using equation 4 for cv. Fidelia during the 1995 and 1996 seasons (data Set I) and cv. Suncrest during the 1993, 1996 and 1997 seasons (data Set II-1)
| Parameter | Set I | Set II-1 | ||
| Estimated value | Standard error | Estimated value | Standard error | |
| k1 | 0.0414 | 0.0028 | 0.0261 | 0.0025 |
| k2 | −0.0190 nsa | 0.0283 | 0.0818 ns | 0.0472 |
| k3 | 0.1588 | 0.0105 | −0.0940 ns | 0.0476 |
| k4,1 | −0.0339 | 0.0047 | −0.0277 | 0.0053 |
| k4,2 | 101.48 | 0.8079 | 112.10 | 1.0884 |
ns indicates that the estimated value is not significantly different from zero at P=0.05.
The adjustment qualities, indicated by RMSE and RRMSE, of equation 1, 4, and 5 (for Set I) and 6 (for Set II-1) were shown in Table 2. Compared with the model of Lobit et al. (2003) (equation 1), equations 4, 5, and 6 obviously reduced RMSE and RRMSE, although they provided little or no improvement for cv. Fidelia in 1995 and for the LF10 treatment of cv. Suncrest in 1997. Equation 5 for Set I and equation 6 for Set II-1 did not show obvious difference in RMSE and RRMSE with equation 4, except that equation 5 reduced RMSE and RRMSE to less than half for cv. Fidelia in 1995. Subsequently, using analysis of variance the adjustment qualities of equation 5 for Set I and equation 6 for Set II-1 were further compared with that of equation 4. For Set I no significant difference was detected between equations 5 and 4. Similarly, for Set II-1 the adjustment quality of equation 6 did not significantly differ from that of equation 4. When the adjustment quality of the simpler model had no significant difference with that of the more complex model, the simpler model was chosen The number of parameters for equations 5 (4 parameters) and 6 (3 parameters) was less than equation 4 (5 parameters), and therefore they were preferred as the final appropriate citrate models for Set I and Set II-1, respectively.
Root mean squared error between observed and simulated values (RMSE in mmol 100 g−1 FW) and relative RMSE (RRMSE) using equations 1, 4, and 5 for cv. Fidelia during the 1995 and 1996 seasons (data Set I), and equation 1, 4, and 6 for cv. Suncrest during the 1993, 1996, and 1997 seasons (data Set II-1)
| Cultivar | Year | Treat | Equation 1 | Equation 4 | Equation 5 | |||
| RMSE | RRMSE | RMSE | RRMSE | RMSE | RRMSE | |||
| Fidelia | 1995 | 0.30 | 0.19 | 0.57 | 0.37 | 0.33 | 0.21 | |
| 1996 | 0.42 | 0.21 | 0.20 | 0.10 | 0.19 | 0.10 | ||
| Equation 6 | ||||||||
| Suncrest | 1993 | LF6 | 0.48 | 0.25 | 0.30 | 0.15 | 0.31 | 0.16 |
| LF18 | 0.80 | 0.57 | 0.41 | 0.29 | 0.43 | 0.31 | ||
| LF30 | 0.83 | 0.53 | 0.46 | 0.30 | 0.45 | 0.29 | ||
| 1996 | LF6 | 0.59 | 0.30 | 0.51 | 0.26 | 0.48 | 0.25 | |
| LF18 | 0.76 | 0.40 | 0.47 | 0.24 | 0.46 | 0.24 | ||
| LF30 | 0.60 | 0.39 | 0.24 | 0.15 | 0.23 | 0.15 | ||
| 1997 | LF10 | 0.29 | 0.17 | 0.48 | 0.27 | 0.49 | 0.28 | |
| LF30 | 0.53 | 0.39 | 0.40 | 0.29 | 0.42 | 0.31 | ||
Parameter values of equations 5 and 6 are presented in Table 3. Standard errors of the parameters were small. Late-maturing cv. Suncrest (Set II-1) had significantly lower values of k1 and higher values of k4,2 than mid-maturing cv. Fidelia (Set I). k4,1 was not significantly different between the two cultivars. Simulated citrate concentrations by these two models well matched the experimental results (Figs 2, 3). RMSEP and RRMSEP for Set II-1 (predictive quality) were 0.52 mmol 100 g−1 FW and 0.32, which can be considered as acceptable. The model adequately simulated the positive effect of assimilate supply on citrate concentration at the beginning of fruit growth and the negative effect at the end of fruit growth.
Parameter values and standard errors using equation 5 for cv. Fidelia during the 1995 and 1996 seasons (data Set I) and equation 6 for cv. Suncrest during the 1993, 1996 and 1997 seasons (data Set II-1)
| Parameter | Set I | Set II-1 | ||
| Estimated value | Standard error | Estimated value | Standard error | |
| k1 | 0.0399 aa | 0.0021 | 0.0234 b | 0.0013 |
| k3 | 0.1530 | 0.0106 | – | – |
| k4,1 | –0.0369 a | 0.0027 | –0.0357 a | 0.0030 |
| k4,2 | 101.86 a | 0.4868 | 111.51 b | 0.9240 |
| Parameter | Set I | Set II-1 | ||
| Estimated value | Standard error | Estimated value | Standard error | |
| k1 | 0.0399 aa | 0.0021 | 0.0234 b | 0.0013 |
| k3 | 0.1530 | 0.0106 | – | – |
| k4,1 | –0.0369 a | 0.0027 | –0.0357 a | 0.0030 |
| k4,2 | 101.86 a | 0.4868 | 111.51 b | 0.9240 |
In each line, the estimated values with different letters are significantly different according to F-test (P=0.05).
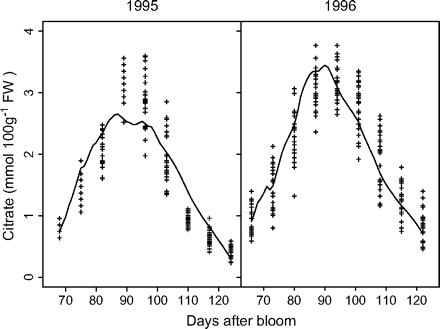
Measured and simulated citrate concentrations by the citrate model (equation 5) for cv. Fidelia during the 1995 and 1996 seasons (data Set I). Crosses represent repetitions of the measurements, and solid lines simulated citrate evolution.
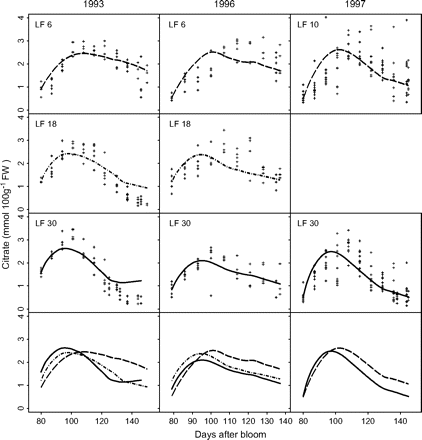
Measured and simulated citrate concentrations by the citrate model (equation 6) for cv. Suncrest during the 1993, 1996, and 1997 seasons (data Set II-1). The labels LF6, LF10, LF18, and LF30 indicate the leaf:fruit ratio. Crosses represent repetitions of the measurements, and lines simulated citrate evolution.
The parameter values, obtained by Set II-1, were further applied to the independent data Set II-2 (Fig. 4). Although the RRMSE was high (0.54), the model simulated the decrease of citrate concentration for the control treatment during the late period of fruit development. More interestingly, it predicted the lack of such decrease when the assimilate supply was suppressed, which was corroborated by the data from the girdling treatment.
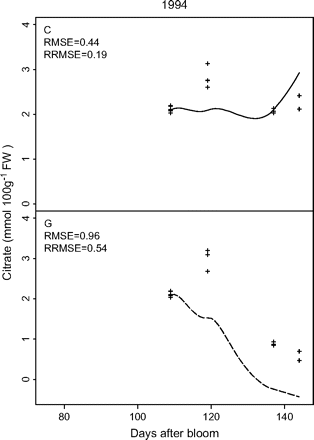
Test of the predictive quality of the citrate model (equation 6) using cv. Suncrest during the 1994 season (data Set II-2) with parameter values derived from cv. Suncrest during the 1993, 1996, and 1997 seasons (data Set II-1). The labels C and G indicate the control and girdling treatments, respectively. Crosses represent repetitions of the measurements, and lines simulated citrate evolution. RMSE is the root mean squared error and RRMSE the relative RMSE.
Sensitivity analysis
The responses of the model to variations of parameters (k1, k3, k4,1, k4,2, qm, qg, Q10), temperature, and growth curve of dry mesocarp weight were very similar for different years. Because of this reason, only those obtained on Set I in 1996 and Set II-1 in 1996 will be shown hereafter.
Sensitivity to k1 rapidly increased during the first 10 d and then was close to being constant (about 0.8) (Fig. 5). Cultivar, year, and assimilate supply had little influence on sensitivity to k1. Sensitivities to k4,1 and qg exhibited quite similar tendencies. They increased during the first 10 d, then decreased, and were higher for fruits with more assimilate supply. Sensitivities to k4,2 were positive and increased throughout fruit growth. They were more than ten times higher than those of the other parameters, which reflects the strong dependence of citrate concentration on k4,2. In the case of cv. Fidelia in 1995, increasing k4,2 by 0.01% can increase citrate concentration by up to about 0.57% (not shown). Fruits with a high assimilate supply were more sensitive to k4,2 than fruits with a low assimilate supply. Sensitivities to qm, and Q10 were smaller than those to other parameters (k1, k4,1, k4,2, and qg), and had similar variation independently of assimilate supply, year, and cultivar. They increased from 0 to 0.1 at the beginning of fruit growth, then decreased and finally ranged from –0.02 to –0.07 at maturity. The maximum and minimum daily mean temperatures for cvs Fidelia and Suncrest during all the measured growing seasons did not obviously differ, 16–27 °C for cv. Suncrest and 15–28 °C for cv. Fidelia, although seasonal variations in daily mean temperature were different (not shown). Sensitivity to temperature for cv. Suncrest was similar to that to qm and Q10. Sensitivity to temperature for cv. Fidelia was positive and increased to 0.4 with fruit growth. Conversely, for cv. Fidelia in 1996, sensitivity to k3, which is related to temperature, was negative and varied from 0 to –1.2.
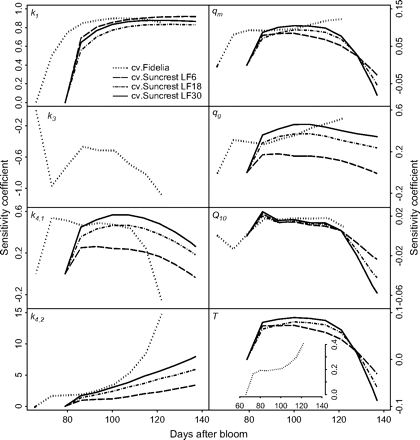
Sensitivity coefficients with respect to model parameters (k1, k3, k4,1, k4,2), the maintenance respiration coefficient at 20 °C (qm), the growth respiration coefficient (qg), the temperature ratio of maintenance respiration (Q10), and daily mean temperature (T). The analysis was performed using the data of cvs Fidelia and Suncrest during the 1996 season. The labels LF6, LF18, and LF30 indicate the leaf:fruit ratio. Coefficients were defined as the ratio between the relative variations of citrate concentration and the relative variation of parameters and temperature. Here they were estimated by computing the responses of citrate concentration to variations of ±0.01% in the parameters and temperature.
The effects of changes in dry mesocarp weight growth curve parameters were analysed, that is: maximum dry weight (DWmax), initial dry mesocarp weight at the first simulated date (DW0), maximum growth rate (Gmax) and the date when maximum growth rate was reached (Dmax) on citrate concentration (Fig. 6). Although the two cultivars showed the same general trends, their response to changes in fruit growth pattern was cultivar specific. While variations of DWmax had little effect of citrate accumulation in cv. Fidelia, increasing DWmax led to much smaller citrate concentrations during the last stages of fruit growth in Suncrest. Increasing DW0 led to smaller peak citrate concentrations during fruit development in both cvs Fidelia and Suncrest. At harvest there was no effect of citrate concentration in cv. Fidelia, while increasing DW0 led to higher concentrations in cv. Suncrest. The responses to changes in parameters Gmax and Dmax were similar for cvs Fidelia and Suncrest. At harvest, increasing Gmax resulted in faster growth leading to increased respiration and lower citrate concentration. Increasing Dmax resulted in delayed growth and respiration leading to higher citrate concentration at harvest for cv. Fidelia and for cv. Suncrest.
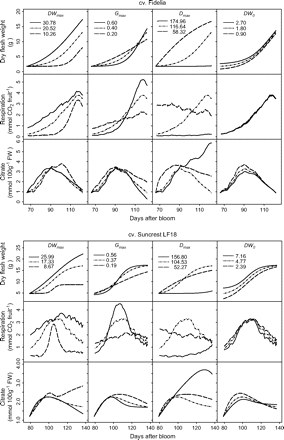
Effects of dry weight growth curve parameters DWmax, Gmax, Dmax, and DW0 on fruit respiration and citrate concentration. DWmax is maximum dry weight, Gmax is the maximum growth rate, Dmax is the time (in DAB) at which maximum growth rate occurs, and DW0 is dry weight at the beginning of simulation. The analysis was performed on the data of cv. Fidelia and the leaf:fruit ratio 18 (LF18) treatment of cv. Suncrest during the 1996 season.
Effects of metabolism and dilution on citrate concentration
Seasonal variations in metabolism and dilution (me and di in equations 12 and 13) were analysed (Fig. 7), and the relative importance of metabolism and dilution were compared (Fig. 8). The results from Set I and Set II-1 in 1996 are represented, since they are representative of the pattern of variation for different years. Metabolism of citrate generally decreased with fruit growth, but varied more for cv. Fidelia showing an increase in the middle of fruit growth. The effect of dilution followed a bell shape. The number of leaves did not show an obvious effect on citrate metabolism. At the beginning of fruit growth, the ability for dilution was different in fruits with more leaves and with fewer leaves, while near maturity the number of leaves had no marked effect. Figure 8 showed that the variation in citrate concentration at the beginning of fruit growth resulted mainly from citrate metabolism. Near maturity, dilution had a stronger effect on citrate concentration, although both metabolism and dilution decreased throughout fruit growth. Indeed, at maturity, the metabolism value could be negative, which means that the degradation of citrate was more than its synthesis.
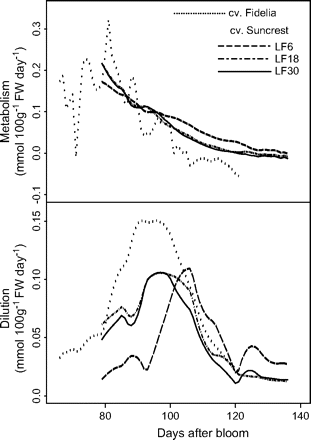
Simulated seasonal variations in the components of citrate concentration (equations 12 and 13). The components are citrate metabolism and dilution. The analysis was performed using the data of cvs Fidelia and Suncrest during the 1996 season. The labels LF6, LF18, and LF30 indicate the leaf:fruit ratio.
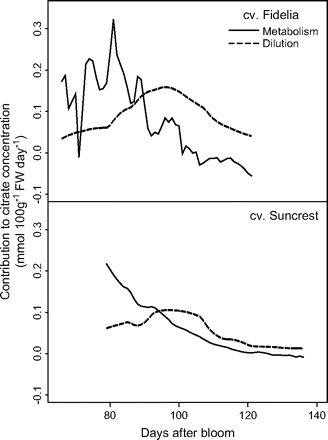
Simulated contributions of citrate metabolism and dilution to citrate concentration. The analysis was performed on the data of cv. Fidelia using equation 12 and cv. Suncrest using equation 13 during the 1996 season. For cv. Suncrest only results on the leaf:fruit ratio 18 (LF18) treatment are shown.
Discussion
It was attempted to improve the citrate model of Lobit et al. (2003) considering fruit development, respiration, and temperature as input variables. In the original model, the rate of citrate synthesis or degradation was the product of a ‘synthesis potential’ and an ‘efficiency level’, both independent from the developmental stage of the fruit. The new model includes the fact that the response of the ‘efficiency level’ to respiration may vary throughout fruit development, and represents this by a linear decrease of k4 with time (with parameters k4,1 and k4,2 representing the rate of decrease and the date when k4 becomes null). Besides embedding fruit development, the adjustment qualities of the new model in terms of RMSE and RRMSE are better than those of the original model. With the new model, there was a good agreement between predicted and observed citrate concentrations in two cultivars in different years, and the effects of assimilate supply on seasonal variations in citrate concentration was well predicted. In addition, for cv. Suncrest the new model has one less parameter than the original model. Therefore, the new model is significantly improved based on the original model of Lobit et al. (2003).
A comparison of the model parameters between cultivars and an examination of the model sensitivity to parameters highlighted differences that may concern metabolism.
Parameter k1 was 35% to 40% lower in cv. Suncrest than for cv. Fidelia, while its sensitivity coefficient was around 0.8 for the different cultivars, years and assimilate supply considered. Since this parameter accounts for the rate of dicarboxylate uptake by the mitochondria, it can be considered as an indicator of the mitochondrial activity per unit dry matter in the young fruit. Cv. Suncrest usually has a lower relative growth rate (0.004–0.043 g g−1 DW) than cv. Fidelia (0.02–0.07 g g−1 DW). It is not surprising that late-season cultivars, which grow more slowly than mid-season cultivars, may have lower mitochondrial activity and lower citrate synthesis potential.
Important parameters determining citrate concentration in peach fruit mesocarp are k4,1 and k4,2, since they account for the response of citrate metabolism to respiration. Particularly important is k4,2, as citrate concentration was most responsive to k4,2 among all parameters. k4,2 can be interpreted as the date where a turning point in citrate metabolism is reached: before this date, increasing respiration stimulates citrate synthesis, while after it stimulates citrate degradation. In this study, this date was soon after the peak of citrate concentration during fruit development and obviously later for the late-maturing cultivar (DAB 112 for cv. Suncrest) than for the mid-maturing cultivar (DAB 102 for cv. Fidelia). k4,1 was similar for both cultivars.
Sensitivity to temperature was analysed. For cv. Suncrest raising mean temperature during fruit development increased citrate concentration, but this increase did not persist until maturity. Near maturity fruit grown under elevated temperatures had lower citrate concentration. This sensitivity analysis was in agreement with the experimental results on citrus by Marsh et al. (1999), which indicated that raising temperature at the end of fruit development favoured the accumulation of sucrose rather than onward metabolism to organic acid. For cv. Fidelia raising mean temperature during fruit development increased citrate concentration much more strongly than for cv. Suncrest. The main reason was that for cv. Fidelia, a parameter k3 related to temperature was additionally included in the model (equation 5), compared with the model (equation 6) for cv. Suncrest. It is interesting to notice that sensitivity analysis to k3 indicated that increased k3 could decrease citrate concentration during fruit development.
Four parameters related to fruit respiration (qm, Q10, qg, and k4,1) were investigated. Variations in the growth respiration coefficient (qg) and in k4,1 had similar significant effects on citrate concentration. Generally, increasing qg, seemed to increase citrate concentration, while this effect diminished near maturity. By contrast, variations in the maintenance respiration coefficient at 20 °C (qm) and the temperature ratio of maintenance respiration (Q10) affected citrate metabolism very little. In addition, these two parameters appear not to vary between cultivars (DeJong et al., 1987; Pavel and DeJong, 1993), which make them bad candidates to explain differences of citrate metabolism between cultivars.
The relationships between citrate concentration, respiration, and fruit growth were analysed in a comprehensive manner by simulating different growth curves and corresponding respiration curves. In spite of the between-cultivar difference in respiration curves, these simulations suggested that, in general, at the beginning of fruit development an increase of the mesocarp dry weight increased both fruit respiration and citrate concentration, and near maturity increased fruit respiration but decreased citrate concentration. These simulated results were in agreement with the effects of assimilate supply as reported by Wu et al. (2002). How the opposite effects of fruit growth and respiration on citrate concentration was partitioned at k4,2 is worth further study.
An attempt was made to distinguish the effects of metabolism and dilution on citrate concentration in peach fruits via the citrate model. It was demonstrated that citrate concentration was mainly linked to its metabolism at the beginning of fruit growth. As the fruit grew, the dilution effect became more important than metabolism Near maturity both metabolism and dilution tended to decrease, and metabolism could be negative, which indicated citrate degradation. These results are in accordance with Sadka et al. (2000) studies on citrus fruit, in which the accumulation of citrate at the beginning of fruit development and its decline toward fruit maturity was also typical. Active catabolism occurred mostly after the citrate had peaked, which they attributed to an increase in NADP+-isocitrate dehydrogenase activity and gene expression. The model also shows degradation in citrate after citrate concentration has peaked.
As in the original model, this improved model does not represent individually the mechanisms involved in citrate metabolism. For example, it cannot be used to quantify the effect of a variation of the NADP+-isocitrate dehydrogenase activity. The model parameters only account for the combined effect of these mechanisms. For example, parameters k2 and k3 in both the original and the improved model account for the combined effect of different sensitivities to temperature of all transport and enzymatic reactions occurring in the mitochondria. Similarly, parameters k4,1 and k4,2 introduced in the new model account for variations of several enzymes and transport systems throughout fruit development. Even so, the model parameters are closely related to the properties of mitochondrial transport systems and enzymes, and differences in these parameters reflect changes in the underlying metabolic properties of the fruit. In the near future, we expect to describe the between-genotype variation of the parameters k1, k4,1, and k4,2 using a peach breeding population derived from a clone of a wild peach by three generations of crosses with commercial nectarine varieties (Wu et al., 2003, 2005).
From an ecophysiological point of view, it is interesting to understand if environmental conditions affect citrate concentration due to direct effects on metabolism or indirect effects like dilution. The model can be used to determine the relative contribution of metabolism and dilution, caused by change in fruit volume, on the variation of citrate concentration.
Finally, the pattern of citrate accumulation described in peaches is common to other fruit species, such as tomato (Knee and Finger, 1992) and citrus (Marsh et al., 1999). Therefore, the present model is likely to be applicable to a variety of species with only minor modifications. Combined with models for other organic acids, such as malate (Lobit et al., 2006), and models relating titratable acidity, pH, and composition in fruit mesocarp (Lobit et al., 2002), it would be a useful tool to study fruit acidity.
We gratefully acknowledge R Laurent and J Hostalery for their assistance in the field experiments, and D Dumont, E Rubio, M Reich, L Gomez, M Bonafous, and M Souty for their assistance in acid analyses.


Comments