


Abstract
Urban forests and parks are important for recreation and may serve as a natural corridor for commuters. The consequences of human-mediated disturbance in natural areas are documented for avian and mammalian species. Less is known about the consequences of human disturbance on reptile species, specifically snakes, residing in natural refuges within the urban matrix. Thus, we examined the spatial activity of copperheads (Agkistrodon contortrix) in regard to pedestrian trails within an urban forest. We used radio telemetry to track snakes during the active season and estimated distances moved in between relocations, distances to the nearest trail and home range size for individuals. We found sex and season, but not distance to the nearest trail, affected the distance snakes moved. In addition, we observed a weak, positive relationship between home range size and average distance to the trail. Sex, season and body condition did not explain snake distance to the trail, but individual patterns were variable for snakes compared to random locations generated from snake relocations. Our study indicates copperheads may be tolerant of low-level human disturbances found in an urban forest. Further work should be done to quantify levels of disturbance, such as trail use, and compare the behavior of reptiles across urban park types and locations.
Introduction
As urban areas expand in size and population (United Nations 2018), urban forests and parks become increasingly important for transportation and recreation. Compared to rural or peri-urban forests, urban parks and forests may host more walkers, runners, cyclists and domestic animals (Arnberger 2006). Such natural refuges managed for human recreation also provide wildlife with suitable habitat within the urban matrix (Dickman 1987; Mahan and O’Connell 2005; Alvey 2006). Pedestrian traffic and recreation in parks and public lands can impact the spatial ecology, foraging and breeding behavior of wildlife (van Riper III et al. 2013). In response to human-mediated disturbance, some avian species decrease occupancy, alter nest height, egg laying, nest attendance and persistence, consequently leading to decreased nest survival and success (Davis et al. 2010; Smith-Castro and Rodewald 2010; Spaul and Heath 2016). Some mammals can be more sensitive to disturbance at distances greater than what recreationists believe to be sufficient buffers (Taylor and Knight 2003; Blake et al. 2017). Resilient mammals potentially exhibit only short-term responses (Kays et al. 2017) or behave nocturnally in urban areas, avoiding direct human contact (Prange et al. 2003; Gehrt et al. 2009). Further, domestic animals such as dogs (Canis familiaris) can alter the mammal population density and habitat use (Lenth et al. 2008). As population dynamics are altered in human-disturbed areas, prey species may indirectly benefit from predator release, which may have potential impacts for management (Muhly et al. 2011).
Less is known about the effects of trail use in parks on reptile behavior. Reptiles play an important role in trophic systems, and certain species can be found within urban areas (Davis et al. 2012; Todd et al. 2017). Burger (2001) found Northern watersnakes (Nerodia sipedon) were more sensitive to pedestrians than Eastern gartersnakes (Thamnophis sirtalis) and exhibited a response based on distance from the path and to safe refuge, the number of observers, and temperature. Basking turtles may be more reactive to vehicular traffic than pedestrians or cyclists (Nyhof and Trulio 2015). Habitat modification on or along trails may indirectly modify behavior by changing basking site structure (Rudd and Bateman 2015; Pittfield and Burger 2017). Further, trails and their use may also modify rodent density, an important prey item for many snakes (Roche and Timberlake 1998; Lenth et al. 2008).
Given the paucity of data on snake disturbance in urban forests, we quantified how trails and paved pedestrian paths (hereafter trails) affect the spatial behavior of snakes. We conducted a longitudinal radio telemetry study on copperhead snakes (Agkistrodon contortrix) within a popular urban park. Copperheads are common throughout the eastern USA (Ernst 1992) and this urban forest (Davis et al. 2012), and relatively resilient to anthropogenic change compared to other venomous snakes (Levine et al. 2016). Copperhead bites are the second most commonly reported snakebite, following rattlesnakes, hence their presence in urban areas provides a potential human–wildlife conflict (Carter et al. 2014; Wasko and Bullard 2016). The goals of our study were to: 1, determine if there were differences in snake movement and home range based on the distance to trails; 2, evaluate if the distance to the nearest trail was driven by sex, morphological characteristics or season; and 3, determine if snakes are closer to or further from trails than would be expected at random.
Methods
Study site
We studied the trail use patterns of A.contortrix in Overton Park (Overton), Memphis, TN. Overton is a popular recreational area, containing a forest (57 ha), golf course, zoo, playgrounds, dog park, art gallery and art school within a 138-ha footprint. The old-growth mixed forest contains paved and unpaved trails used for foot and bicycle traffic (NLCD 2016; Wickham et al. 2017).
Field and surgical procedures
We captured copperheads opportunistically or with drift fences and funnel box traps beginning in April 2015. We transported all individuals to the Memphis Zoo veterinary hospital for morphological data collection and implantation of radio transmitters. After safely restraining the snakes in an acrylic tube, we implanted a passive-integrated transponder tag on the left side anterior to the cloaca, and used the last four numbers for individual identification. We determined sex by probing for the presence of hemipenes in males, and palpated females for ova. We photographed individuals with a standard for digital measurement of snout-vent length (±0.01 cm) using ImageJ (National Institutes of Health, Bethesda, MD), and recorded body mass on a digital scale (±0.01 g). To compare movement to morphology, we estimated body condition for each snake using the scaled mass index (SMI) following the methods of Peig and Green (2009, 2010).
The senior zoo veterinarian and staff surgically implanted radio transmitters (R1680 3.6g, Advanced Telemetry Systems, Isanti, MN) following methods adapted from Reinert and Cundall (1982). Transmitters comprised less than 5% of the body mass of selected adults, and we monitored subjects for 24 h post-implantation before release at their capture location. After one year of tracking, we surgically removed transmitters from all individuals we could locate and returned them to their final capture site.
Radio telemetry
From June 2015 to July 2018, we relocated subjects using radio telemetry twice per week during the active season (15 March–15 November; breeding seasons: April–May, August–September). We separated relocations by 3–4 days to reduce spatial autocorrelation (White and Garrott 1990) and minimize disturbance. The periodicity of our sampling was sufficient because herpetofauna use localized areas for extended periods (Row and Blouin-Demers 2006). At each relocation, we recorded geographic coordinates using a hand-held global positioning system (±5 m). If dense vegetation obstructed animal sighting, we triangulated coordinates to conserve the integrity of the park habitat and minimize animal disturbance.
Movement parameters
To determine the linear distance moved between relocations, we used the R package adehabitatLT (Calenge 2006). We estimated home range sizes using minimum convex polygons (MCP) with the R package adehabitatHR (Mohr 1947; Calenge 2006). Although MCP is a coarse home range estimator (White and Garrott 1990; Burgman and Fox 2003), it is easy to determine and widely reported across studies, allowing broader comparability. To determine if there were effects of pedestrian corridors on snake movement, we calculated the Euclidean distance from each relocation point to the nearest trail using the R package geosphere (Hijmans 2017). To determine whether snakes were located at nonrandom distances from trails and model individual snake variation in movement, we created 10 random distributions associated with each snake by rotating and shifting their trajectory randomly across the forest (adehabitatLT; Calenge 2006). Finally, we calculated the Euclidean distance to the nearest trail for all random locations in the simulated distributions (geosphere; Hijmans 2017).
Statistical analyses
Prior to statistical analyses, we followed the data exploration protocol described in Zuur et al. (2010). We normalized distance to the trail, distance moved, home range size and SMI using natural logarithms. To determine our first two objectives, we took an information-theoretic approach (Burnham et al. 2011) and built candidate models using the predictor variables. The null models contained only an intercept for the fixed effect. In all linear mixed models, including null models, individuals represented the random effect, and we used an autoregressive correlation function to control for the temporal correlation between observations. We ranked the candidate models based on differences (Δi) in the corrected Akaike information criterion (AICc) compared to the best model, and we present only models that have Δi ≤ 2, which have substantial empirical support (Burnham and Anderson 2002). We calculated marginal and conditional coefficients of determination (R2) to assess model fit for the top models. Marginal and conditional R2 describe the proportion of variance explained by the fixed effects and the fixed and random effects, respectively (Nakagawa and Schielzeth 2013).
For our first objective, we used a linear mixed model to investigate the relationship between the distance moved between snake relocations as a function of sex, SMI, their interaction, season and distance to the trail (nlme Package in R; Pinheiro et al. 2017). We also used linear regression to determine the relationship between home range area and sex, SMI, their interaction and mean distance to the trail. We controlled for number of relocations in each model, as increasing sample size can increase home range estimations (White and Garrott 1990). For our second objective, we used a linear mixed model to characterize the effects of sex, SMI, their interaction and season on snake distance to the trail. We considered an effect significant if the 95% confidence interval of the coefficient estimate did not include 0.
To determine if snake relocations were closer to or further from trails than would be expected at random, we used a Kolmgorov–Smirnov (KS) test to compare the distance to the trail for snake versus random relocations. The KS test evaluates the null hypothesis that the two samples come from the same distribution by comparing the differences in the sample cumulative distribution functions (Peter 1989). We subsampled generated random points to ensure equal sample sizes between each individual and its corresponding random relocations. We performed an overall KS test to compare all snake versus random points, and individual tests on snakes versus the random locations created from their rotated and shifted trajectories. We determined statistical significance using Holm’s sequential Bonferroni adjustment for multiple comparisons (Holm 1979).
We verified model assumptions by plotting residuals versus fitted values and each covariate in the model and covariates not in the model. We assessed the residuals for dependency using autocorrelation functions. Statistical tests were two-tailed and accepted as significant at P ≤ 0.05. Statistical analyses were conducted using the R programming environment v. 3.3.3 (R Core Team 2017).
Results
We tracked 36 snakes twice a week for up to one year post transmitter implantation. The median number of active season relocations was 50 (range: 11–64). The distribution of average distance to trail per snake was highly skewed; hence the central tendencies vary for males and non-gravid females (Table 1). Our analysis suggested distance moved may be partially explained by sex and season, the only fixed effects common in all top models with Δi values <2 (Fig. 1 andTable 2). Males moved slightly more than non-gravid females in between relocations (estimate: 0.272, 95% CI: 0.028, 0.517). We did not find evidence for differences in distance moved between males and gravid females (estimate: 0.084, 95% CI: −0.232, 0.400), or gravid and non-gravid females (estimate: 0.189, 95% CI: −0.151, 0.528). Sample size could be a limitation for determining if there are differences between gravid females and other groups. The top model also suggested snakes moved less during the non-breeding season (estimate: −0.248, 95% CI: −0.139, −0.029). Sex, season and the random effect of individuals together accounted for 6.63% of the variance (conditional R2), with sex and season alone explaining a small portion of the distance moved (marginal R2 = 0.019). The top models had a cumulative probability of 0.595, suggesting sex and season are relevant factors determining distance moved despite their small effect.

Boxplots depicting distance moved in between relocations (natural logarithm m) by season and sex
Summary statistics for distance moved between relocations distance to the nearest trail for copperhead snakes
| Sex | N | Distance moved (m) | Distance to the trail (m) | ||
|---|---|---|---|---|---|
| Mean (SE) | Median | Mean (SE) | Median | ||
| Non-gravid females | 12 | 28.1 (2.9) | 27.4 | 32.2 (15.7) | 19.3 |
| Gravid females | 5 | 29.0 (1.4) | 30.1 | 14.8 (1.7) | 14.7 |
| Males | 19 | 35.5 (2.8) | 34.5 | 39.0 (11.2) | 14.4 |
Candidate models with Δi ≤ 2 when compared to top model
| Response variable | Predictor variables | AICc | Δi | AIC weight | Model likelihood |
|---|---|---|---|---|---|
| Distance moved | Sex, season | 4337.2 | 0.00 | 0.34 | 1.00 |
| Sex, season, SMI | 4339.1 | 1.87 | 0.13 | 0.39 | |
| Sex, season, distance to trail | 4339.2 | 1.97 | 0.13 | 0.37 | |
| Null (r. effects; temporal corr.)a | 4343.9 | 6.72 | 0.01 | 0.03 | |
| Home range area | Number of relocations, distance to trail | 78.8 | 0.00 | 0.32 | 1.00 |
| Null (number of relocations) | 80.6 | 1.82 | 0.13 | 0.40 | |
| Distance to the trail | Null (r. effects; temporal corr.)a | 3988.6 | 0.00 | 0.38 | 1.00 |
| Season | 3989.8 | 1.15 | 0.22 | 0.56 | |
| SMI | 3990.6 | 1.97 | 0.14 | 0.37 |
Null model accounts for random effects and temporal autocorrelation and shown for reference if Δi > 2.
After controlling for the number of relocations (estimate: 0.027, 95% CI: 0.011, 0.043), our analysis also suggested home range area may be weakly related to greater distance to the trail (estimate: 0.260, 95% CI: 0.003, 0.516; Fig. 2 andTable 2). The number of relocations and distance to the trail accounted for 24.7% of the variance in home range size. The second model only included the number of relocations and accounts for a high percent of the variability in home range area (R2 = 0.18).
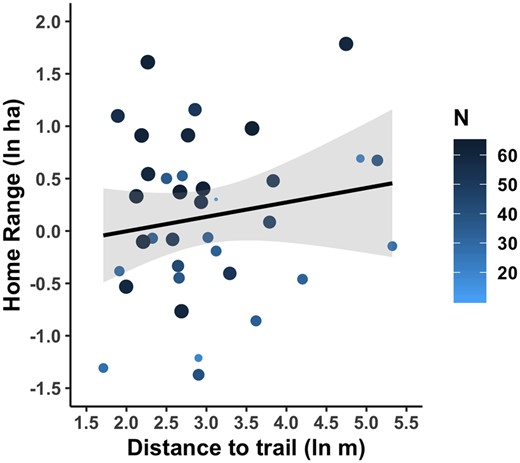
Home range as a function of distance to trail and number of locations. Line represents linear model with 95% confidence intervals. Points depict individual copperhead, and size of point is positively related to number of relocations (N). Adjusted R2 = 0.247
Distance to the trail was not related to sex, SMI or season in any of the possible models (Table 2). The model with the highest probability given the data was the null model, including only the random effect of individuals and temporal correlation (AIC weight = 0.38). The random effect of individual accounted for 54.9% of the variability in distance to the trail, indicating individual variation is an important factor determining distance to the trail.
The distance from the trail for snake and random relocations were 30.0 ± 1.18 SE (median: 14.6) and 23.6 ± 0.21 (15.3) m, respectively. Results of a KS test indicated the distributions for snake versus random relocations were not identical (D = 0.06, P < 0.05). Seventeen of 36 snakes exhibited significantly different distributions compared to their randomized points (Supplementary Table 1, Fig. 3), suggesting the differences in direction and distribution are individually driven.
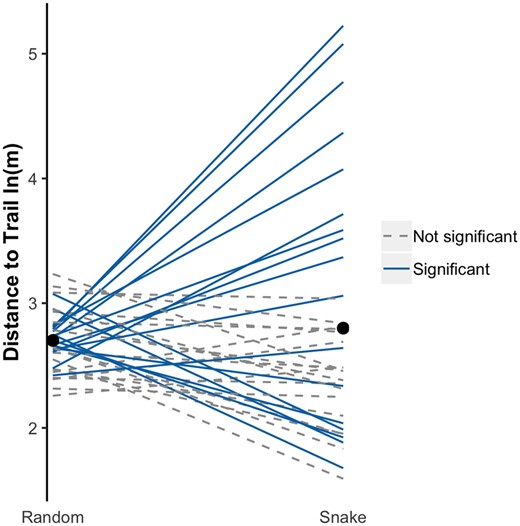
Interaction plot of average distance to the trail for snakes and random locations generated from their rotated/shifted trajectory. Each line represents one individual. Solid lines represent individuals who had a significantly different distribution compared to their random locations based on the KS test. Dashed black lines represent individuals with no significant difference between random and snake distributions. Black points denote mean distance for all random points and all snake relocation points. Units in natural log meters
Discussion
Urban parks and forests are important refuges for a variety of fauna, but there can be negative consequences of human-mediated disturbance in these areas. Due to their cryptic nature, less is known about the effects of human recreation on reptiles, and snakes in particular, compared to avian and mammalian species. Our study sought to provide insight into the influences of pedestrian trails on the spatial behavior of a common venomous snake species within an urban forest. We found movement between relocations was potentially explained by sex and season, with non-gravid females moving less than males, and a general decrease in movement during the non-breeding season. Movement was not explained by how far the individual was from a trail or by snake body condition (SMI). We also found home range area was weakly, positively related to distance to the trail after controlling for number of relocations. Distance to the nearest trail was not related to sex, season or SMI, but differences were highly individual and, in some cases, not random.
Previous work has shown copperheads and other pit vipers (Crotalinae) move more during the breeding season, and males move more than females (Moore and Gillingham 2006; Smith et al. 2009; Mata-Silva et al. 2018). Surprisingly, distance to the nearest trail did not affect movement, although we did find some evidence of larger home ranges for snakes further from the trail. Lomas et al. (2019) also found Northern Pacific rattlesnakes (Crotalus o. oreganus) living in more disturbed habitats had smaller home ranges, but their distance movement patterns did not differ from conspecifics in undisturbed areas. Similarly, logging activities also did not influence behavior or movement of timber rattlesnakes (C.horridus) compared to before or after disturbance (Reinert et al. 2011). On the other hand, Parent and Weatherhead (2000) found Eastern massasauga rattlesnakes (Sistrurus catenatus) decreased movement with increasing human exposure. Others have also found differences in alternative movement parameters in disturbed pit vipers (Beale et al. 2016; Martin et al. 2017). Limitations contrasting these studies are inherent differences in the way disturbance is quantified (i.e. overall rating, categories of disturbance, trail distance) and nature and locale of study sites, making direct comparisons difficult. It is likely that behaviors will differ by sensitivity of the species and amount and quality of the disturbance at the location (Ficetola et al. 2007).
In general, snakes were further from trails than random relocations, but individual patterns were complex (Fig. 3). Some animals were closer to and others further from trails than their randomly generated points. We did not find relationships between distance to the trail and body condition, season or sex (Table 2). Further research is warranted to explain what drives individual differences. Many of the snakes further from trails than random were in parts of Overton Park that have fewer trails than conspecifics closer to trails (Fig. 4). Hence, some copperheads have more trails within their home range compared to others. We cannot say if home range placement drives individual variation in tolerance or if individual variation drives home range placement, because we do not know the movement patterns for copperheads across their lifespan. Snakes born in areas with more trails may stay nearby and have smaller home ranges than those born further from trails. Alternatively, snakes that are more tolerant to disturbance may have moved to or stayed in areas that have more trails, and those that are less tolerant may have moved to areas with fewer trails.
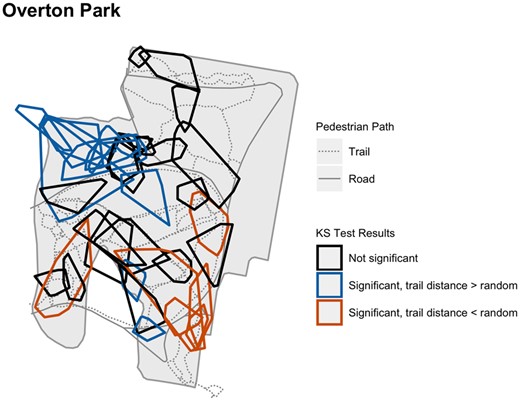
Map of Overton Park showing pedestrian trails and home range hulls for all tracked snakes by KS test results. Individuals whose distance to trail was not different than their random trajectories are denoted as black polygons. Individuals whose distance to trail was significantly greater than their random trajectories are denoted as blue polygons. Similarly, orange polygons denote individuals for which distance was smaller than random
Overall, our results indicate copperheads within Overton Park did not alter movement based on the distance to the trails, and suggest this population is resilient and presumably adapted to low-level human disturbance. Owen et al. (2014) determined copperheads on roads exhibit a reduced stress response compared to those found within the forest interior, indicating either snakes near the stressful environments acclimated or only tolerant individuals remain in disturbed areas. Bailey et al. (2009) found no difference in the corticosterone stress response of the congener cottonmouth snakes (Agkistrodon piscivorus) to low-level disturbance (human presence) from the control treatment. If they are not physically apprehended or threatened, copperheads are generally docile when detected, remaining motionless and relying on camouflage as a defense (Ernst 1992). Crypsis makes them likely to remain undetected by casual hikers, and minimizes negative encounters. Prior and Weatherhead (1994) found massasaugas in a national park did not rattle in over 60% of disturbance trials meant to mimic encounters between snakes and park visitors, and the behaviors were consistent over repeated trials. The authors suggest the cryptic behavior displayed by slow-moving species such as the massasauga rattlesnakes and copperheads is less risky than active defense. Taken together, the instinctive behavior of copperheads allows them to avoid detection and persecution, and tolerate trail disturbance conditions such as those experienced in Overton.
Future research should consider the effects of recreation in urban parks on other species of snakes. Our study was limited to a single species in one urban park. Different snake species, and reptiles in general, have distinct behavior and tolerance to disturbance, and it is likely they will have varying responses in similar situations (Burger 2001). Hence, studying different reptile species within the same park is important in describing the effects of disturbance in a general sense. Researchers should carefully describe the nature of the park, as the degree of disturbance will likely vary, and doing so will provide greater opportunity for comparing results between studies (Moll et al. 2019). Ensuing studies may standardize average trail distance per animal by the percent cover of trails within the home range, potentially using detailed measurements of trail width. In respect to natural substrate trails, width is positively correlated with use (Wimpey and Marion 2010), which would allow researchers to quantify distance to the trail and foot traffic as covariates of potential disturbance. As population densities increase and urban parks become busier, both humans and animals may have to adapt their behaviors to maintain areas that both sustain local fauna and provide recreational opportunities for residents. Greater understanding of the effects of human disturbance and trail use will allow land managers to meet those goals (Burger 2001; Taylor and Knight 2003).
Acknowledgements
The authors wish to acknowledge the field assistance provided by Chris Baker; the Memphis Zoo herpetarium staff; undergraduate assistants from the University of Memphis, Rhodes College, and Christian Brothers University; and Jeremy Harris. We also thank Dr Felicia Knightley and the Memphis Zoo veterinary staff for conducting all surgeries. We are grateful to Overton Park Conservancy for their cooperation throughout this research. We thank one anonymous reviewer and Michael Dreslik for their constructive comments that improved this manuscript. Research was conducted under the Tennessee Wildlife Resources Agency Permit 3852 and Memphis Zoo Institutional Animal Care and Use Committee 15201.
Funding
This work was supported by a grant from the Memphis Zoological Society Conservation Action Network awarded to S.R. and M.F.C.-H., and National Science Foundation Graduate Research Fellowship to M.F.C.-H.
Data availability
All data analyzed for this study are available through the Movebank Repository available at: https://doi.org/10.5441/001/1.3v106n1n.
Conflict of interest statement. None declared.
References
R Core Team. (
United Nations, Department of Economic and Social Affairs, Population Division. (
