


Abstract
In this paper, we address gender differences in the host language proficiency of humanitarian migrants. Prior research has produced inconclusive results with regard to women’s host language proficiency relative to that of men: sometimes women’s proficiency exceeds that of men, sometimes women lag behind men, and sometimes there are no substantial differences. Using data on recent humanitarian migrants in Germany, we investigate factors contributing to similarities and differences in men’s and women’s language proficiency. We consider gender differences with respect to the family-related factors: marital status, children’s ages and children’s childcare situations are important for women but not for men. These findings point to the continued relevance of a gendered division of work. It also becomes clear that gendered role expectations are particularly consequential for mothers and wives. Moreover, we find evidence that women are more efficient learners than men are, while they have fewer learning opportunities than men.
Introduction
Language proficiency is critical for immigrants’ economic and social adjustment in host countries. Economically, it is essential for labor market opportunities, including labor market participation, employment stability and income. Socially, it affects, among other things, education, health and access to health care, and making majority friends (van Tubergen and Kalmijn 2005; Pottie et al. 2008; Raijman 2013; Schaeffer and Bukenya 2014; Delaporte and Piracha 2018; Brücker et al. 2019; Spörlein and Kristen 2019). Language is also the medium of everyday communication and participation in host societies, their discourses and their political arenas (Esser 2006). Furthermore, language use and ways of speaking not only signal shared identities but also mark differences and foreignness that might be used to establish symbolic boundaries between groups. Thus, language proficiency relates to majority–minority relations in host countries (Espenshade and Fu 1997; Mesch 2003; Wimmer 2008).
Numerous studies have taken immigrants’ language proficiency as the object of study (Beenstock 1996; Espinosa and Massey 1997; Chiswick and Miller 1998; Dustmann 1999; Braun 2010; Geurts and Lubbers 2017). Despite the vast amount of literature, we have rather fragmented knowledge and understanding of the extent of, contexts of and processes contributing to gender differences in language proficiency. Only a few studies have addressed gender issues as the main object of study and modeling (Oxford et al. 1988; Boyd 1992; Ennser-Kananen and Pettitt 2017; Adamuti-Trache et al. 2018). Most studies, by contrast, have paid scant attention to women’s language proficiency, and if they have focused on this issue, their results have been ambiguous. While many authors have found negative effects for women on language proficiency (Espenshade and Fu 1997; Hou and Beiser 2006), others have discovered no significant disparities between men’s and women’s proficiency (Chiswick et al. 2004) or have found evidence for female advantages (Oxford et al. 1988; Kristen et al. 2016). Researchers have cited women’s lower levels of labor market attachments (Chiswick et al. 2006), their roles within the family (Chiswick et al. 2005), and differences in learning efficiency (van der Slik et al. 2015) as driving factors behind these outcomes. However, it is still largely unclear how labor market attachments and women’s roles within the family interact, which family-related factors are particularly conducive or harmful, and what is the relevance of gender differences in learning efficiency.
The purpose of this research is to improve our understanding of gender differences in language proficiency for the group of humanitarian migrants (or: refugees). To do so, we build on a mechanism-based model that identifies language exposure, learning incentives and learning efficiency as key determinants of refugee’s language proficiency (e.g. Chiswick et al. 2006). In a first step, we apply the mechanism-based model to refugees. We use new variables to capture the special situation of this group of immigrants, such as information on traumatic experiences and mental health. In a second step, we formulate gender-specific hypotheses on the differential effects of caring responsibilities for children of different age and childcare arrangements, marital status, and language learning efficiency issues. The analysis draws on a representative survey on recent humanitarian immigrants in Germany. Taken together, our study advances knowledge about if, how and why female refugees’ language proficiency differs from men’s.
Theory and Hypotheses
The mechanism-based approach is one way of conceptualizing second language learning, which is particularly influential in quantitative studies on the subject matter. It highlights three mechanisms as driving forces of language proficiency: language exposure, learning incentives and learning efficiency (van Tubergen and Kalmijn 2005; Chiswick et al. 2006; Esser 2006; Braun 2010). In reference to the exposure mechanism, it is held that the greater immigrants’ exposure to the host language, the better their language skills will be.
Regarding the incentive mechanisms, it is postulated that the greater the incentive for immigrants to invest in learning the new language, the better their language skills will be. Language proficiency is seen as a form of human capital, and investments in language proficiency are seen as driven by potential returns on investment (Braun 2010). For example, people with high levels of education prior to migration will invest more in their language proficiency because they expect considerably higher earnings from an adequate job than if they were less educated. This understanding of ‘investments’ in second language learning differs from Norton’s (1995) investment concept, which points to learners’ complex embeddings in different contexts via multiple contested identities (Norton 1997; Menard-Warwick 2004).
Finally, concerning the learning efficiency mechanism, it is believed that the more efficient immigrants are in learning the new language, the better they will speak that language given a certain amount of exposure (Chiswick et al. 2004: 614). Learning efficiency depends on a cognitive component—the ‘talent’ to acquire languages—and on individual learning strategies (van der Slik et al. 2015; Oxford et al. 1988).
Numerous studies support the assumptions derived from the above mechanisms. In line with the notion of exposure, it has been found that language proficiency is positively correlated with premigration knowledge of the host language, duration of the stay in the host country, and intensity of exposure after migration (Chiswick et al. 2004: 616). Dominant language proficiency of the spouse (Espenshade and Fu 1997: 296) and familial migration and living arrangements are among the key parameters of the latter (Chiswick et al. 2005). Similarly, researchers have studied the effects of economic incentives on language acquisition and found that higher levels of education prior to migration (Adamuti-Trache 2013; Kristen et al. 2016), economic migration motives or visa category (Chiswick and Miller 2001; van Tubergen and Kalmijn 2005) and permanent settlement intentions (Dustmann 1999; Wachter and Fleischmann 2018) are associated with higher levels of language proficiency. Finally, learning efficiency is higher for younger migrants (Stevens 1999), migrants who face a smaller linguistic distance (van Tubergen and Kalmijn 2005), immigrants who participate and complete language courses and who start language courses earlier (Hoehne and Michalowski 2016). The extant research also suggests that the mechanisms of language proficiency are robust across time, countries of origin and destination, and group of immigrants (Evans 1986; Espinosa and Massey 1997; Fennelly and Palasz 2003; van Tubergen and Kalmijn 2005).
The findings are less unambiguous or even controversial (Espenshade and Fu 1997: 290) in regard to gender differences in language acquisitions and the factors driving them. Some studies have found no relevant differences between men and women. Based on a longitudinal survey on immigrants to Australia, Chiswick et al. (2004) observed no advantage when analyzing the two groups separately and ascertained that all three mechanisms of the theoretical model worked for both groups. In their study on determinants of language proficiency of Mexicans in the US, Espinosa and Massey (Espinosa and Massey 1997) found a negative effect on language proficiency for women. However, the effect was not significant, which, as the authors argued, could have resulted from the small number of cases and large standard errors (ibid: 39).
Most researchers have observed gender differences. Several authors found that women had lower language proficiency than men (Espenshade and Fu 1997; Beiser and Hou 2000; Hou and Beiser 2006). This disadvantage resulted in part from lower levels of premigration education and from lower levels of postmigration language exposure. In Hou and Beiser’s (2006) longitudinal study on Asian refugees in Canada, women demonstrated lower rates of language acquisition over time (see also Chiswick et al. 2006). A possible explanation was the ‘relative lack of postimmigration opportunities and incentives’ (Beiser and Hou 2000: 319) to acquire the host language resulting from a lower labor supply and fewer labor market attachments among women (Chiswick et al. 2006: 439).
Another explanation for women’s disadvantage is related to women’s role within the family. Chiswick et al. (2005) highlighted the importance of one’s position within the migratory unit. Principal applicant immigrants (disproportionally men) outperformed their accompanying spouses (disproportionally women) in terms of language proficiency. Ethnographic research explains men’s linguistic advantage by power imbalances within the household: Second language proficiency is symbolically loaded so that men—unsettled by migration and status loss—feel threatened when their wives acquire (too much) fluency in second languages and control their access to learning possibilities (Rockhill 1987; Gordon 2009). Likewise, children had divergent effects on gender. While children in the household had a negative effect on their mothers’ language proficiency, they had no effect on their fathers’ proficiency (Chiswick et al. 2006: 639). Both explanations for women’s lower levels of language proficiency (lower labor supply and their positions within the family) underline the relevance of a gender-specific division of work that locates women in the private sphere of the family, housework and care (Lopata 1993; Davis and Greenstein 2009).
Other studies have also found gender differences but with women having an advantage over men. Kristen et al. (2016) expected women to be more proficient due to better learning strategies, and they substantiated their assumptions with data on Poles and Turks in Germany and the Netherlands. There is evidence that women are more effective learners and use a greater variety of learning strategies that involve social contacts (Oxford et al. 1988; Braun 2010). With reference to linguistic research, some authors hold that women are more responsive to their social environments and that this responsiveness interacts with cognitive advantages in learning languages (van der Slik et al. 2015; Budria and Swedberg 2019; Fennelly and Palasz 2003).
Notably, studies on women’s language proficiency have focused on different aspects that work in opposite directions. On the one hand, the gendered division of work (and educational disadvantages prior to migration) and controlling husbands work to the detriment of women’s relative language performance via exposure and incentive mechanisms; while on the other hand, learning strategies and cognitive advantages promote women’s language performance. Women’s overall relative performance depends on whether and how studies consider these factors and how they play out under different circumstances and for different groups of women (Carliner 2000; Fennelly and Palasz 2003).
Given that most research on gender differences in second language proficiency uses narrative or ethnographic methods and focuses on non-European English-speaking host countries (e.g. Losey 1995; Warriner 2004; Butcher and Townsend 2011), we still know little about the relative weight of factors hampering and promoting women’s language proficiency in an European context. In this study, we present a quantitative analytical strategy to investigate gender-specific similarities and differences in refugees’ German language proficiency. In the following, we formulate hypotheses on all humanitarian migrants (men and women), assuming that exposure, incentives, and learning efficiency determine language proficiency. We then formulate gender-specific hypotheses and design an analytical strategy to test the hypotheses.
Hypotheses on All Refugees
Language proficiency is positively associated with language exposure before migration, the extensity of exposure after migration, and the intensity of exposure after migration (Chiswick et al. 2004, hypothesis 1). We therefore expect that refugees are more proficient the more they have already acquired the host language in the country of origin, the longer they stay in the host country and the more they use the host language in their everyday communications, in particular with their cohabiting language-proficient partners.
The economic incentives to acquire the host language are strongest for those who are most motivated to work in the host country. Immigrants with higher levels of formal education have higher income potential and thus envisage higher returns on investments from learning the host language. Consequently, refugees with higher levels of formal education will do better than others (Beenstock 1996). Migration motives are another factor influencing incentives to acquire the host country language. People who migrate for economic reasons have more reasons to improve their language proficiency than people who migrate for family or political reasons (Chiswick et al. 2006). Irrespective of migration motives, immigrants who intend to stay permanently in the host country will invest more in the new language because their investments pay off for a longer period (Geurts and Lubbers 2017).
Overall, we assume that humanitarian immigrants are more proficient when they have more to gain from the investment of learning the host language due to having higher levels of education, stronger motivation to work, and longer intended durations of stay in the host country (hypothesis 2).
Learning efficiency is the third mechanism related to language proficiency. Learning efficiency decreases with the linguistic distance between the mother tongue and host country language (Chiswick and Miller 2004; Rebhun 2015: 307). The linguistic distance between Arabic—the predominant language among the refugees in our cohort—and German—the host country language—is large. The alphabet and the pronunciation are different, and there are hardly any words with common roots. These features make learning the host language difficult and reduce learning efficiency. However, for humanitarian migrants with prior knowledge of other Western European languages with a Latin alphabet (Scheible 2018: 3) such as English, the effective linguistic distance is smaller, and hence, they should be more efficient learners.
Another factor contributing to efficiency is good learning strategies. Prior research found that immigrants who participated in language courses were more proficient than non-participants (van Tubergen 2010). Moreover, there is evidence that language courses yield better results when they begin earlier after immigration (Hoehne and Michalowski 2016). However, language learning takes place not only in language courses but also in outside activities that prepare, complement, continue, and sometimes replace learning in class. We expect that language proficiency is higher when humanitarian migrants put in more learning effort and use a greater variety of learning materials, such as apps, TV, language CDs or the internet (Beiser and Hou 2000).
Psychological stress resulting from posttraumatic stress symptoms, anxiety, or depression may undermine learning processes, for example, by distracting attention, causing memory disruption, or reducing concentration (Salvo and de C Williams 2017: 735). Therefore, refugees who have mental health problems or suffer from psychological stress resulting from traumatic experiences could exhibit lower levels of language proficiency.
In sum, language proficiency should be higher when the effective linguistic distance is smaller, when learning strategies are better and when fewer psychological factors stand in the way of efficient learning (hypothesis 3).
Finally, age at migration is negatively associated with language proficiency resulting from negative effects of all three mechanisms (Espenshade and Fu 1997: 291). Researchers have argued that older persons are less susceptible than younger persons to learning new languages (learning efficiency mechanism, Stevens 1999). However, older persons also have fewer incentives to invest in a new language because income will flow for a shorter period (incentive mechanism). Last but not least, older people may be more exposed and probably more attached to the language and culture of the home country (exposure mechanism, Espenshade and Fu 1997).
Gender-Specific Hypotheses
While language exposure, learning incentives and learning efficiency should by and large affect male and female refugees in similar ways, there are predictable gender-specific effects. Our first set of gender-specific hypotheses starts from the gendered division of work according to which predominantly women deliver (unpaid) care work and housework for husbands and children (private sphere), and men provide income through remunerated employment (public sphere) (Shelton and John 1996; Davis and Greenstein 2009). According to this gender ideology (Menard-Warwick 2007), women are primarily responsible for raising children (Chiswick et al. 2005: 642), which is why their language proficiency is directly contingent upon their children’s ages and care arrangements (hypothesis 4). We expect a negative effect on women’s language proficiency if small children live in the household and are not taken care of in daycare facilities. The situation changes if small children join preschool childcare facilities such as kindergarten, which not only frees time and energy for mothers (Rida and Milton 2001: 45) but also creates opportunities for their language exposure, e.g. by becoming acquainted with parents of other children, attending parents’ evenings, or talking to childcare workers. Hence, there should be a positive correlation between children being in childcare and women’s language proficiency.
Likewise, children being in school should generate positive effects for women’s language proficiency, as it involves women’s exposure to the host language (Espinosa and Massey 1997). Children bring home homework, schools invite parents to school parties and parents’ evenings, and teachers consult parents on the development of their children. In addition, children usually learn the new language quicker than older persons which makes them potential interlocutors for using the new language (Mesch 2003: 46). Also children may open immigrants’ homes to influences of the host country (such as media) (Remennick 2004: 442). For men, who are less involved in childrearing than women according to traditional gender roles, we assume no effects of the children-related variables.
When investigating the effect of marital status on language proficiency, researchers have focused on the origin of the spouse or partner and the resulting propensity of using the host language, testing whether this influences language proficiency (Espenshade and Fu 1997; Kristen et al. 2016). We argue that marital status also interacts with gender. All other things being equal, we expect differential orientations by marital status. For women, being married reduces incentives to learn the host language. Marriage comes with motherhood- and childcare-related expectations, with unfavorable bargaining positions in household work negotiations among spouses, and with gender-specific ‘doings’ of gender (England and Folbre 2010). All these factors push married women toward the private sphere and thus lower their expected economic benefits from language learning. Hence, we assume that married women are less proficient in the host language than non-married women and men (hypothesis 5).
The second set of gender-specific hypotheses is based on the differences in the efficiency of and strategies for language learning between men and women. If women are more efficient language learners than men (van der Slik et al. 2015), they should profit more from participating in language courses and from additional hours of learning outside language courses (hypothesis 6) as well as from the use of multimodal learning materials such as TV, the internet, or apps (hypothesis 7).
Data and Method
Our database is the 2016 wave of the IAB-BAMF-SOEP Refugee Survey (Kroh et al. 2017), carried out by the German Institute for Employment Research (IAB), the German Federal Office for Migration and Refugees (BAMF) and the German Socio-Economic Panel (SOEP). The latter is an independent social science data base on processes of transformation and change in Germany. The Federal Office for Migration and Refugees (BAMF) provided the register data for the sampling. The Research Data Centre at the Institute for Employment Research (IAB) and the SOEP Survey Group at the German Institute for Economic Research offer data access via a scientific use file.
The IAB-BAMF-SOEP Refugee Survey contains data from approximately 4500 face-to-face interviews with adult refugees who arrived as asylum seekers in Germany between 2013 and 2016. It includes a household questionnaire and a personal questionnaire and it targets both adult partners. Respondents could choose between different languages (Arabic, English, Farsi, German, Kurmanji, Pashto and Urdu) and modes (oral or written) to meet their language or literacy needs. The Survey covers various topics, such as language skills, family structure, employment, education and health. The sample for the analyses comprises 4362 cases after excluding 167 cases due to missing data for German and English language proficiency, prior German language exposure, duration of stay in Germany, age, or education. We use ordered logistic regressions without survey weights to estimate effects on language proficiency. Our analytical procedure starts with the hypotheses on all refugees. We calculate different models for each of the three mechanisms before we estimate a full model that includes all mechanisms. In the second step, we address the gender-specific hypothesis estimating a model with interaction effects on gender and marital status and by estimating separate models for men and women including additional variables on children in the household.
Dependent Variable
Our dependent variable is self-assessed German language proficiency at the time of the interview (Figure 1). It results from a principal-component factor analysis with varimax rotation. The items used to measure the variable were self-assessments on writing, reading and speaking the German language on 5-point Likert scales. The factor scores for language proficiency are determined from weighted sums of the items using the score coefficient as the weight for each item. The factor analysis generates a reliable factor with a Cronbach’s alpha of 0.93 (Costello and Osborne 2005).
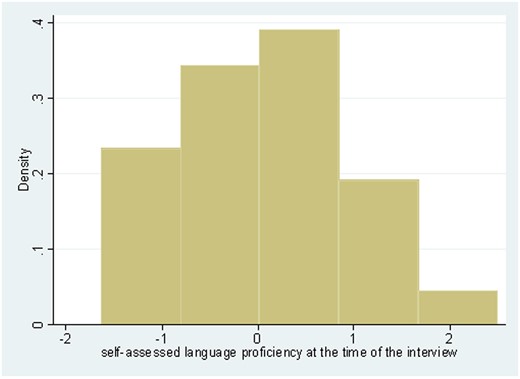
Histogram for the self-assessed German language proficiency factor at the time of the interview, Source: IAB-BAMF-SOEP survey of refugees, own calculations, n = 4362.
Variables for the Exposure Mechanism
We measure prior German language exposure by self-assessed language skills in speaking, reading and writing before migration. Based on principal-component factor analysis, the factor is highly reliable, with a Cronbach’s alpha of 0.95. Duration of stay in Germany approximates exposure to the German language after migration. We measure the time since the last migration to Germany up to the time of the interview in months. Duration of stay is additionally included as a squared term to model non-linear associations.
We include the household exposure context via variables on cohabiting partners and children. Having a partner who is proficient in German offers possibilities to use and improve one’s own proficiency. To measure partner’s German language proficiency we use a dummy to distinguish between those partners, whose factor of self-assessed language proficiency is in the top quartile of the distribution and the rest. The factor results from the principal-component factor analysis on speaking, reading and writing. The dummy missing in partner’s German language proficiency covers cases where there is no information on the partner’s language proficiency although there lives a partner in the same household. Another dummy indicates if there lives no partner in the same household.
For the separate models for men and women (Table 2), we include information on the number of children under 17 in the household as a term and as a squared term. Moreover, using four dummies, we look at the age and care situation of children living in the household. We consider schoolchildren, preschool children, preschool children in childcare facilities (such as kindergarten) and schoolchildren in childcare facilities (such as daycare centers).
Refugees’ German Language Proficiency, Ordered Logistic Regressions on Hypothesis on Mechanisms
| Exposure | Incentive | Learning | Full model | |||||
|---|---|---|---|---|---|---|---|---|
| coef | se | coef | se | coef | se | coef | se | |
| Exposure | ||||||||
| Prior German language exposure | 0.358*** | 0.042 | 0.355*** | 0.047 | ||||
| Duration of stay in months | 0.036*** | 0.003 | 0.092*** | 0.010 | ||||
| squared term: duration of stay in months | −0.000*** | 0.000 | −0.000*** | 0.000 | ||||
| Partner's German language proficiency | 0.944*** | 0.114 | 0.528*** | 0.112 | ||||
| Missing: no information on partner's language proficiency | 0.168* | 0.079 | 0.025 | 0.079 | ||||
| Missing: no partner in household | 0.206* | 0.104 | 0.180 | 0.102 | ||||
| Incentive | ||||||||
| Education (base: no formal education) | ||||||||
| Primary education | 0.122 | 0.085 | −0.001 | 0.087 | ||||
| Lower secondary education | 0.512*** | 0.095 | 0.231* | 0.096 | ||||
| Upper secondary education | 0.718*** | 0.107 | 0.178 | 0.107 | ||||
| Postsecondary non-tertiary education | 1.033*** | 0.176 | 0.530** | 0.174 | ||||
| Bachelor or equivalent | 1.130*** | 0.129 | 0.295* | 0.130 | ||||
| Doctorate or equivalent | 2.065*** | 0.277 | 0.967*** | 0.313 | ||||
| Years in school/university before migration | 0.132*** | 0.020 | 0.039* | 0.018 | ||||
| Squared term of years in school/university before migration | −0.003* | 0.001 | −0.002* | 0.001 | ||||
| Political migration | 0.061 | 0.089 | 0.049 | 0.093 | ||||
| Economic migration | 0.070 | 0.056 | 0.053 | 0.058 | ||||
| Family migration | −0.000 | 0.066 | 0.063 | 0.064 | ||||
| Intention to stay | −0.173 | 0.092 | −0.002 | 0.092 | ||||
| Learning | ||||||||
| English language proficiency | 0.848*** | 0.035 | 0.745*** | 0.040 | ||||
| Language course participation | 1.182*** | 0.072 | 0.578*** | 0.083 | ||||
| Months till first language course | 0.024*** | 0.003 | −0.050*** | 0.008 | ||||
| Squared term: months till first language course | −0.000*** | 0.000 | 0.000** | 0.000 | ||||
| Hours of daily study | 0.146*** | 0.013 | 0.189*** | 0.014 | ||||
| Multimodal learning | 0.961*** | 0.071 | 0.895*** | 0.072 | ||||
| Poor mental health | −0.204* | 0.093 | −0.188* | 0.094 | ||||
| Missing: poor mental health | −0.142 | 0.109 | −0.059 | 0.108 | ||||
| Shipwreck | −0.310*** | 0.095 | −0.171 | 0.097 | ||||
| Control variables | ||||||||
| Woman | −0.625*** | 0.059 | −0.608*** | 0.059 | −0.305*** | 0.059 | −0.297*** | 0.060 |
| Married | −0.471*** | 0.099 | −0.337*** | 0.079 | −0.246*** | 0.079 | −0.210* | 0.099 |
| Age at migration | −0.036* | 0.017 | −0.098*** | 0.017 | −0.083*** | 0.017 | −0.083*** | 0.017 |
| Squared term: age at migration | −0.000 | 0.000 | 0.001** | 0.000 | 0.001** | 0.000 | 0.001** | 0.000 |
| Children | ||||||||
| Number of children under 17 in the household | 0.101* | 0.050 | 0.177*** | 0.046 | 0.187*** | 0.046 | 0.150** | 0.051 |
| Squared term: number of children under 17 in household | −0.025*** | 0.008 | −0.025*** | 0.008 | −0.021** | 0.008 | −0.015 | 0.008 |
| Refugee status (base: recognized or subsidiary protection status) | ||||||||
| Waiting for a decision | −0.325*** | 0.067 | −0.416*** | 0.065 | −0.244*** | 0.067 | −0.132 | 0.069 |
| Rejected | −0.194 | 0.135 | −0.052 | 0.133 | 0.126 | 0.140 | 0.051 | 0.140 |
| Missing: refugee status | −0.162 | 0.131 | −0.037 | 0.140 | 0.362** | 0.134 | 0.237 | 0.133 |
| Country of origin (base: Syria) | ||||||||
| Iraq | −0.473*** | 0.090 | −0.222* | 0.091 | −0.203* | 0.088 | −0.148 | 0.091 |
| Afghanistan | −0.421*** | 0.091 | 0.172 | 0.093 | −0.079 | 0.090 | −0.153 | 0.097 |
| Other | −0.376*** | 0.082 | 0.158 | 0.084 | 0.013 | 0.088 | −0.217* | 0.091 |
| Religion (base: Islamic) | ||||||||
| Christian | −0.008 | 0.073 | 0.269*** | 0.075 | 0.250*** | 0.074 | 0.147 | 0.077 |
| Other or missing | 0.323*** | 0.088 | 0.305*** | 0.088 | 0.047 | 0.095 | −0.044 | 0.095 |
| Number of observations | 4362 | 4362 | 4362 | 4362 | ||||
| Pseudo r square | 0.042 | 0.053 | 0.102 | 0.122 | ||||
| Log-likelihood | −11839 | −11709 | −11097 | −10848 | ||||
Source: IAB-BAMF-SOEP Refugee Survey, wave 1, own calculations.
Note: stars for significance level.
: <0.001;
: <0.01;
: <0.05; coef: coefficients; se: robust standard errors.
Variables for the Incentive Mechanism
We use the International Standard Classification of Education (ISCED 2011) for the highest premigration educational level. To obtain a broader picture of investments in human capital prior to migration, we also consider the sum of years in school/university before migration and its squared term. We derive this information from a variable on the respondents’ premigration life courses (Goebel 2015). We capture migration motives with three dummies for political, economic and family migration (multiple answers possible). We code war, forced recruitment, and persecution as political migration. We assume economic migration if respondents claim to have migrated due to the economic situation in the host country or due to the economic or educational opportunities in Germany. The dummy for family migration takes a value of one if a respondent migrated with family members or has chosen Germany as destination to join family members. Another dummy indicates whether someone had the intention to stay permanently in Germany.
Variables for the Learning Efficiency Mechanism
Due to the smaller linguistic distance of English to German, premigration knowledge of English potentially enhances the learning efficiency of Arab native speakers. Again, the English language proficiency factor results from principal-component factor analysis of self-assessed language skills in English speaking, reading and writing at the time of the interview (Cronbach’s alpha 0.94). A dummy is used to indicate whether a person has started a German language course since his or her arrival in Germany. Given that the timing of the language course might be relevant, we also consider the time span between the arrival in Germany and the start of the first language course or—if the language course had not yet started—the month of the interview (in months). The models also contain the variable as a squared term. We measure the learning input by the hours of daily language study. We add an indicator for multimodal learning that incorporates the use of books, newspapers, radio, television, internet or other digital media for the purpose of language acquisition.
Because psychological stress may hamper the learning progress, we include a dummy for poor mental health that takes a value of one if the individual value is in the lower 10 per cent of the distribution of the mental health scale (Nübling et al. 2007). We control for missing values with a dummy. As some refugees suffer from traumatic events on their escape routes, we control for whether the respondent suffered shipwreck. For the gender-specific hypotheses, we also include the interaction of gender and marital status in the full model.
Control Variables
We include age at migration to Germany in years and its square term a control variable that all three mechanisms jointly determine. We compare Syrian nationals with Iraqi and Afghan nationals—as Syria, Iraq and Afghanistan are the three most important countries of origin—and with nationals from other countries of origin. Another set of dummies accounts for the refugee status. We distinguish between (1) recognized refugees and beneficiaries of subsidiary protection status (reference category), (2) people waiting for a decision or lodging an objection against a decision in an asylum procedure, (3) rejected applicants, and (4) those missing information on the refugee status. We control for religious affiliation with three categories: Islamic, Christian, and other or missing affiliations. In the integrated models on men and women, we include dummies on gender and marital status.
Table 1 reports descriptive statistics on all variables used and some additional information on our estimation sample. There are 38 per cent women in the sample, the mean age at migration was almost 32 years and the respondents live with 1.8 children under 16 years in a household.
Sample Description
| Women and men | Women | Men | ||||
|---|---|---|---|---|---|---|
| Mean/prop | Variance | Mean/prop | Variance | Mean/prop | Variance | |
| Self-assessed German language proficiency at interview | 0.01 | 1.00 | −0.22 | 0.99 | 0.15 | 0.96 |
| Woman | 0.38 | 0.24 | ||||
| Married | 0.66 | 0.23 | 0.77 | 0.18 | 0.59 | 0.24 |
| Age at migration | 31.92 | 108.97 | 32.48 | 103.23 | 31.57 | 112.24 |
| Prior German language exposure | 0.00 | 1.01 | −0.03 | 0.85 | 0.02 | 1.10 |
| Duration of stay in months | 23.24 | 456.99 | 23.62 | 528.29 | 23.00 | 413.10 |
| Partner's German language proficiency | 0.07 | 0.06 | 0.11 | 0.10 | 0.04 | 0.04 |
| Missing: no information on partner's language proficiency | 0.20 | 0.16 | 0.19 | 0.16 | 0.20 | 0.16 |
| Missing: no partner in household | 0.43 | 0.25 | 0.31 | 0.21 | 0.50 | 0.25 |
| Number of children under 17 in household | 1.80 | 2.98 | 2.26 | 2.65 | 1.51 | 2.97 |
| Schoolchildren | 0.52 | 0.25 | 0.65 | 0.23 | 0.44 | 0.25 |
| Preschool children | 0.40 | 0.24 | 0.51 | 0.25 | 0.34 | 0.22 |
| Preschool children in childcare facility | 0.25 | 0.19 | 0.31 | 0.22 | 0.21 | 0.16 |
| Schoolchildren in childcare facility | 0.31 | 0.21 | 0.40 | 0.24 | 0.26 | 0.19 |
| Years in school/university before migration | 3.34 | 13.48 | 3.02 | 11.79 | 3.54 | 14.42 |
| Political migration | 0.88 | 0.10 | 0.85 | 0.13 | 0.90 | 0.09 |
| Economic migration | 0.61 | 0.24 | 0.59 | 0.24 | 0.62 | 0.24 |
| Family migration | 0.27 | 0.20 | 0.34 | 0.22 | 0.23 | 0.18 |
| Intention to stay | 0.90 | 0.09 | 0.90 | 0.09 | 0.89 | 0.10 |
| English language proficiency | 0.01 | 1.01 | −0.11 | 0.97 | 0.09 | 1.01 |
| Language course participation | 0.65 | 0.23 | 0.54 | 0.25 | 0.72 | 0.20 |
| Months until first language course | 15.75 | 398.37 | 17.04 | 455.98 | 14.96 | 361.38 |
| Hours of daily study | 2.61 | 5.58 | 2.05 | 4.34 | 2.95 | 6.04 |
| Multimodal learning | 0.74 | 0.19 | 0.66 | 0.23 | 0.79 | 0.17 |
| Poor mental health | 0.09 | 0.08 | 0.11 | 0.10 | 0.08 | 0.07 |
| Missing: poor mental health | 0.09 | 0.08 | 0.09 | 0.08 | 0.08 | 0.08 |
| Shipwreck | 0.08 | 0.08 | 0.07 | 0.07 | 0.09 | 0.08 |
| Education | ||||||
| No formal education | 19.26 | 23.21 | 16.82 | |||
| Primary education | 25.03 | 24.89 | 25.12 | |||
| Lower secondary education | 18.52 | 17.44 | 19.19 | |||
| Upper secondary education | 17.51 | 16.66 | 18.04 | |||
| Postsecondary non-tertiary education | 2.36 | 1.86 | 2.67 | |||
| Bachelor or equivalent | 16.21 | 15.21 | 16.82 | |||
| Doctorate or equivalent | 1.10 | 0.72 | 1.33 | |||
| Refugee status | ||||||
| Recognized refugee or subsidiary protection status | 55.50 | 53.04 | 57.02 | |||
| Waiting for a decision | 33.24 | 33.37 | 33.16 | |||
| Rejected | 5.20 | 5.89 | 4.78 | |||
| Missing: refugee status | 6.05 | 7.70 | 5.04 | |||
| Country of origin | ||||||
| Syria | 49.89 | 48.53 | 50.72 | |||
| Iraq | 13.16 | 13.05 | 13.23 | |||
| Afghanistan | 12.27 | 12.39 | 12.19 | |||
| Other | 24.69 | 26.04 | 23.86 | |||
| Religion | ||||||
| Islamic | 65.77 | 63.86 | 66.95 | |||
| Christian | 14.49 | 16.06 | 13.52 | |||
| Other or missing | 19.74 | 20.08 | 19.53 | |||
| Additional descriptives | ||||||
| With children under 16 and no partner in household | 13.64 | 21.05 | 9.11 | |||
| Partner from the same country of origin in household | 35.58 | 47.02 | 28.53 | |||
| Partner from a different country of origin in household | 1.93 | 2.59 | 1.52 | |||
| Without any years in school or university before migration | 33.29 | 37.20 | 30.93 | |||
| Number of observations | 4362 | 1663 | 2699 | |||
Source: IAB-BAMF-SOEP Refugee Survey, wave 1, own calculations (prop: proportion).
Results
Hypotheses on All Refugees
Table 2 shows the results from five regression models on language proficiency. The measurements for exposure in the exposure model are all in line with the expectations of hypothesis 1. Humanitarian migrants are more proficient in the host language when they have more prior German language exposure and when they have stayed longer in the host country (Table 2). Moreover, language proficiency is significantly positively correlated with partners’ host language proficiency. This observation adds to studies that establish a link between partners’ language and respondents’ host language proficiency (Espenshade and Fu 1997: 300; Kristen et al. 2016: 201). Partners’ host language proficiency is important even if the host language is not their native language and if both partners can revert to a common native language. All exposure effects reappear in the full model that controls for learning and incentives mechanisms.
The findings are mixed for our hypothesis on incentives (hypothesis 2). The incentive model (Table 2) shows positive effects for formal education. Thus, humanitarian migrants master the host language better if they have achieved higher degrees of education and if they have more years of school attendance in the home country (see also van Tubergen and Kalmijn 2005, 2009). Our findings for migration motives and intentions to stay are not significant and thus are in contrast to our expectations and the findings in previous research (e.g. Chiswick et al. 2004). However, these observations may be related to our within-group comparison of refugees, who were by definition selected based on political migration motives. Furthermore, most refugees have little prospects of returning due to ongoing war and political unrest in major sending countries (see the final section for a detailed discussion).
Regarding the effects of learning efficiency (Table 2), the finding for the effective linguistic distance is in line with the expectation, indicating that premigration knowledge of English improves German language proficiency. Thus, the linguistic distance matters not only for distances between native languages and host languages but also for distances between second languages and host languages. In other words, if humanitarian migrants are familiar with a language that is similar to the host language, it is easier for them to learn the host language. This effect is not offset by inclinations to avoid learning the host language by reverting to English as a lingua franca (Beenstock 1996; Raijman 2013). As expected, refugees have better language proficiency when they participate in language courses and when these courses start earlier after their arrival in the host country. The findings on language course participation reinforce prior research on the relevance of language course participation (irrespective of completion) and language course timing (Beenstock 1996; Hoehne and Michalowski 2016; Brücker et al. 2019).
Learning strategies are another good predictor for mastery of the host language, both in the learning model and in the full model. Those with more hours of daily input and multimodal learning excel in comparison to others. These results are in line with findings on the positive effects of media use (Kristen et al. 2016: 201) and individual learning strategies via private host language tutoring (Beiser and Hou 2000: 320). We hypothesized negative effects of poor mental health and traumatic experiences since these variables could hamper processes of language acquisition. The results in Table 2 show the expected negative effects of poor mental health and shipwreck, but only the effect on shipwreck is significant in the learning model. As anticipated, the age effect is negative in all models, but weaker and only significant on a 5 per cent level in the exposure model. This suggests that German language exposure partially explains older learners’ language disadvantages.
It is important to note that host country residents play a role in refugees’ possibilities for language learning—a role that we do not model in this study. Recent humanitarian migrants report discrimination and difficulties in making friends with residents (Bernhard and Röhrer 2020; Bernhard 2021). Furthermore, there is evidence of stigmatizing discourses in German (mass media) publics (Holzberg et al. 2018; Sadeghi 2018). Discrimination and exclusion processes may not only prevent refugees from participating in public domains where the second language is spoken and thus prevent them from essential learning opportunities (Rockhill 1987). These processes may also affect refugees’ second language investments (Norton 1995).
Gender-Specific Findings
All integrated models on men and women in Table 2 show highly significant negative effects for women and married language learners. With our gender-specific hypothesis, we examine these effects more closely. Table 3 presents the calculations of the full model with gender-specific interaction effects and child-related variables for men and women and for both groups. Findings support the hypothesis on the interaction of gender and marriage (hypothesis 5). Married women are less proficient than unmarried men, while neither unmarried women or married men lag behind. We can now see that married women drive the negative effects for women and married persons shown in Table 2. Overall, these findings support the assumption that a traditional division of labor reduces married women’s incentives to acquire the language of their country of residence.
Refugees’ German Language Proficiency, Ordered Logistic Regressions on Gender-Specific Hypothesis
| Full model | ||||||
|---|---|---|---|---|---|---|
| Men and women | Men | Women | ||||
| coef | se | coef | se | coef | se | |
| Interactions | ||||||
| Unmarried man | ||||||
| Married man | −0.077 | 0.116 | −0.180 | 0.134 | ||
| Unmarried woman | −0.227 | 0.121 | ||||
| Married woman | −0.445*** | 0.116 | −0.025 | 0.163 | ||
| Exposure | ||||||
| Prior German language exposure | 0.355*** | 0.047 | 0.327*** | 0.054 | 0.437*** | 0.095 |
| Duration of stay in months | 0.090*** | 0.010 | 0.096*** | 0.008 | 0.094*** | 0.011 |
| Squared term: duration of stay in months | −0.000*** | 0.000 | −0.000*** | 0.000 | −0.000*** | 0.000 |
| Partner's German language proficiency | 0.529*** | 0.112 | 0.545*** | 0.159 | 0.669*** | 0.159 |
| Missing: no information on partner's language proficiency | 0.039 | 0.078 | −0.051 | 0.101 | 0.187 | 0.126 |
| Missing: no partner in household | 0.064 | 0.104 | −0.186 | 0.155 | 0.242 | 0.152 |
| Number of children under 17 in household | −0.067 | 0.077 | 0.036 | 0.114 | −0.137 | 0.113 |
| Squared term: number of children under 17 in household | 0.007 | 0.010 | −0.010 | 0.016 | 0.022 | 0.015 |
| Schoolchildren | 0.370*** | 0.111 | 0.223 | 0.151 | 0.465** | 0.174 |
| Preschool children | −0.319*** | 0.095 | −0.251 | 0.131 | −0.418** | 0.145 |
| Preschool children in childcare facility | 0.316*** | 0.081 | 0.172 | 0.111 | 0.479*** | 0.124 |
| Schoolchildren in childcare facility | 0.213** | 0.075 | 0.198 | 0.105 | 0.265* | 0.111 |
| Incentive | ||||||
| Education (base: no formal education) | ||||||
| Primary education | 0.003 | 0.087 | 0.134 | 0.116 | −0.124 | 0.138 |
| Lower secondary education | 0.249** | 0.096 | 0.284* | 0.125 | 0.268 | 0.160 |
| Upper secondary education | 0.182 | 0.107 | 0.248 | 0.137 | 0.105 | 0.184 |
| Postsecondary non-tertiary education | 0.547*** | 0.175 | 0.778*** | 0.214 | 0.324 | 0.312 |
| Bachelor or equivalent | 0.281* | 0.129 | 0.518*** | 0.165 | −0.057 | 0.217 |
| Doctorate or equivalent | 1.027*** | 0.315 | 1.521*** | 0.350 | 0.072 | 0.535 |
| Years in school/university before migration | 0.043* | 0.018 | 0.043 | 0.022 | 0.063 | 0.035 |
| Squared term of years in school/university before migration | −0.002* | 0.001 | −0.002 | 0.001 | −0.003 | 0.002 |
| Political migration | 0.060 | 0.092 | −0.042 | 0.124 | 0.244 | 0.143 |
| Economic migration | 0.039 | 0.058 | 0.086 | 0.074 | 0.003 | 0.095 |
| Family migration | 0.059 | 0.064 | 0.217* | 0.085 | −0.174 | 0.101 |
| Intention to stay | −0.003 | 0.093 | −0.034 | 0.114 | 0.096 | 0.162 |
| Learning | ||||||
| English language proficiency | 0.749*** | 0.040 | 0.736*** | 0.050 | 0.774*** | 0.072 |
| Language course participation | 0.554*** | 0.083 | 0.359*** | 0.105 | 0.594*** | 0.140 |
| Months till first language course | −0.049*** | 0.008 | −0.051*** | 0.007 | −0.059*** | 0.011 |
| Squared term: months till first language course | 0.000** | 0.000 | 0.000*** | 0.000 | 0.000*** | 0.000 |
| Hours of daily study | 0.185*** | 0.014 | 0.146*** | 0.016 | 0.293*** | 0.027 |
| Multimodal learning | 0.884*** | 0.072 | 0.881*** | 0.099 | 0.906*** | 0.108 |
| Poor mental health | −0.176 | 0.093 | −0.066 | 0.136 | −0.294* | 0.135 |
| Missing: poor mental health | −0.068 | 0.109 | −0.038 | 0.145 | −0.143 | 0.176 |
| Shipwreck | −0.186 | 0.099 | −0.107 | 0.121 | −0.389* | 0.182 |
| Control variables | ||||||
| Age at migration | −0.099*** | 0.017 | −0.101*** | 0.022 | −0.122*** | 0.031 |
| Squared term: age at migration | 0.001*** | 0.000 | 0.001* | 0.000 | 0.001** | 0.000 |
| Refugee status (base: recognized or subsidiary protection status) | ||||||
| Waiting for a decision | −0.129 | 0.070 | −0.225* | 0.091 | 0.025 | 0.114 |
| Rejected | 0.077 | 0.140 | −0.068 | 0.191 | 0.256 | 0.211 |
| Missing: refugee status | 0.242 | 0.133 | 0.158 | 0.181 | 0.412* | 0.203 |
| Country of origin (base: Syria) | ||||||
| Iraq | −0.167 | 0.091 | −0.170 | 0.115 | −0.161 | 0.154 |
| Afghanistan | −0.160 | 0.098 | −0.121 | 0.134 | −0.183 | 0.149 |
| Other | −0.221* | 0.091 | −0.232* | 0.115 | −0.202 | 0.153 |
| Religion (base: Islamic) | ||||||
| Christian | 0.151* | 0.076 | 0.127 | 0.100 | 0.183 | 0.123 |
| Other or missing | −0.010 | 0.095 | −0.121 | 0.123 | 0.132 | 0.149 |
| Number of observations | 4362 | 2699 | 1663 | |||
| Pseudo r square | 0.125 | 0.114 | 0.143 | |||
| Log-likelihood | −10816 | −6797 | −3921 | |||
Source: IAB-BAMF-SOEP Refugee Survey, wave 1, own calculations. Note: stars for significance level. *** : <0.001; ** : <0.01; * : <0.05; coef: coefficients; se: robust standard errors.
Starting from the gendered division of work, we developed a first set of hypotheses on the effects of child age, childcare arrangements and marital status. Table 3 displays the anticipated effects for households with small children (hypothesis 4). Women’s language proficiency deteriorates if preschool children live in the household but benefits from preschool children joining childcare facilities. For men, there are no significant effects for children irrespective of childcare arrangements. These findings support the assumption that caring for small children is a woman’s job for this group of respondents. The fact that language courses are not obligatory in Germany supports this traditional division of work (Brücker et al. 2019: 7). The findings show that only women are susceptible to the disadvantages and advantages that come with this responsibility.
Table 3 also exhibits a positive effect of having schoolchildren in the household for women, supporting our expectation that there is positive spillover from children’s’ institutionalized education (Espinosa and Massey 1997: 40). It also becomes clear that considered separately the number of children under 17 living in a household has no additional effect on parents’ language proficiency. Rather, the positive effect of children under 17 living in the household found in the models on mechanisms (Table 2) aggregates opposite effects of small children not in childcare and children in childcare and different effects of men and women. Overall, the distinctions between mothers and fathers, children’s age and childcare situation complement prior findings on the gender-specific effects of children that did not sufficiently differentiate children’s age and childcare attendance (Espenshade and Fu 1997: 296; Chiswick et al. 2005).
There are some unexpected gender differences with regard to formal education. The separate model for women shows no effects of education or years in school and university before migration. It follows that women with academic degrees or upper secondary education are no more proficient in German than women with no formal education. For men, the opposite holds true: both higher levels of formal education and additional years in educational or academic institutions increase their language proficiency. A reason for this gender difference could be that motives other than economic return on language learning drive women’s language proficiency, e.g. social motives (being a role model for children) or emancipatory motives (seizing opportunities to transcend traditional gender roles). This would support findings that investments in language learning (in Norton Peirce’s sense of the term) emanate from women’s multiple and potentially conflicting identities as—among other things—mothers, sisters, and independent women (Menard-Warwick 2009; Skilton-Sylvester 2002).
We now turn to the hypothesis based on gender differences in learning efficiency and strategies found in earlier research. We find strong support for the assumption that women profit more from participating in language courses and from additional hours of learning outside language courses (hypothesis 6). For both measurements, the effects are considerably stronger for women than for men. Participating in language courses furthers women’s ordered log-odds of language proficiency by 0.59 points on a rating scale from 1 to 5 while it boosts men’s ordered log-odds of language proficiency by 0.36 points. Each additional hour of daily learning increases women’s ordered log-odds of language proficiency by 0.29 and men’s ordered log-odds of language proficiency by 0.15. However, we do not find evidence for the assumption that women profit more from multimodal learning outside the classroom (hypothesis 7).
Discussion and Conclusion
Our study provides strong support for the relevance of the three mechanisms of language learning established in the literature. In general, greater exposure, higher incentives, and higher learning efficiency contribute to refugees’ language proficiency. The fact that the standard theoretical model on mechanisms and its empirical operationalization also applies to humanitarian migration from mostly Arabic-speaking countries to Germany in 2015 and 2016 provides further evidence that the model is robust across different host and sending country contexts as well as groups of migrants.
Nevertheless, there are group- and gender-related observations that deserve attention. Some of the results relate to the specificities of the group under investigation. While refugees react to exposure and efficiency factors as anticipated, qualifications need to be made for incentive arguments. Namely, we find no evidence that differences in migration motives matter for refugees’ language proficiency. This observation is a particularity of the group under investigation. By definition, refugees migrate for political reasons, and although migration motives may in fact be more diverse, the political situation of 2015 and 2016 clearly left little room for family or economic migration motives to make a difference. This is not surprising given that most refugees fled countries with ongoing war, political unrest and instability, such as Syria or Iraq. The uncertainty about whether and when one could return to the country of origin sheds light on the lack of significant effects for intentions to stay in Germany. Since refugees have no control over the timing and conditions of their return, the vast majority of 90 per cent prepares for a permanent stay in the host country (see Table 1).
The overall low levels of host language proficiency at the time of migration are another characteristic that relates to the particular challenges of the group under investigation. People had little time to plan the departure and prepare for life in the destination country prior to migration (Becker and Ferrara 2019). As a result, most refugees practically start learning the language from scratch. We find that premigration knowledge of English reduces the effective linguistic distance and thus bolsters German language proficiency. We also find evidence that women’s language learning is more susceptible to traumatic flight experiences and poor mental health. This is particularly worrisome since female refugees have a higher prevalence of psychological stress symptoms than men (Brücker et al. 2019: 4).
The factors contributing to language proficiency also vary with gender. Overall, family-related gender differences are remarkable: women’s language proficiency depends on children’s ages and whether children are in school and childcare. For men, children’s ages and care situations have no consequences. Likewise, in comparison to men women’s language proficiency is lower when they are married, while the language proficiency of married men does not differ from unmarried men. The negative effect of being a married woman persists even when controlling for various child-related variables and partners’ language proficiency. These observations testify to the relevance of the gendered division of work within families for humanitarian migrants’ language proficiency. However, previous research on women’s language learning points to the influence of power imbalances between men and women (Norton 1995) and in particular to the role of controlling husbands (Menard-Warwick 2004). Thus, it might be that husbands limit their wives’ opportunities to learn German thereby contributing to the observed effects.
The child-related variables are only pertinent to women, although it also has become clear that female refugees are not a homogenous group (Adamuti-Trache et al. 2018). Female refugees’ language proficiency hinges upon the roles they take: It develops differently when women are mothers or wives.
These findings add to existing research in several ways. First, they contribute to understanding the role of children in parental language proficiency. Theoretically, children may either hamper their parents’ language acquisition (e.g. when they absorb their parents’ time and energy) or facilitate it (e.g. when they create opportunities for language use) (Chiswick et al. 2005: 639). Our study indicates that the actual effect of children differs for fathers and mothers (Brücker et al. 2019: 6) and depends on children’s participation in (preschool) education. These observations contradict the assumptions that refugees’ children delay or even prevent their parents’ language acquisition by acting as translators and that parents’ attempts to pass on their native language to the next generation has a negative effect. Rather, institutionalized education spills over to mothers. There are several possibly complementary reasons for this phenomenon. Mothers may profit when their children become increasingly competent speakers of the host language and can act as teachers rather than translators (Beckhusen et al. 2013: 323). Educational institutions may create opportunities to use the new language, e.g. during parents’ evenings or school events. Finally, attendance at educational institutions may create venues where refugees become acquainted with German-speaking parents.
Second, our study points to the differential effects of being married for female and male humanitarian migrants. Although numerous studies have controlled for gender and marital status, researchers have rarely examined the interaction effects of the two variables (but see Chiswick et al. 2006). Marriage seems to trigger gender-specific expectations that reduce learning incentives and thereby are detrimental to women’s language proficiency. Again, it proves fruitful to take a closer look at differences among women, as unmarried women do not lag behind men. Due to relatively short durations of stay in the host country, the vast majority of their marriages dates to before immigration and is inner-ethnic (Table 1). Further research should investigate whether interaction effects change over time and when more women marry in the host country.
Finally, our findings point to the special disadvantages of women. On the one hand, some of the factors that prove detrimental to language proficiency are more common among female refugees. Women are, on average, older and more often married than men, have lower levels of German and English proficiency at the time of migration, and have less formal education (see Table 1). All these factors increase the burden of second language learning. On the other hand, with regard to factors that are potentially beneficial for women, we find that they participate less often in language courses, wait longer until courses start (Worbs and Baraulina 2017), and put in almost one-third less time in terms of daily learning hours (see Table 1). In this respect, their potential is not fully exploited. The situation of female refuges is aggravated when several of these factors come together and create cumulative disadvantages, for example, when married women with small children do not obtain a place in a language course (Beiser and Hou 2000: 326).
However, the study also identifies factors that could alleviate gender-specific disadvantages. Female refugees are comparatively efficient learners. They benefit more from additional hours of daily learning and from participating in language courses. Furthermore, childcare facilities make a difference. This finding presents a clear message for policymakers: to compensate for gender-specific disadvantages, they should invest in language courses for women that start soon after arrival, are readily available, and are practical with children.