


Abstract
Medulloblastomas are one of the most common malignant cancers of the central nervous system in children. Proton beam therapy (PBT) is expected to provide equivalent tumor control to photon therapy while reducing the various adverse events caused by irradiation. Few studies have considered the cost-effectiveness of PBT for pediatric medulloblastoma, considering the multiple adverse effects and reflecting on the latest treatment advancements. A cost-utility analysis of PBT for pediatric medulloblastoma was conducted in a Japanese setting and compared to conventional photon therapy. The analysis was conducted from the public healthcare payer’s perspective, and direct costs for the treatment of radiation therapy and radiation-induced adverse events were included. A Markov model was used, and the health states of secondary cancer, hypothyroidism and hearing loss were defined as adverse events. The time horizon was the lifetime. Incremental cost-effectiveness ratio (ICER) was used as a measurement of cost-effectiveness, with quality-adjusted life years (QALYs) used as an outcome. The costs were estimated from the national fee schedule, and the utility and transition probabilities were estimated from published literature. PBT incurred an additional 1387116 Japanese yen (JPY) and 1.56 QALYs to the comparator. The ICER was JPY 887053/QALY, indicating that PBT was cost-effective, based on the reference value of JPY 5 million/QALY used in the Japanese cost-effectiveness analysis. Deterministic sensitivity analysis showed that the ICER ranged from JPY 284782/QALY to JPY 1918603/QALY as a result of deterministic sensitivity analysis, and probabilistic sensitivity analysis showed that PBT was cost-effective, with a probability of 91.7%.
INTRODUCTION
Medulloblastoma is among the most common malignant cancers of the central nervous system, representing ~10% of all brain tumors in children under 15 years of age [1]. The age-specific incidence rate of medulloblastoma is above 0.4 and 1.5 per 100 000 population in children in age groups 0–9 and 10–19 in Japan, respectively [2]. Based on the 2021 brain tumor treatment guidelines available on the Japan Society for Neuro-Oncology website, the clinical risk classification of medulloblastoma, such as standard-risk and high-risk groups, is categorized based on prognostic factors such as the volume of postoperative residual tumor, histopathological classification, and the presence or absence of metastases [3–5]. Treatment outcomes for medulloblastoma have greatly improved by combining surgery, chemotherapy and radiotherapy. Survival rates for the standard- and high-risk groups are ~85% and 70%, respectively [6].
In radiation therapy, craniospinal irradiation (CSI) plays an essential role in providing long-term disease control based on the characteristics of medulloblastomas, which disseminate throughout the neuroaxis [7]. In particular, proton beam therapy (PBT) for CSI is becoming increasingly used for patients with medulloblastoma based on the dosimetric advantage of PBT compared with photon therapy. It is expected to provide equivalent tumor control while reducing the adverse events in normal tissue caused by irradiation [8]. Despite the promising clinical outcomes with PBT for CSI reported in prospective and retrospective studies, a direct comparison of disease control between PBT and photon therapy is lacking because a long follow-up period for the difference in the incidence of radiation-induced adverse events is not realistic.
The number of PBT facilities has significantly increased over the past decade; however, accessibility to PBT remains limited and expensive. Although PBT for CSI has a physical advantage in terms of dose distribution, the treatment and financial costs of PBT involved in the construction and operation of large-scale facilities are higher than those of photon therapy. In children, general anesthesia or sedation is required for CSI. Yoshimura et al. demonstrated the treatment process time for a real-time image-gated spot-scanning proton-beam therapy system; an additional process for general anesthesia or sedation was needed compared to the treatment of adult cancers [9, 10]. Because pediatric cancer is the most common indication for PBT in terms of adverse events, many countries with PBT facilities have their recommendations or public health insurance indications [11–13]. Kim et al. summarized the recommended or public health insurance-covered indications for charged-particle therapy in several countries, including the USA, UK, Netherlands, Japan and Korea [14]. In Japan, the treatment cost of PBT for pediatric patients has been covered by Japanese public medical insurance since 2016. Shen et al. evaluated the effects of race, socioeconomic status and clinical factors on the use of PBT for pediatric malignancies and demonstrated that socioeconomic factors affected the use of PBT in children [15]. Therefore, it is important to consider the cost-effectiveness of CSI using PBT.
In cost-effectiveness analysis, the incremental cost-effectiveness ratio (ICER) is generally used with quality-adjusted life years (QALYs) as an outcome index [16]. Previously, the cost-effectiveness of pediatric medulloblastoma using PBT in Japan has been reported. Hirano et al. focused on hearing loss (HL), and Yoshimura et al. focused on radiation-induced secondary cancers [17, 18]. In addition, Vega et al. demonstrated that PBT is a cost-effective strategy for the management of pediatric medulloblastoma compared to photon therapy [19, 20]. A similar cost-effectiveness analysis has been reported for pediatric medulloblastoma and also for other solid tumors, such as head and neck, breast and Hodgkin lymphoma [21–23]. Thus, cost-effectiveness analysis is a tool used to assist with decision-making.
Various adverse events induced by radiation therapy have occurred with many pediatric medulloblastoma survivors, for instance, cognitive deficits, growth hormone deficiency (GHD), ototoxicity or HL, hypothyroidism (HT), congestive heart failure, pulmonary disease, coronary artery disease, adrenocorticotropic hormone (ACTH) deficiency, gonadotropin deficiency, early puberty, premature ovarian failure and radiation-induced secondary cancers [24, 25]. In a previous cost-effectiveness analysis of multiple adverse events in PBT for pediatric medulloblastoma patients from Swedish and American social perspectives, Lundkvist et al. demonstrated that reductions in intelligence quotient and GHD contributed to the greatest part of the cost savings [26], and Vega et al. also demonstrated that PBT was associated with higher QALY and lower costs [19]. Although these reports are cost-effectiveness analyses of multiple adverse events in PBT for pediatric medulloblastoma patients, to the best of our knowledge, there are no published studies on the latest findings of PBT for pediatric medulloblastoma in Japan. In previous Japanese reports of the cost-effectiveness of PBT for pediatric medulloblastoma, on the other hand, the evaluation point was limited to such as HL or radiation induced secondary cancer [17, 18]. Thus, this study aims to propose a more clinically relevant assessment tool for the cost-effectiveness analysis of multiple adverse events in pediatric medulloblastoma using PBT from the current Japanese social perspective by expanding on our previous study.
MATERIALS AND METHODS
Subjects and setting
This study conducted a cost-utility analysis of PBT for pediatric medulloblastoma compared with conventional photon therapy. Based on the 2021 brain tumor treatment guidelines, both treatments of PBT and conventional photon therapy were assumed including surgery and chemotherapy as standard treatment [3]. The target population was standard- and high-risk pediatric patients with medulloblastoma who were 8 years old and treated in Japan. The time horizon was the lifetime. A cost-effectiveness analysis was conducted from the perspective of public healthcare payers. The analyzed costs were limited to the direct medical costs of initial radiotherapy for medulloblastoma, which included radiation-induced adverse event treatments [16]. Ototoxicity, HT and radiation-induced secondary cancers were included as adverse events. The outcome measure was ICER, which is the ratio of incremental costs to incremental outcomes between the two technologies. The outcomes used in this study were the QALYs. The ICER was evaluated as JPY 5 million per QALY, a reference value used in the Japanese cost-effectiveness evaluation of pharmaceuticals and medical devices [27]. The discount rate for costs and outcomes was 2.0% per year [16].
Model construction for cost-effectiveness analysis
A Markov model was used for analysis (Fig. 1). The Markov model is commonly used for cost-effectiveness analysis of long-term conditions [28–30] and is therefore suitable for this study. The Markov cycle is 1 year, and the health states of ‘no adverse event’, ‘ototoxicity’, ‘hypothyroidism’, ‘secondary cancer’, ‘secondary cancer (cured)’ and ‘death’ were defined. Secondary cancers may occur concurrently with ototoxicity and HT. In the model, the population consisted of standard- and high-risk patients with a proportion of 36:64 based on previous reports [6, 18]. The details of the parameters and transition probabilities used in this study are listed in Table 1.
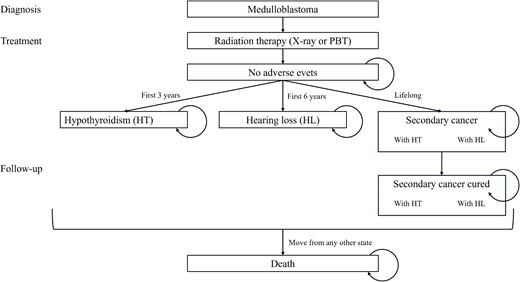
The Markov model diagram. PBT = proton beam therapy, HT = hypothyroidism, HL = hearing loss.
Details of model parameters in this study
| Parameter | Value at base case | Range | Distribution | Reference |
|---|---|---|---|---|
| Transition probability (%/year) | ||||
| To HL | ||||
| High risk | ||||
| PBT | 8.5% | ±20% | β(6.87, 7.71) | [17], assumption |
| Photon therapy | 14.5% | ±20% | β(0.37, 1.01) | [17], assumption |
| Standard-risk | ||||
| PBT | 5.1% | ±20% | β(2.26, 3.54) | [17], assumption |
| Photon therapy | 12.2% | ±20% | β(1.20, 6.53) | [17], assumption |
| To HT | ||||
| PBT | 0.094 | ±20% | β(1.81, 6.05) | [7], assumption |
| Photon therapy | 0.038 | ±20% | β(2.10, 5.14) | [7], assumption |
| To secondary cancer | ||||
| High risk | ||||
| PBT | 0.1% | ±20% | β(1.944, 1.656) | [18], assumption |
| Photon therapy | 0.7% | ±20% | β(0.729, 7.371) | [18], assumption |
| Standard-risk | ||||
| PBT | 0.09% | ±20% | β(0.58, 7.71) | [18], assumption |
| Photon therapy | 0.5% | ±20% | β(2.025 2.475) | [18], assumption |
| Death from secondary cancer (applied 5 years) | ||||
| Male | 7.3% | ±20% | β(1.41, 2.30) | [31], assumption |
| Female | 6.4% | ±20% | β(1.13, 2.29) | [31], assumption |
| Death from health states other than secondary cancer | General population | [32] | ||
| Death due to medulloblastoma (5-year survival rate) | ||||
| High risk | 70% | 55–85% | β(0.96,2.24) | [18] |
| Standard-risk | 85% | 75–95% | β(0.49,2.76) | [18] |
| Basic parameters | ||||
| Male: Female | 48.6: 51.2 | [32] | ||
| Proportion of high risk | 64% | 60–70% | Normal (0.64, 0.02) | [18] |
| Age (years old) | 8 | 3–14 | Normal (2, 8) | |
| Discount rate | 2%/year | 0–4%/year | [16] | |
| Utility | ||||
| Population in 10s | 0.97 | 0.84–1 | β(4.99, 0.14) | [33] |
| Population in 20s | 0.95 | 0.77–1 | β(4.48, 0.23) | [33] |
| Population in 30s | 0.95 | 0.75–1 | β(3.93, 0.21) | [33] |
| Population in 40s | 0.95 | 0.76–1 | β(4.77, 0.27) | [33] |
| Population in 50s | 0.93 | 0.71–1 | β(4.46, 0.35) | [33] |
| Population in 60s | 0.93 | 0.70–1 | β(3.99, 0.31) | [33] |
| Population in 70s | 0.88 | 0.57–1 | β(2.90, 0.39) | [33] |
| Population in 80s | 0.80 | 0.38–1 | β(2.08, 0.53) | [33] |
| Disutility by adverse events | ||||
| HL | −0.093 | −0.186 to −0.047 | β(0.93,9.09) | [33] |
| HT | −0.0224 | −0.0112 to −0.045 | β(1.38, 56.2) | [34] |
| Secondary cancer | −0.093 | −0.186 to −0.047 | β(0.93,9.09) | [33] |
| Costs (JPY) | ||||
| PBT | 2375000 | 1187500 to 4750000 | [35] | |
| Photon therapy | ||||
| High risk | 676700 | 338350–1353400 | [35] | |
| Standard-risk | 636800 | 318400–1273600 | [35] | |
| Treatments for adverse event | ||||
| HL (JPY/year) | 20460 | 10230–40920 | γ(16.0, 0.00074) | [35], assumption |
| HT (JPY/year) | 21418 | 10709–42835 | γ(16.0, 0.00078) | [35], assumption |
| Secondary cancer (JPY/patient) | 1280088 | 640044–2560175 | γ(18.2, 0.00001) | [34, 36] |
It was also assumed that transition to ‘death’ state could happen from any other health state, and different probabilities are set for death in the ‘secondary cancer’ state and the other states (i.e. general population) based on the cancer statistics [31]. In the ‘secondary cancer’ state, it was assumed that the transition to the ‘death’ state happened over 5 years according to 5-year survival rate using tunnel states based on the 22nd Life Table of Japan (FY2020) [32]. In the first 5 years, the transition to ‘death’ happened according to the 5-year survival rate for pediatric medulloblastoma for standard and high-risk patients, respectively [18].
The patients moved to the ‘hearing loss’, ‘hypothyroidism’ and ‘secondary cancer’ states over 3, 6 years and lifetime, respectively, and ‘hearing loss’ and ‘hypothyroidism’ lasted a lifetime [1, 7]. The transition probabilities to secondary cancer were calculated from a previous study using a mathematical projection model [22]. These probabilities were lower in PBT group because proton therapy lowered the risk of adverse events.
Costs
In this study, all costs were calculated in Japanese yen (JPY), using the national fee schedule (in Japan, all insured medical services have universal prices) [35]. We analyzed only the direct medical costs of the initial radiation therapy for pediatric patients with medulloblastoma and the treatment of radiation-induced adverse events. The costs of surgery and chemotherapy were excluded because they were common to both groups. The cost of initial radiation therapy in pediatric patients with medulloblastoma was calculated based on a previous study [18]. According to the latest national fee schedule, the medical costs of conventional photon therapy were JPY 683220 for the standard-risk group and JPY 726900 for the high-risk group. The medical cost of PBT was JPY 2375000 for both risk groups. The annual treatment costs for each radiation-induced adverse event are listed in Table 1.
The treatment cost for secondary cancers was set as the average medical fee for malignant neoplasms in Japan based on our previous report [18]. The cost associated with secondary cancers was JPY 1280088 per person, which was calculated from the number of patients [34] and total national medical expenditure for malignant neoplasms in financial year 2020 [36].
The annual cost of HT was JPY 21418 annually, calculated based on the price of thyroid hormone drugs and monthly outpatient visits. The treatment costs for HL included hearing tests and monthly outpatient visits. According to the current report of the Japan Hearing Instruments Manufacturers Association (JHIMA), the average price of hearing aids is 150000 JPY and the average time to replace hearing aids is 5 years [37, 38]. Thus, the annual cost of hearing aids was estimated to be 30000 JPY regardless of age. However, at present, the purchase of hearing aids is not covered by national insurance in Japan; therefore, the cost of purchasing hearing aids is excluded.
Utility
Utility values for the healthy population (i.e. the health states of ‘no adverse event’ and ‘secondary cancer (cured)’) by age groups were obtained from a previous study that measured population norm scores of Japanese general populations [33]. We assume that the utility value for the population under 16 years of age is the same as that between 16 and 19 years old. Similarly, the utility value for the population aged over 80 years was constant over the rest of the time horizon. The utility for the adverse events was assumed by subtracting the disutility values. For secondary cancer and HL, disutility values were obtained from a previous study targeting a Japanese population [33]. For HT, the disutility values were obtained from a previous study conducted in the USA [39]. When patients experienced two adverse events, the two disutility values were subtracted.
Sensitivity analysis
In this study, deterministic sensitivity analysis (DSA) and probabilistic sensitivity analysis (PSA) were conducted to evaluate the impact of uncertainty on model input parameters. A PSA was conducted using Monte Carlo simulations, in which a trial with all variables fluctuating simultaneously under the probability distributions was performed 1000 times. The ranges and distributions of each parameter in DSA and PSA (Nomal, β and γ) were shown in Table 1, respectively.
RESULTS
For the base case analysis, the cost was JPY 1258910 for photon therapy and JPY 2646026 for PBT; the QALY gained was 27.82 for photon therapy and 29.38 for PBT. Consequently, the ICER was JPY 887053/QALY. The DSA results are shown in Fig. 2. The ICER ranges from JPY 284782/QALY to JPY 1918603/QALY. The discount rate had the widest range of variability. The PSA results are shown in Fig. 3. PBT had a 91.7% probability of ICER lower than JPY 5 million/QALY, which was the reference value [26].
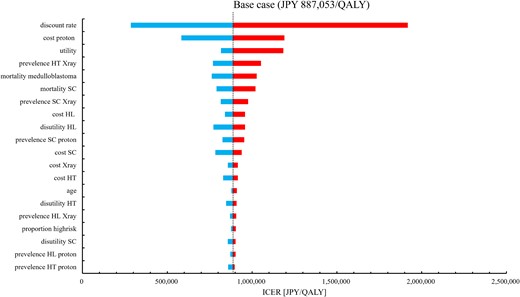
Tornado chart of DSA for ICER. DSA = deterministic sensitivity analysis, ICER = incremental cost-effectiveness ratio, QALY = quality-adjusted life-years, SC = secondary cancer, HT = hypothyroidism, HL = hearing loss.
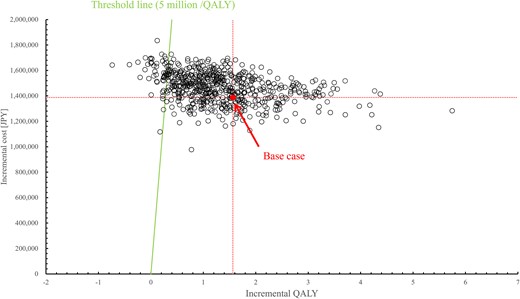
Scatter plots of PSA for ICER. PSA = probabilistic sensitivity analysis; ICER = incremental cost-effectiveness ratio, QALY = quality-adjusted life-years.
DISCUSSION
In this study, we demonstrated the cost-effectiveness of PBT for the treatment of pediatric medulloblastoma. As Fig. 3 shows, the ICER in our results was JPY 887053/QALY in the base case and JPY 284782/QALY to JPY 1918603/QALY in the DSA. The robustness of the base case results was demonstrated by DSA and PSA, as shown in Figs 2 and 3. These results indicate that PBT for pediatric medulloblastoma is cost-effective in the Japanese setting. The incremental cost was JPY 1387116, lower than the cost difference of JPY 1712674 between PBT and photon therapy cost themselves. Despite the increased upfront cost of PBT, these results and the incremental QALYs reflected the lower incidence of adverse events such as secondary cancer and HL in PBT.
Previous studies in Japan have considered the cost-effectiveness of PBT for pediatric medulloblastoma, with a focus on secondary cancer and HL. Hirano et al. considered HL in their analysis, and the ICER for PBT was ~$US 10 to 20 million/QALY ($US 1 = JPY 107 at that time) [17]. Yoshimura et al. considered secondary cancer and used the lifetime-attributed risk (LAR) as the outcome. The ICER was JPY 3856398/LAR (interpreted as JPY 3856398 for secondary cancer prevention) [18]. The results of this study were consistent with those of their study in that multiple life years could be extended by preventing secondary cancers. In addition, this study adds to previous studies in that lifetime events of secondary cancer used QALY as the outcome, making it easier to compare the results to other healthcare technologies. The better ICER in this study compared to that reported by Hirano et al. could be explained by the inclusion of multiple adverse events, capturing the benefits of PBT more comprehensively [17].
In this study, the cost of initial radiation therapy for pediatric patients with medulloblastoma was calculated from universal medical fees. Therefore, the calculated cost of the initial radiation therapy is valid and clinically relevant in Japan. However, other parameters, such as treatment costs associated with radiation-induced adverse events and utility values, could vary from patient to patient. PSA was conducted to address the uncertainty, and the results showed that PBT was cost-effective with a 91.7% probability, indicating that the base case result was robust. Vega et al. demonstrated that the cost effectiveness of PBT compared with photon therapy in the management of pediatric medulloblastoma, similar to our results, the ICER robustly illustrated the domination of photon therapy by PBT >95% of its 1000 iterations [19]. As the results, they concluded that PBT dominated photon therapy. On the other hand, our results showed that PBT cannot be considered dominant because both QALYs and costs were increasing. This is due to the differences in cost calculation of PBT and photon therapy. While we calculated the cost of PBT and photon therapy as the operation management cost by accumulating national fee schedule, they included the estimated cost of PBT and photon therapy not only the operation management costs but also salaries and benefits for physicians and staff and hospital overhead [19].
This study has limitations. First, there is limited availability, particularly for certain parameters. For example, the utility or disutility values for populations under 15 years of age were not measured for children, and the disutility values for HT were not obtained from the Japanese population. In addition, the mortality rates of secondary cancers are not always reflective of the composition of radiation-induced secondary cancers after medulloblastoma, because of the very rare occurrence of secondary cancers and the problem of long-term survivors. Although this study attempted to make reasonable assumptions from the available data and confirm robustness by conducting a sensitivity analysis, this analysis can be refined with more available data. The same limitation applies to the incidence of secondary cancer, whose parameters were calculated from a previous study using a mathematical projection model, not data from real world observations [22]. However, this analysis is still valuable in that it was performed with the most reasonable available approach while it is otherwise impossible to analyze the long-term cost-effectiveness of radiation therapy.
Second is the limited adverse events for survivors of childhood medulloblastoma, despite the incorporation of recently published data. Although the risk of multiple adverse events for survivors after radiation therapy, it is difficult to consider all adverse events [24]. In this study, we could not include a part of multiple adverse events to the lack of risk estimates in such patients. For example, this study did not consider adverse events such as GHD. However, theoretically, the prevalence of GHD did not differ between groups. Although both GHD and ACTH deficiency can impact mortality when not properly managed, similar to the previous report from Vega et al., we assumed that health states did not affect death based on the assumption of perfect management and compliance with medication [19].
In conclusion, we analyzed the cost-effectiveness of proton therapy for pediatric medulloblastoma considering multiple radiation-induced adverse events, such as secondary cancer, HT and HL, from the public healthcare payer’s perspective. We proposed the benefits of this therapy more comprehensively. The results showed excellent cost-effectiveness compared with conventional photon therapy.
CONFLICT OF INTEREST
None.
FUNDING
None.
CONTRIBUTION
TY and YM contributed equally to this study. KO, HA and TH supervised the project and guarantor of the data. TY, YM, RK and HT analyzed the data. TY and YM wrote the first draft of this paper. All authors contributed to the drafting and editing of the manuscript and approved the final version.
References
Proton Beam Therapy Model Policy, American Society for Radiation Oncology. https://www.astro.org/ASTRO/media/ASTRO/Daily%20Practice/PDFs/ASTROPBTModelPolicy.pdf (
The Central Social Insurance Medical Council. Guideline for Preparing Cost-Efectiveness Evaluation to the Central Social Insurance Medical Council Ver 3.0. 2022. https://c2h.niph.go.jp/tools/guideline/guideline_en.pdf (15 February 2024, date last accessed).
Cancer Statistics. Cancer Information Service, National Cancer Center, Japan (National Cancer Registry, Ministry of Health, Labour and Welfare) https://ganjoho.jp/reg_stat/statistics/stat/summary.html (
Japan Hearing Instruments Manufacturers Association (JHIMA), Japan Track
Japan Hearing Instruments Manufacturers Association (JHIMA), Japan Track
