


Abstract
To investigate optimal treatment planning using proton beams for non-squamous cell carcinoma of the head and neck (NSCHN), the dose distributions of plans involving pencil beam scanning (PBS) with or without a patient-specific aperture system (PSAS), passive-scattering proton therapy (PSPT) and X-ray intensity-modulated radiotherapy (IMRT) were compared. As clinical results, toxicities of PBS with PSAS, including changes in quality of life, were reported. Between April 2014 and August 2016, a total of 30 patients were treated using PBS with PSAS. In 20 patients selected at random, the dose distributions of PBS with or without the PSAS, PSPT and IMRT plans were compared. Neutron exposure by proton therapy was calculated using a Monte Carlo simulation. Toxicities were scored according to CTCAE ver. 4.0. Patients completed EORTC quality of life survey forms (QLQ-C30 and QLQ-HN35) before and 0–12 months after proton therapy. The 95% conformity number of PBS with the PSAS plan was the best, and significant differences were detected among the four plans (P < 0.05, Bonferroni tests). Neutron generation by PSAS was ~1.1-fold higher, but was within an acceptable level. No grade 3 or higher acute dermatitis was observed. Pain, appetite loss and increased weight loss were more likely at the end of treatment, but recovered by the 3 month follow-up and returned to the pretreatment level at the 12 month follow-up. PBS with PSAS reduced the penumbra and improved dose conformity in the planning target volume. PBS with PSAS was tolerated well for NSCHN.
INTRODUCTION
Non-squamous cell carcinoma of the head and neck (NSCHN) is rare [1], and its standard treatment is different from that for squamous cell carcinomas [2, 3]. Surgical resection and postoperative radiation therapy and/or chemotherapy (multimodality treatment) may be considered, but available clinical data are limited. NSCHN is generally resistant to photon therapy, and chemotherapy alone only yields non-durable responses. The usefulness of concurrent chemo-radiation and neoadjuvant chemotherapy has not been established. Furthermore, there is currently no standard regimen. Since local recurrence typically spreads extensively and involves critical organs, surgical approaches are often complicated by serious functional deformities, and definitive radiotherapy increases the risk of severe late toxicities. Furthermore, these approaches may reduce the quality of life (QoL) of patients. Thus, better treatment strategies are needed.
Proton therapy is spreading worldwide as a new treatment modality [4–6]. Depending on the target location, proton beams are superior to photons for dose distribution. While their relative biological effectiveness (RBE) is ~1.1 on average, favorable outcomes suggesting a higher RBE have been reported [7–9]. Proton therapy for NSCHN may reduce severe late adverse effects, such as neuropathy and brain necrosis, and may be a promising treatment modality; however, since the lesion is often close to or adjacent to the surface of the skin, broad beam irradiation methods are more likely to cause severe dermatitis and mucositis in the acute and late periods [10]. Therefore, dose distribution at the target and organs at risk as well as skin doses are important issues in proton therapy for NSCHN.
The PROBEAT-III (Hitachi, Ltd, Tokyo, Japan) proton beam therapy system has been used at the Nagoya Proton Therapy Center since February 2013. Two treatment rooms have passive scattering nozzles with range modulation wheels, and the other room is equipped with a pencil beam scanning (PBS) system using a spot-scanning method [11, 12]. PBS, in which a thin proton beam is repeatedly applied to different parts of the target until the whole target area is covered, is considered to be useful for irradiating complex targets such as NSCHN [13]. PBS is expected to produce superior dose conformity at the target than passive-scattering proton therapy (PSPT) while reducing the high-dose skin volume. However, the use of an energy absorber is indispensable for shallow lesions in order to ensure target coverage with the spread-out Bragg peak (SOBP; Fig. 1). Therefore, suboptimal beams with wide lateral profiles may lead to less steep penumbrae that may not necessarily be more suitable than PSPT.
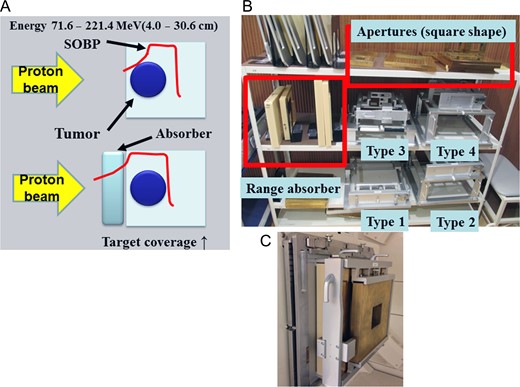
(A) In order to maintain dose coverage by the scanning irradiation method for shallow lesions, there is a limit to beam energy related to SOBP formation, and it is indispensable to use an absorber. (B) The patient-specific aperture system, range absorber and apertures. We have types 1–4, and these may be used appropriately depending on the size and depth of the irradiation field. (C) The beam exit port fit with the patient-specific aperture system.
We have implemented a patient-specific aperture system (PSAS) capable of attaching an energy absorber and reducing the lateral penumbra, similar to the original device (Fig. 1) [11, 14]. However, if PSAS is attached to the beam exit, the beam will fall into an aperture, secondary scattering may occur and scattered neutrons may arise. Therefore, the clinical use of PSAS needs to be validated. In the present study, we investigated optimal treatment planning using proton therapy for NSCHN by comparing dose distributions among plans involving PBS with/without PSAS, PSPT and X-ray IMRT. In addition, early clinical outcomes, particularly toxicity results, and QoL achieved by PBS with PSAS are reported.
MATERIALS AND METHODS
Study approval and patient eligibility
This is a report from a prospective clinical study including supplementary research on physics based on protocols designed by the Clinical Study Committees of the Nagoya City Hospital and was approved by Institutional Review Boards. Registry numbers were 13-02-23 (19) and 13-02-24 (20), respectively. The primary endpoint of the clinical study was overall survival, and the secondary endpoints were local control, adverse events and QoL scores. In the present study, we excluded overall survival and local control results because of the variety of tumor types. Eligibility criteria were as follows: (i) histologically confirmed primary NSCHN; (ii) no distant metastasis diagnosed using computed tomography (CT) scans, magnetic resonance imaging (MRI) and [18F]fluorodeoxyglucose-positron emission tomography within 28 days; (iii) no previous radiotherapy around the lesion; (iv) age >18 years; (v) ECOG-PS ≤2; and (vi) written informed consent. Dose constraints for organs at risk (OAR), including the spinal cord, optic nerve, chiasma, cochlea, brain stem, auditory nerve and parotid gland, are shown in Supplementary data S1. Within the registration period of 5 years, 15 cases a year and 75 cases in total were initially scheduled to be registered. Although patients were accrued until the third year, this prospective study was terminated in August 2016 because of a public system change in proton therapy in Japan. Since it became impermissible to use a dose fractionation of 60.8 GyE in 16 fractions to follow the unified protocol in Japan [9], and intensity-modulated proton therapy (IMPT) became available at the same time at our facility, we started a new prospective trial that allowed the use of IMPT. Therefore, the present study evaluated the safety of the preceding prospective trial.
Design of the planning study
Thirty patients with NSCHN were enrolled between April 2014 and August 2016 (Table 1). All 30 plans were created using PBS with PSAS. In the planning comparison study, 20 patients with NSCHN treated using PBS with PSAS were selected at random from the 30 patients (Table 1) because the majority of previous planning studies used <20 cases [13, 15–17], and the findings obtained did not appear to differ markedly between a study using >80 cases and studies using <20 cases [15]. The same contours created by MIM Maestro version 6.5® (MIM Software Inc., Cleveland, OH, USA) were transferred to VQA version 3.0.5® (Hitachi, Ltd, Tokyo, Japan) and iPlan version 4.1® (Brainlab AG, Feldkirchen, Germany). PBS with/without PSAS, PSPT and X-ray IMRT planning were created for each patient. Each plan was generated using the same contour as well as the same planning target volume (PTV) and OAR constraints. Proton treatment planning assumed an uncertainty in the proton beam range of 3.5% of the range plus an additional 1–3 mm. The prescribed doses were 70.2 or 60.8 GyE delivered in 2.7 or 3.8 GyE fractions in all patients (D95PTV ≥90% isodose). The protocol of 60.8 GyE in 16 fractions was used for nine melanoma patients. All irradiation was given once a day and 5 days a week. Dose–volume data were then retransferred to MIM Maestro from each treatment planning system, and dosimetric parameters were compared on MIM Maestro. Furthermore, the conformity index (CI95), conformity number (CN95, Paddick CI) and homogeneity index (HI) were calculated according to the Radiation Therapy Oncology Group criteria [18], Paddick et al. [19] and the International Commission on Radiation Units and Measurements [20], respectively. The main OAR dose and irradiated volume outside the PTV, which represents the volume of normal tissue receiving >0 Gy or 0 GyE, were also analyzed. The definition of the skin was the external contour minus 3 mm.
Patient and tumor characteristics
| Characteristics | Total | Planning study (selected at random) |
|---|---|---|
| Number | 30 | 20 |
| Age, median (range) | 69 (28–90) | 67 (28–82) |
| Sex, male/female | 14/16 | 9/11 |
| Tumor site | ||
| Nasal/maxillary/ethmoid sinus/sublingual·parotid·submandibular gland/others | 11/8/2/6/3 | 8/5/2/3/2 |
| Pathology | ||
| Melanoma/adenocarcinoma/olfactory neuroblastoma/adenoid cystic carcinoma | 9/13/1/7 | 8/8/1/3 |
| Skull base involvement (yes/no) | 16/14 | 12/8 |
| Skin involvement (yes/no) | 5/25 | 4/16 |
| GTV (ml), median (range) | 43.2 (10.0–181.5) | 37.9 (10.0–135.4) |
| CTV (ml), median (range) | 92.2 (23.0–226.0) | 72.7 (23.0–197.2) |
| PTV (ml), median (range) | 130.8 (37.0–334.3) | 116.0 (37.0–300.3) |
| T1/T2/T3/T4 | 1/6/2/21 | 1/4/0/16 |
| N1/N2 | 5/2 | 3/2 |
| Dose fractionation 70.2 GyE/26 Fr/60.8 GyE/16 Fr | 21/9 | 12/8 |
GTV = gross tumor volume, CTV = clinical target volume, PTV = planning target volume, GyE = Gray equivalent, Fr = fraction.
Details of contouring and planning
Visible lesions on CT and/or MRI were taken as the gross tumor volume. The clinical target volume (CTV) was assessed by taking the possibility of invasion to adjacent normal structures into consideration; the CTV margin ranged between 3 and 5 mm, while CTV margins to the sinus and brain were excluded in cases with no obvious invasion. Positive N1 nodal regions were included in the CTV, whereas prophylactic nodal regions were not. Positive N2 nodal regions were not included and resected after proton therapy in two patients. The concept of the PTV was also described in our previous studies [13]. Briefly, the beam-specific PTV, which was expanded from the CTV, was based on the definition reported by Park et al. [21] and took both lateral set-up errors and the uncertainty of proximal/distal range calculations for each specific beam angle into consideration. While the beam-specific PTV was used for PBS and PSPT planning, the PTV (geometry-based PTV) was used for evaluations. The constraints for the PTV adding 3 mm margins to the CTV and OAR were the same as those for IMRT planning. PBS with/without PSAS and PSPT plans were generated using VQA® in which the pencil beam algorithm with the triple Gaussian model was used. PBS plans used single-field optimization. IMRT plans were generated using iPlan® in which the Monte Carlo algorithm was used. We used a relative biological effectiveness value of 1.1 as the conversion factor, as recommended in the International Commission on Radiation Units and Measurements Report 78 [22]. The plans for PBS and PSPT employed 3–5 beam directions, the IMRT plan employed 5–7 directions and PSAS only used beam angles with no buffering with the couch. In order to validate the accuracy of the treatment planning systems, we previously compared dose profiles calculated by each planning system with doses actually measured [13]. Differences between the measured values and values calculated from the treatment planning systems were all within 2 mm. The spot size of 1 sigma was 6–14 mm and the energies used in PBS were 90–180 MeV. IMRT plans used the sliding window method, and the number of segments was 30.
Analysis of neutron exposure by proton therapy
The dose equivalent H was calculated by the Monte Carlo simulation method in order to evaluate the exposure dose by the secondary particle, including neutrons outside the irradiation field. The dose equivalent is described as ‘H[Sv] = D[Gy] × Q(LET)∞’ using dose D and quality factor Q. The quality factor Q is defined as a function of the unrestricted linear energy transfer of charged particles in water (LET∞). Its formulation is defined by the ICRP [23]. We used Monte Carlo software PTSIM [24], which is a simulation code for particle therapy built with the Geant4 toolkit (version 9.4 with patch 03) [25, 26]. A package of the ‘Standard electromagnetic process’ was used for electromagnetic interactions, while the Bertini intranuclear cascade model was used for proton and neutron inelastic nuclear reactions in combination with the high precision neutron model.
Evaluation of clinical results of PBS with PSAS
After PBS with PSAS, all 30 patients were followed-up at least once in 3 months during the first 2 years, and at 6 month intervals thereafter. Toxicities were evaluated with the Common Terminology Criteria for Adverse Events version 4.0. In order to evaluate the QoL of patients, patients completed the European Organization for Research and Treatment of Cancer Quality of Life Questionnaire Core 30 (EORTC QLQ-C30) and Head and Neck 35 (QLQ-HN35) before proton therapy, at the end of proton therapy, and 3, 6 and 12 months after proton therapy.
Statistical analysis
Dosimetric parameters among the four plans were compared (using the Kruskal–Wallis test adjusted for multiple comparisons using Bonferroni’s method) to establish whether any of the examined parameters differed significantly. QoL scores were analyzed using a one-way analysis of variance (ANOVA) and the Mann–Whitney U-test among the follow-up periods. P-values of <0.05 were considered to be significant. All analyses were performed using the software SPSS 24.0 J (SPSS Japan Inc., Tokyo, Japan).
RESULTS
Planning and neutron exposure comparison
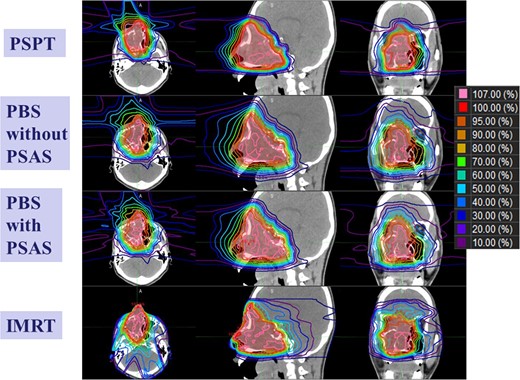
The dosimetric parameters of each irradiation method are summarized in Table 2, and a representative example of dose distributions is shown in Fig. 2; the low-dose area surrounding the target was clearly reduced in PBS by using PSAS. The low-dose areas surrounding the target in the craniocaudal direction were narrower in IMRT than in PBS with PSAS because of the penumbra of proton beams. However, the low to intermediate dose areas of the normal brain in the anteroposterior direction were narrower in PBS with PSAS than in IMRT. The CN95 of PBS with the PSAS plans was the best, and significant differences were detected among the four plans. The target dose HI 95% of the PSPT plan was the worst among the four plans. PBS with the PSAS and PSPT plans protected the skin slightly better than the other two plans, particularly in the low to intermediate dose ranges, whereas no significant difference was detected among the four plans. The irradiated volume outside the PTV increased significantly in the IMRT plan, and slight improvements were noted with PBS when PSAS was used. Neutron generation by PBS without PSAS was ~1/20th that of PSPT. Neutron exposure at a site 50 cm from the PBS irradiation center with PSAS was ~1.0- to 1.1-fold higher. A representative example of neutron doses at various positions is shown in Fig. 3.
Dosimetric parameters for each irradiation method
| Endpoint | PSPT | PBS without PSAS | PBS with PSAS | IMRT |
|---|---|---|---|---|
 | ||||
| Endpoint | PSPT | PBS without PSAS | PBS with PSAS | IMRT |
|---|---|---|---|---|
| ||||
PSPT = passive-scattering proton therapy, PBS = pencil beam scanning, PSAS = patient-specific aperture system, IMRT = intensity-modulated radiotherapy.
a,b,cMedian (range).
aConformity index, the volume receiving at least 95% of the prescribed dose (V95)/the volume of the planning target volume (VPTV).
bConformity number [target volume receiving at least 95% of the prescribed dose (TV95)]2/(VPTV × V95).
cHomogeneity index, (D2–D98)/D50, according to ICRU 83 (17), Dx = X% volume border of the PTV.
dVolume receiving at least X% of the prescribed dose.
eAffected side.
fDose at point of 50 cm from the target, relative ratio.
*P < 0.05, **P < 0.01, calculated by Bonferroni test.
Dosimetric parameters for each irradiation method
| Endpoint | PSPT | PBS without PSAS | PBS with PSAS | IMRT |
|---|---|---|---|---|
| ||||
| Endpoint | PSPT | PBS without PSAS | PBS with PSAS | IMRT |
|---|---|---|---|---|
| ||||
PSPT = passive-scattering proton therapy, PBS = pencil beam scanning, PSAS = patient-specific aperture system, IMRT = intensity-modulated radiotherapy.
a,b,cMedian (range).
aConformity index, the volume receiving at least 95% of the prescribed dose (V95)/the volume of the planning target volume (VPTV).
bConformity number [target volume receiving at least 95% of the prescribed dose (TV95)]2/(VPTV × V95).
cHomogeneity index, (D2–D98)/D50, according to ICRU 83 (17), Dx = X% volume border of the PTV.
dVolume receiving at least X% of the prescribed dose.
eAffected side.
fDose at point of 50 cm from the target, relative ratio.
*P < 0.05, **P < 0.01, calculated by Bonferroni test.
Comparisons of treatment planning for each irradiation method. Regarding proton therapy, dose calculation to guarantee the dose on the proximal side is necessary, and the stopping power of protons in the air is estimated from the CT number of air by the VQA planning system.
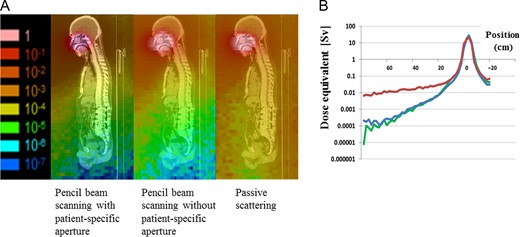
(A) Neutron dose distribution. Left, pencil beam scanning (PBS) with a patient-specific aperture system (PSAS); middle, PBS without PSAS; and right, passive-scattering proton therapy (PSPT). (B) Dose equivalents (Sv) at various positions away from the irradiation position center. Red, PSPT; blue, PBS with PSAS; and green, PBS without PSAS.
Toxicities and QOL evaluation
The protocol treatment was completed in all patients. The adverse events observed are summarized in Table 3. No grade 3 or higher acute dermatitis was observed in 30 patients. The median follow-up period after PBS with PSAS was 38 months (range: 23–46) for surviving patients. Changes in QoL after treatment are summarized in Table 4. Pain, appetite loss, swallowing disturbance and feeding tube usage were more likely to increase at the end of treatment, but recovered by the 3 month follow-up. Although significant changes were observed in QoL scores during the 1 year follow-up in the one-way ANOVA, pre-proton therapy and 12 month scores showed no significant differences. There were also no significant differences in global QoL.
Acute and late complications related to proton therapy
| Adverse event | Grade | Total |
|---|---|---|
| Number of patients | 30 | |
| Acute toxicity | ||
| Dermatitis | 2/3 | 7/0 |
| Oral mucositis | 2/3 | 3/4 |
| Dysphagia | 2/3 | 2/0 |
| Keratoconjunctivitis | 2/3 | 2/0 |
| External otitis | 2/3 | 1/0 |
| Nervous system disorders due to brain edema | 1/≥2 | 0/0 |
| Late toxicity | ||
| Dermatitis | 2/3 | 0/1a |
| Soft tissue inflammation | 2/3 | 1/0 |
| Oral mucositis·xerostomia | 2/3 | 2/0 |
| Dry eye | 2/3 | 1/0 |
| Osteomyelitis | 2/3 | 1/0 |
| External otitis | 2/3 | 0/1 |
| Epistaxis | 2/3 | 1/0 |
| Visual disturbance | 2/3 | 0/1b |
| Retina vitiligo | 2/3 | 0/1b |
| Hoarseness | 2/3 | 1/0 |
| Brain necrosis | 1/≥2 | 0/0 |
The toxicities were evaluated according to the Common Terminology Criteria for Adverse Events version 4.0.
aAbscess formation due to skin infection; an influence of surgery after proton therapy cannot be denied.
bSymptom on the affected side (included in the treatment volume).
Temporal changes with treatment of quality of life score
| Variables | Pre-PT | Final PT | 3 months | 6 months | 12 months | P-valuea | P-valueb |
|---|---|---|---|---|---|---|---|
| EORTC QLQ-C30 | |||||||
| Global QoL | 55.1 (22.8) | 51.6 (13.1) | 49.0 (13.9) | 56.4 (22.2) | 49.0 (25.3) | 0.72 | 0.51 |
| Physical functioning | 86.0 (16.9) | 87.0 (12.4) | 83.8 (18.5) | 82.0 (15.9) | 83.3 (15.0) | 0.86 | 0.47 |
| Role functioning | 81.5 (23.7) | 74.6 (23.3) | 76.0 (21.9) | 80.1 (23.7) | 80.2 (19.5) | 0.83 | 0.54 |
| Emotional functioning | 70.5 (19.0) | 75.4 (14.1) | 76.6 (23.4) | 74.5 (22.9) | 78.6 (24.5) | 0.76 | 0.09 |
| Cognitive functioning | 82.1 (16.9) | 84.9 (13.8) | 84.4 (12.9) | 77.5 (17.6) | 76.0 (21.1) | 0.39 | 0.36 |
| Social functioning | 78.6 (21.7) | 75.4 (17.2) | 80.2 (15.2) | 76.5 (17.7) | 80.2 (26.7) | 0.93 | 0.59 |
| Fatigue | 26.6 (22.1) | 31.7 (19.0) | 31.3 (20.8) | 30.1 (23.2) | 29.2 (24.6) | 0.93 | 0.73 |
| Nausea and vomiting | 1.2 (4.4) | 4.8 (10.7) | 3.1 (6.7) | 3.9 (12.5) | 2.1 (5.7) | 0.62 | 0.77 |
| Pain | 26.8 (28.0) | 35.7 (19.2) | 17.7 (19.7) | 25.5 (25.1) | 26.0 (27.9) | 0.29 | 0.96 |
| Dyspnea | 13.1 (24.6) | 15.9 (22.7) | 16.7 (21.1) | 21.6 (20.2) | 18.8 (21.0) | 0.79 | 0.29 |
| Insomnia | 16.7 (24.8) | 20.6 (19.7) | 29.2 (26.9) | 21.6 (28.7) | 16.7 (27.2) | 0.57 | 0.92 |
| Appetite loss | 25.0 (23.4) | 38.1 (30.3) | 29.2 (31.9) | 29.4 (35.1) | 20.8 (29.5) | 0.45 | 0.39 |
| Constipation | 14.3 (19.1) | 20.6 (24.7) | 14.6 (21.0) | 11.8 (16.4) | 8.3 (19.2) | 0.46 | 0.31 |
| Diarrhea | 10.7 (18.3) | 6.3 (17.1) | 10.4 (20.1) | 9.8 (22.9) | 8.3 (19.2) | 0.95 | 0.63 |
| Financial difficulties | 22.6 (22.3) | 22.2 (21.9) | 18.8 (21.0) | 21.6 (23.4) | 16.7 (27.2) | 0.92 | 0.29 |
| EORTC QLQ-H&N35 | |||||||
| Pain | 14.3 (15.4) | 31.7 (25.8) | 12.0 (18.2) | 21.1 (22.7) | 20.3 (27.5) | 0.04 | 0.71 |
| Swallowing | 10.7 (16.6) | 29.8 (25.9) | 9.4 (12.9) | 11.8 (18.2) | 18.2 (22.6) | 0.01 | 0.29 |
| Senses (taste/smell) | 14.9 (17.8) | 30.2 (23.9) | 22.9 (25.7) | 22.5 (19.5) | 17.8 (16.0) | 0.13 | 0.42 |
| Speech problems | 18.7 (24.6) | 20.1 (24.2) | 22.2 (25.3) | 17.6 (24.9) | 26.7 (25.1) | 0.85 | 0.25 |
| Social eating | 26.2 (20.5) | 26.2 (17.1) | 23.4 (17.0) | 21.1 (17.5) | 21.1 (21.3) | 0.86 | 0.64 |
| Social contact | 15.2 (23.0) | 24.1 (17.9) | 20.0 (19.3) | 21.6 (18.9) | 20.0 (24.7) | 0.67 | 0.20 |
| Less sexuality | 21.4 (29.0) | 22.2 (32.2) | 11.5 (20.8) | 29.4 (36.6) | 28.9 (39.6) | 0.55 | 0.98 |
| Teeth | 17.9 (21.2) | 9.5 (18.7) | 18.8 (29.7) | 13.7 (26.5) | 13.3 (16.9) | 0.68 | 0.53 |
| Opening mouth | 19.0 (30.7) | 17.5 (20.1) | 18.8 (29.7) | 19.6 (29.0) | 17.8 (27.8) | 0.99 | 0.91 |
| Dry mouth | 23.8 (25.4) | 36.5 (27.7) | 39.6 (32.7) | 49.0 (33.6) | 33.3 (25.2) | 0.07 | 0.20 |
| Sticky saliva | 15.5 (21.2) | 39.7 (34.3) | 27.1 (27.8) | 21.6 (26.2) | 28.9 (35.3) | 0.06 | 0.25 |
| Coughing | 9.5 (17.8) | 7.9 (18.0) | 18.8 (21.0) | 11.8 (16.4) | 17.8 (21.3) | 0.35 | 0.31 |
| Felt ill | 22.6 (25.7) | 25.4 (23.3) | 31.3 (25.7) | 23.5 (25.7) | 33.3 (25.2) | 0.73 | 0.22 |
| Pain killers | 39.3 (49.7) | 57.1 (50.7) | 25.0 (44.7) | 29.4 (47.0) | 26.7 (45.8) | 0.27 | 0.66 |
| Nutritional supplements | 21.4 (41.8) | 19.0 (40.2) | 25.0 (44.7) | 41.2 (50.7 | 20.0 (41.4) | 0.52 | 0.88 |
| Feeding tube | 3.6 (18.9) | 19.0 (40.2) | 0.0 (0.0) | 0.0 (0.0) | 0.0 (0.0) | 0.02 | 0.85 |
| Weight loss | 32.1 (47.6) | 52.4 (51.2) | 25.0 (44.7) | 19.4 (47.0) | 26.7 (45.8) | 0.35 | 0.70 |
| Weight gain | 7.1 (26.2) | 14.3(35.9) | 18.8 (40.3) | 23.5 (43.7) | 13.3 (35.2) | 0.63 | 0.77 |
PT = proton therapy.
Mean (standard deviation).
aDifferences were examined by one-way analysis of variance from pre-PT to 12 months after PT.
bDifferences were examined by Mann–Whitney U-test between pre-PT and 12 months after PT.
DISCUSSION
NSCHN is resistant to X-rays, and dose escalations with the alleviation of accompanying adverse events are necessary as much as possible, to which PBS may contribute. However, dose distributions do not necessarily improve in PBS. Widesott et al. [27] reported that the size of σ to be tolerated on dose comparisons with head and neck cancer was ≤4 mm since the dose coverage of the target may markedly change due to differences in the spot size, spot spacing and planning optimization. Moreover, Moteabbed et al. [28] indicated the weak point of the penumbra of scanning proton therapy without using a collimator and recommended the use of a collimator when the spot size was >8 mm. The spot size and penumbra in the deep and shallow parts differ markedly depending on whether the accelerator is a synchrotron or cyclotron [29]. Although it is dependent on the spot size of the machine at our institution, the deterioration of CN was obvious based on increases in the penumbra without the use of PSAS. In the present study, the method of reducing the penumbra by PSAS was considered to be useful for improving CN95. Although PSPT contributes to reducing the irradiated volume outside the PTV, it cannot be superior to PBS with PSAS for CN95 and HIICRU. However, single field optimization in PBS plans may not have taken robustness into account just by the addition of a margin. Although homogeneity is good in simple plan comparisons, it may actually be inhomogeneous due to the misalignment and angles of beams. Therefore, it is necessary to consider plans by worst case optimization. This was a limitation in the present study. In the future, we intend to analyze the validity of single field optimization in PBS for misalignment. Furthermore, neutron generation was markedly lower in PBS than in PSPT. Neutron generation using PSAS was simulated to be 1.0- to 1.1-fold higher; although lower neutron generation was considered to be better, the level was acceptable. Lower neutron generation contributes to decreases in late secondary carcinogenesis, particularly for tumors such as pediatric head and neck tumors and adenoid cystic carcinoma (ACC) with a good prognosis. In this respect, PBS is more advantageous than PSPT. However, the current PSAS conforms to the tumor shape with respect to the maximum area through which the spot passes and, in order to further improve it, another technique such as the use of multi-leaf collimators in which the shape of the collimator is changed for each irradiated layer is warranted. Another approach to improve the penumbra is to change the spot arrangement. It is now only possible to irradiate spots sequentially at regular intervals, such as grid eyes. Improvements in dose distributions are expected with irradiation capable of freely changing spot spacing so that spots may be arranged [30]. In order to achieve this, improvements in the treatment planning system by the manufacturer are considered to be necessary.
This study has a limitation in that the cases examined were diverse with respect to the treatment site, and direct comparisons with the disease for which proton therapy was performed were not possible. In a report of proton therapy mainly by the broad beam method, Takagi et al. [7] showed that grades 2 and 3 acute dermatitis were observed in 30 (38%) and 2 (2.5%) patients, respectively. Regarding acute mucositis, 21 patients (26%) developed late complications of grade 3 or greater. Pommier et al. [31] reported that 17% of skull base ACC patients who received proton therapy developed late grade ≥3 complications in the eye and vision, while 50% patients developed grade ≥3 late complications, including brain necrosis. Although our follow-up periods were shorter than in those studies, acute dermatitis may be ameliorated, and late toxicities may also be alleviated. Since the irradiation field size varies depending on the case, no significant differences were observed in the skin dose in mean value comparisons. However, reductions in high-dose irradiation areas from those in PSPT may be associated with the alleviation of severe dermatitis and mucositis.
To the best of our knowledge, QoL changes after proton therapy were reported for the first time in the present study. QoL with respect to pain, appetite loss, swallowing and feeding tubes temporarily decreased at the end of treatment; however, they were likely to recover 3 months later, and no significant differences were observed in scores between before and 1 year after treatment (Table 4). Due to the rarity of NSCHN, reports on QoL changes after photon therapy are also limited, and difficulties are associated with comparing QoL changes with previous studies. Deteriorations in global QoL and xerostomia have been reported for oral cavity cancer 6 months after postoperative photon therapy [32]. Huang et al. [33] showed that better QoL improvements were achieved over those with 3D conformal radiation therapy (CRT) for nasopharyngeal squamous cell carcinoma by using IMRT. However, Zenda et al. [34] suggested the necessity for longer follow-ups because late toxicity occurred 5 years after proton therapy. Furthermore, it appears to be necessary to evaluate the majority of cases with longer follow-ups in order to demonstrate that PBS with PSAS provides dose distributions that prevent reductions in QoL [35].
IMPT may further improve dose distributions. IMPT may help to create better dose distributions for irregularly shaped tumors [36]. However, even if IMPT is used, PSAS is necessary because the penumbra due to the spot size and absorber is not eliminated [37]. Although we started IMPT, our IMPT planning system has not yet been perfectly integrated, and comparisons with IMPT planning were not performed in the present study. IMPT requires robust planning, and treatment planning is currently conducted using worst case optimization. Although simple planning comparisons are impossible due to the necessity for robustness, a treatment method is selected by considering the positional relationship between the surrounding proximal OAR and the tumor. Furthermore, different beam calculation models, target concepts and different robustness may bring many additional issues to a planning study between proton therapy and IMRT. This was also a limitation in the present study. In the future, patients treated using IMPT with PSAS will be evaluated with respect to toxicities and QoL in a similar manner.
In conclusion, PBS with PSAS reduced the penumbra and improved dose conformity in the PTV. PBS with PSAS was tolerated well for NSCHN.
ACKNOWLEDGEMENTS
The authors are grateful to Mr Eiki Nikawa, Mrs Fumiko Kishimoto, Mrs Akemi Nanjyo, Mrs Rina Kosera and Dr Hideo Fukano for their valuable help in this research.
FUNDING
This work was supported by JSPS KAKENHI grant number 15H05675.
CONFLICT OF INTEREST
No conflicts of interest exist for any of the authors.
Partially presented at the 58th Annual Meeting of the American Society for Radiation Oncology, Boston Convention and Exhibition Center, Boston, September 25–28, 2016.
