


Abstract
Co-trimoxazole is recommended for all children with human immunodeficiency virus. In this analysis, we evaluate trends in pediatric co-trimoxazole use and survival on co-trimoxazole in children using antiretroviral therapy (ART).
We used data collected between January 1, 2006, and March 31, 2016, from the International Epidemiology Databases to Evaluate AIDS. Logistic regression was used to evaluate factors associated with using co-trimoxazole at ART initiation. Competing risk regression was used to assess factors associated with death.
A total of 54113 children were included in this study. The prevalence of co-trimoxazole use at ART initiation increased from 66.5% in 2006 to a peak of 85.6% in 2010 and then declined to 48.5% in 2015–2016. A similar trend was observed among children who started ART with severe immunodeficiency. After adjusting for year of ART initiation, younger age (odds ratio [OR], 1.18 for <1 vs 1 to <5 years of age [95% confidence interval (CI), 1.09–1.28]), lower height-for-age z score (OR, 1.15 for less than −3 vs greater than −2 [95% CI, 1.08–1.22]), anemia (OR, 1.08 [95% CI, 1.02–1.15]), severe immunodeficiency (OR, 1.25 [95% CI, 1.18–1.32]), and receiving care in East Africa (OR, 8.97 vs Southern Africa [95% CI, 8.17–9.85]) were associated with a high prevalence of co-trimoxazole use. Survival did not differ according to co-trimoxazole use in children without severe immunodeficiency (hazard ratio, 1.01 for nonusers versus users [95% CI, 0.77–1.34]).
Recent declines in co-trimoxazole use may not be linked to the current shift toward early ART initiation. Randomized trial data might be needed to establish the survival benefit of co-trimoxazole in children without severe immunodeficiency.
Co-trimoxazole is inexpensive, well tolerated, and active against a variety of bacterial, fungal, and protozoal infections. The World Health Organization (WHO) currently recommends co-trimoxazole initiation in all human immunodeficiency virus (HIV)-infected children, irrespective of disease stage or use of antiretroviral therapy (ART), to prevent infections such as Pneumocystis pneumonia, toxoplasmosis, and malaria and to reduce overall mortality risk [1]. Once co-trimoxazole is initiated, it should be continued until the child (1) reaches adulthood (if he or she is in a setting in which malaria or severe bacterial infections are highly prevalent) or (2) becomes clinically stable on ART (if he or she is >5 years old and is in an area with a low prevalence of malaria and bacterial infection) [1].
Past guidelines also recommended co-trimoxazole prophylaxis, albeit with an indication contingent on HIV disease stage and CD4 cell count [2, 3]. However, the scale-up of co-trimoxazole among children with HIV has moved slowly [4, 5]. Suboptimal prescribing has been linked to political and economic instability within certain countries [6]. The possibility that routine co-trimoxazole use could lead to antimicrobial resistance, the rates of which are now high in many settings, is also a concern [7]. Yet, even when resistance is highly prevalent, co-trimoxazole has been shown to reduce morbidity and mortality rates in HIV-infected children [8–10].
Despite the volume of evidence that supports co-trimoxazole use in children living with HIV, doubt remains regarding the survival benefit for those who have a high CD4 count and live in a resource-limited setting. This “issue” is becoming increasingly relevant as guidelines shift toward recommending immediate initiation of ART and as pediatric HIV transitions into a chronic disease [11]. The CHAP (co-trimoxazole as prophylaxis against opportunistic infections in HIV-infected Zambian children) study, a placebo-controlled trial conducted in Zambia among 541 HIV-infected children, found a 43% reduction in the risk of death with co-trimoxazole [9]. However, the difference among children with a baseline CD4 percentage of ≥15% was not significant (hazard ratio [HR], 0.62 [95% confidence interval (CI), 0.26–1.47]), and most of the children did not receive ART during the study period. Another randomized trial, ARROW (Antiretroviral Research for Watoto), undertaken in Uganda and Zimbabwe recruited 758 children who had been receiving ART for at least 96 weeks [8]. The median CD4 percentage at enrollment was 33%. Compared with ceasing co-trimoxazole, continuing was found to be associated with significantly fewer deaths or hospitalizations (combined outcome). Yet, this finding was driven by a higher rate of hospitalization in the group of children who had ceased co-trimoxazole; the number of deaths was very low in both groups (2 and 3 in the cease and continue groups, respectively). In high-income countries, it has long been recommended that co-trimoxazole be discontinued in HIV-infected children after CD4 cell count recovery because of the low risk of opportunistic infection [12].
Describing recent trends in co-trimoxazole use and identifying HIV-infected subgroups with a low rate of co-trimoxazole use will help to inform public health policy. Evidence that links co-trimoxazole with a survival benefit in children without severe immunodeficiency and who live in a resource-limited setting could aid efforts to expand routine prophylaxis.
METHODS
Study Population
We used data collected between January 1, 2006, and March 31, 2016, from the 5 regions of the International Epidemiology Databases to Evaluate AIDS (IeDEA) consortium, which routinely collects information on pediatric co-trimoxazole use, namely, East Africa, West Africa, Central Africa, Southern Africa, and Asia Pacific [13, 14]. All the countries involved are currently considered to have a low- or middle-income economy according to World Bank criteria [15].
Ethics
Ethics approvals for ongoing participation in the IeDEA are maintained at each participating site and regional data center. Consent requirements are deferred to the local programs.
Inclusion Criteria
Children were included in this analysis if they initiated ART between the age of 1 month and <15 years. Infants younger than 1 month were excluded because the risk of kernicterus with co-trimoxazole remains uncertain in this population [16]. We included data from sites that recorded co-trimoxazole start and stop dates and from sites that recorded only when co-trimoxazole was prescribed at a clinic visit. Those from the latter category were excluded from our mortality and co-trimoxazole–cessation analyses, because we could not determine postbaseline co-trimoxazole cessation accurately. Only children who used co-trimoxazole at ART initiation were included in our co-trimoxazole–cessation analysis.
Definitions
“Baseline” was defined as the date of ART initiation. “ART” was defined as 3 or more antiretroviral drugs in a single regimen. "Survival" was defined as being alive. The window period for baseline height, weight, hemoglobin concentration, CD4 percentage, and CD4 cell count was between 6 months before, and 14 days after baseline. When more than 1 measurement was available in the window period, the measurement taken closest to baseline was used. Height and weight measurements were converted into age- and sex-standardized z scores. Height-for-age z scores were calculated using the 2007 WHO child growth standards and macros [17, 18]. Weight-for-age z scores were calculated using the WHO child growth standards and macros for 1977 [19]. The 1977 standards were used because the 2007 WHO weight-for-age standards are limited to children aged ≤10 years, and a previous analysis of the Asia Pacific cohort found that the 1977 and 2007 standards provided similar results [20].
Children were considered to be using co-trimoxazole at baseline if they were using any form of prophylactic co-trimoxazole at ART initiation or started co-trimoxazole within 14 days of ART initiation or, at sites where co-trimoxazole start and stop dates were not collected, had a clinic visit between 6 months before ART initiation to 14 days after ART initiation during which they were prescribed prophylactic co-trimoxazole. “Anemia” was defined according to the age- and sex-specific limits outlined in the Division of AIDS table for grading the severity of adult and pediatric adverse events [21]. “Severe immunodeficiency” was defined by the age-specific CD4 percentage and CD4 cell count thresholds in the 2006 WHO pediatric guidelines on ART use [22]. Patients were defined as lost to follow-up if they had not been seen at their treating clinic for >12 months without documentation of transfer or death.
Statistical Analyses
Trends in co-trimoxazole use were generated by calculating, for each calendar year, the proportion of children who were using co-trimoxazole at baseline over the total number of children who started ART. We generated trends in severe immunodeficiency by calculating, for each calendar year, the proportion of children with severe immunodeficiency at baseline over the total number of children who started ART with a CD4 measurement available. We used logistic regression to evaluate factors associated with using co-trimoxazole at baseline. Competing risk-regression and cumulative incidence plots were used to assess factors associated with death and co-trimoxazole cessation.
In the mortality analysis, follow-up was censored at the last recorded clinic visit, and loss to follow-up was considered a competing event. In the cessation analysis, patients did not contribute follow-up after their first co-trimoxazole cessation on ART, follow-up was censored at the last recorded clinic visit while still using co-trimoxazole, and death and loss to follow-up were considered competing events. We did not attempt to model ART interruptions or modifications in our mortality and cessation analyses.
We defined age at ART initiation, sex, year of ART initiation, and geographical region as fixed covariates. Height, weight, hemoglobin concentration, and severe immunodeficiency were evaluated as time-updated covariates. In the mortality analysis, we included co-trimoxazole use as a time-updated covariate.
Covariates were included in the initial multivariate model if 1 or more categories had a P value of <.25 and retained in the final model if 1 or more categories exhibited an adjusted P value of <.05. We did not include height and weight together in our multivariate analyses because of the high likelihood of collinearity. If both of them were significant after we adjusted for other significant covariates, the 1 with the lowest P value was included in the main multivariate model. For simplicity, we labeled subdistribution HRs generated from our competing risk-regression models as HRs. Patients with missing data were included in all of the main analyses, but we do not report odds ratios (ORs) and HRs for missing categories.
We performed all data management with the combined data set using SAS 9.4 (SAS Institute, Inc, Cary, North Carolina) and all statistical analyses with Stata 14 (Stata Corp., College Station, Texas).
Sensitivity Analyses
Because some variables in the final data set contained a large amount of missing information, we assumed that these values were missing at random and applied multiple imputations to explore their effect on our main findings. The methods for and results of our sensitivity analyses are detailed in Supplementary Materials - Sensitivity Analyses.
RESULTS
Patient Characteristics
A total of 54113 children aged 1 month to <15 years started ART in the study period. The median age at ART initiation was 5.7 years (interquartile range [IQR], 2.3–9.6 years), and 50.7% of the children were female. Co-trimoxazole was used by 39811 (73.6%) children at ART initiation. Among the 22144 children included in our mortality analysis, the median duration of follow-up after starting ART was 3.3 years (IQR, 1.3–5.6 years). Death while receiving ART was recorded for 1488 (6.7%) children, and 3840 (17.3%) children were lost to follow-up. Of the 18835 children included in our co-trimoxazole–cessation analysis, co-trimoxazole cessation was documented for 5282 (28.0%), and the median duration of continuous co-trimoxazole use after ART initiation was 1.0 year (IQR, 0.4–1.9 years). The baseline characteristics of children at ART initiation and of those included in our mortality and cessation analyses are shown in Table 1.
Baseline Characteristicsa
| Baseline Characteristic | ART-Initiation Population (n = 54 113) | Mortality-Analysis Population (n = 22144) | Co-trimoxazole–Cessation Analysis Population (n = 18 835) |
|---|---|---|---|
| Age at ART initiation (n [%]) | |||
| <1 years | 4688 (8.7) | 2088 (9.4) | 1670 (8.9) |
| 1 to <5 years | 19702 (36.4) | 7922 (35.8) | 6844 (36.3) |
| 5 to <10 years | 17568 (32.5) | 7669 (34.6) | 6569 (34.9) |
| ≥10 | 12155 (22.5) | 4465 (20.2) | 3752 (19.9) |
| Age at ART initiation (median [IQR]) (years) | 5.7 (2.3–9.6) | 5.6 (2.5–9.2) | 5.6 (2.6–9.1) |
| Sex (n [%]) | |||
| Male | 26693 (49.3) | 11092 (50.1) | 9419 (50.0) |
| Female | 27420 (50.7) | 11052 (49.9) | 9416 (50.0) |
| Height-for-age z score (n [%]) | |||
| Greater than −2.0 | 16287 (30.1) | 7089 (32.0) | 6482 (34.4) |
| −2.0 to −3.0 | 9665 (17.9) | 3935 (17.8) | 3630 (19.3) |
| Less than −3.0 | 13380 (24.7) | 4650 (21.0) | 4348 (23.1) |
| Unknown | 14781 (27.3) | 6470 (29.2) | 4375 (23.2) |
| Height-for-age z score (median [IQR]) | −2. (−3.5 to −1.3) | −2. (−3.2 to −1.2) | −2. (−3.3 to −1.2) |
| Weight-for-age z score (n [%]) | |||
| Greater than −2.0 | 23440 (43.3) | 9919 (44.8) | 8817 (46.8) |
| −2.0 to −3.0 | 9829 (18.2) | 4137 (18.7) | 3622 (19.2) |
| Less than −3.0 | 15242 (28.2) | 5817 (26.3) | 5160 (27.4) |
| Unknown | 5602 (10.4) | 2271 (10.3) | 1236 (6.6) |
| Weight-for-age z score (median [IQR]) | −2. (−3.4 to −1.0) | −2. (−3.3 to −0.9) | −2. (−3.3 to −0.9) |
| Hemoglobin concentration (n [%]) | |||
| Normal | 12673 (23.4) | 5324 (24.0) | 4506 (23.9) |
| Anemic | 14849 (27.4) | 6316 (28.5) | 5257 (27.9) |
| Unknown | 26591 (49.1) | 10504 (47.4) | 9072 (48.2) |
| Severe immunodeficiency (n [%]) | |||
| No | 15504 (28.7) | 6740 (30.4) | 5772 (30.6) |
| Yes | 20078 (37.1) | 10588 (47.8) | 9056 (48.1) |
| Unknown | 18531 (34.2) | 4816 (21.7) | 4007 (21.3) |
| Initial ART regimen (n [%]) | |||
| NNRTI based | 50032 (92.5) | 19988 (90.3) | 17445 (92.6) |
| PI based | 3162 (5.8) | 1841 (8.3) | 1107 (5.9) |
| Other | 919 (1.7) | 315 (1.4) | 283 (1.5) |
| Co-trimoxazole use at ART initiation (n [%]) | |||
| Yes | 39811 (73.6) | 18835 (85.1) | 18835 (100.0) |
| No | 14302 (26.4) | 3309 (14.9) | 0 (0.0) |
| Year of ART initiation (n [%]) | |||
| 2006 | 4268 (7.9) | 2104 (9.5) | 1828 (9.7) |
| 2007 | 4880 (9.0) | 2340 (10.6) | 2019 (10.7) |
| 2008 | 5458 (10.1) | 2506 (11.3) | 2094 (11.1) |
| 2009 | 6249 (11.5) | 2932 (13.2) | 2573 (13.7) |
| 2010 | 6534 (12.1) | 3103 (14.0) | 2764 (14.7) |
| 2011 | 7008 (13.0) | 3146 (14.2) | 2764 (14.7) |
| 2012 | 5536 (10.2) | 2406 (10.9) | 1961 (10.4) |
| 2013 | 5206 (9.6) | 1659 (7.5) | 1387 (7.4) |
| 2014 | 5334 (9.9) | 1412 (6.4) | 1173 (6.2) |
| 2015–2016 | 3640 (6.7) | 536 (2.4) | 272 (1.4) |
| Region (n [%]) | |||
| East Africa | 11598 (21.4) | 11131 (50.3) | 10927 (58.0) |
| West Africa | 3760 (6.9) | 2762 (12.5) | 2023 (10.7) |
| Central Africa | 2326 (4.3) | 1501 (6.8) | 1414 (7.5) |
| Southern Africa | 32781 (60.6) | 3123 (14.1) | 1750 (9.3) |
| Asia Pacific | 3648 (6.7) | 3627 (16.4) | 2721 (14.4) |
Abbreviations: ART, antiretroviral therapy; IQR, interquartile range; NNRTI, nonnucleoside reverse transcriptase inhibitor; PI, protease inhibitor.
aPercentages indicate the percentage of total population.
bChildren for whom postbaseline co-trimoxazole cessation could not be determined accurately were excluded from the mortality and cessation analyses.
Co-trimoxazole Use at ART Initiation
Figure 1 shows calendar year trends in the prevalence of co-trimoxazole use and severe immunodeficiency at ART initiation. Overall, co-trimoxazole use increased from 66.5% in 2006 to a peak of 85.6% in 2010 and then declined to 48.5% in 2015–2016. The proportion of children with severe immunodeficiency at ART initiation decreased from 69.6% in 2006 to 42.6% in 2015–2016.

Trends in co-trimoxazole use and severe immunodeficiency at antiretroviral therapy (ART) initiation (N = 54113). *, No data available.
After we adjusted for geographical region and year of ART initiation, younger age (OR, 1.18 for <1 vs 1 to <5 years of age [95% CI, 1.09–1.28]; P = .0001), a low hemoglobin concentration (OR, 1.08 vs normal hemoglobin concentration [95% CI, 1.02–1.15]; P = .0122), severe immunodeficiency (OR, 1.26 vs no severe immunodeficiency [95% CI, 1.18–1.32]; P < .0001), and a lower height-for-age z score (OR, 1.15 for less than −3.0 vs greater than −2.0 [95% CI, 1.08–1.22]; P < .0001) were associated with a high prevalence of co-trimoxazole use (Table 2). A lower weight-for-age z score (OR, 1.06 for less than −3.0 vs greater than −2.0 [95% CI, 1.01–1.12]; P = .0206) also was associated with a high prevalence of co-trimoxazole use when substituted for height-for-age z score in the final model.
Factors Associated With Using Co-trimoxazole at ART Initiation
| Characteristic | Children Started on ART | Children Using Co-trimoxazole at ART Initiation (% of Total) | Univariate OR (95% CI) | P | Multivariate OR (95% CI) | P |
|---|---|---|---|---|---|---|
| Overall | 54113 | 39811 (73.6) | ||||
| Age at ART initiationa | ||||||
| <1 years | 4688 | 3460 (73.8) | 0.97 (0.90–1.04) | .4078 | 1.18 (1.09–1.28) | .0001 |
| 1 to <5 years | 19702 | 14657 (74.4) | 1.00 | 1.00 | ||
| 5 to <10 years | 17568 | 12930 (73.6) | 0.96 (0.92–1.01) | .0811 | 0.89 (0.85–0.94) | <.0001 |
| ≥10 years | 12155 | 8764 (72.1) | 0.89 (0.85–0.94) | <.0001 | 0.88 (0.83–0.93) | <.0001 |
| Sex | ||||||
| Male | 26693 | 19684 (73.7) | ||||
| Female | 27420 | 20127 (73.4) | 0.98 (0.95–1.02) | .3705 | ||
| Height-for-age z scorea | ||||||
| Greater than −2.0 | 16287 | 12726 (78.1) | 1.00 | 1.00 | ||
| −2.0 to −3.0 | 9665 | 7745 (80.1) | 1.13 (1.06–1.20) | .0001 | 1.13 (1.06–1.21) | .0003 |
| Less than −3.0 | 13380 | 10740 (80.3) | 1.14 (1.08–1.20) | <.0001 | 1.15 (1.08–1.22) | <.0001 |
| Unknown | 14781 | 8600 (58.2) | — | — | ||
| Weight-for-age z scoreb | ||||||
| Greater than −2.0 | 23440 | 17927 (76.5) | 1.00 | 1.00 | ||
| −2.0 to −3.0 | 9829 | 7713 (78.5) | 1.12 (1.06–1.19) | <.0001 | 1.08 (1.02–1.15) | .0139 |
| Less than −3.0 | 15242 | 11843 (77.7) | 1.07 (1.02–1.12) | .0054 | 1.06 (1.01–1.12) | .0206 |
| Unknown | 5602 | 2328 (41.6) | — | — | ||
| Hemoglobin concentrationa | ||||||
| Normal | 12673 | 9835 (77.6) | 1.00 | 1.00 | ||
| Anemic | 14849 | 11737 (79.0) | 1.09 (1.03–1.15) | .0039 | 1.08 (1.02–1.15) | .0122 |
| Unknown | 26591 | 18239 (68.6) | — | — | ||
| Severe immunodeficiencya | ||||||
| No | 15504 | 11913 (76.8) | 1.00 | 1.00 | ||
| Yes | 20078 | 16316 (81.3) | 1.31 (1.24–1.38) | <.0001 | 1.25 (1.18–1.32) | <.0001 |
| Unknown | 18531 | 11582 (62.5) | — | — | ||
| Year of ART initiationa | ||||||
| 2006 | 4268 | 2838 (66.5) | 1.00 | 1.00 | ||
| 2007 | 4880 | 3538 (72.5) | 1.33 (1.21–1.45) | <.0001 | 1.31 (1.19–1.44) | <.0001 |
| 2008 | 5458 | 4354 (79.8) | 1.99 (1.81–2.18) | <.0001 | 1.97 (1.79–2.18) | <.0001 |
| 2009 | 6249 | 5257 (84.1) | 2.67 (2.43–2.93) | <.0001 | 2.51 (2.27–2.77) | <.0001 |
| 2010 | 6534 | 5593 (85.6) | 2.99 (2.73–3.29) | <.0001 | 2.79 (2.52–3.09) | <.0001 |
| 2011 | 7008 | 5815 (83.0) | 2.46 (2.25–2.68) | <.0001 | 2.31 (2.09–2.54) | <.0001 |
| 2012 | 5536 | 4074 (73.6) | 1.40 (1.29–1.53) | <.0001 | 1.35 (1.23–1.49) | <.0001 |
| 2013 | 5206 | 3347 (64.3) | 0.91 (0.83–0.99) | .0250 | 0.95 (0.87–1.05) | .3324 |
| 2014 | 5334 | 3230 (60.6) | 0.77 (0.71–0.84) | <.0001 | 0.82 (0.75–0.90) | <.0001 |
| 2015–2016 | 3640 | 1765 (48.5) | 0.47 (0.43–0.52) | <.0001 | 0.68 (0.61–0.75) | <.0001 |
| Regiona | ||||||
| East Africa | 11598 | 11076 (95.5) | 1.00 | 1.00 | ||
| West Africa | 3760 | 2618 (69.6) | 0.11 (0.10–0.12) | <.0001 | 0.13 (0.11–0.14) | <.0001 |
| Central Africa | 2326 | 1674 (72.0) | 0.12 (0.11–0.14) | <.0001 | 0.19 (0.16–0.21) | <.0001 |
| Southern Africa | 32781 | 21717 (66.2) | 0.09 (0.08–0.10) | <.0001 | 0.11 (0.10–0.12) | <.0001 |
| Asia Pacific | 3648 | 2726 (74.7) | 0.14 (0.12–0.16) | <.0001 | 0.12 (0.11–0.14) | <.0001 |
Abbreviations: ART, antiretroviral therapy; CI, confidence interval; OR, odds ratio.
aIncluded in the final model.
bHeight-for-age z score was substituted by weight-for-age z score in the multivariate model.
Supplementary Figure 1 shows the prevalence of co-trimoxazole use according to calendar year in children with severe immunodeficiency. Proportions tended to be higher than those shown in Figure 1; however, the trends were similar. Overall, co-trimoxazole use in children with severe immunodeficiency increased from 79.2% to 89.7% between 2006 and 2010 before declining to 54.4% in 2015–2016. In our multivariate model, which we adjusted for geographical region and year of ART initiation, age (OR, 0.83 for <1 vs 1 to <5 years of age [95% CI, 0.73–0.95]; P = .0057) was the only patient-level factor associated with co-trimoxazole use in severely immunodeficient children (Supplementary Table 1).
Death
Figure 2 shows a comparison of the cumulative incidence of death according to co-trimoxazole use in children with and without severe immunodeficiency. In children who were not severely immunodeficient, co-trimoxazole users and nonusers had similarly low rates of death. In contrast, co-trimoxazole use was associated with a substantial survival benefit in children with severe immunosuppression, which persisted for approximately 4 years after ART initiation.
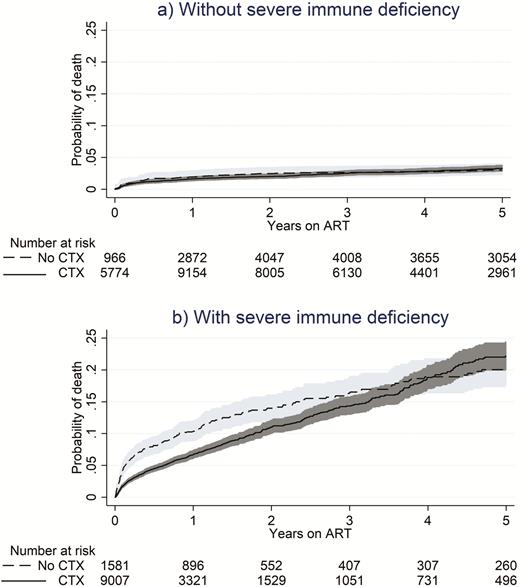
Cumulative incidence of death on antiretroviral therapy with or without concomitant co-trimoxazole use. Shaded regions represent the 95% confidence interval. Abbreviation: ART, antiretroviral therapy; CTX, co-trimoxazole.
Overall, the hazard of death in children not using co-trimoxazole was 1.52 (95% CI, 1.29–1.78; P < .0001) times that of those who were using co-trimoxazole. This result was driven by children with severe immunodeficiency, in whom the hazard of death was 1.88 (95% CI, 1.58–2.25; P < .0001) times greater among co-trimoxazole nonusers than among co-trimoxazole users. Table 3 shows that, in those without severe immunodeficiency, the hazard of death did not differ according to co-trimoxazole use (HR, 1.01 for co-trimoxazole nonusers vs users [95% CI, 0.77–1.34]; P = .9244). Other factors found to be significantly associated with death were age (HR, 1.52 for <1 vs 1 to <5 years of age [95% CI, 1.29–1.79]; P < .0001), a lower weight-for-age z score (HR, 5.83 for less than −3.0 vs greater than −2.0 [95% CI, 5.07–6.71]; P < .0001), a low hemoglobin concentration (HR, 1.73 vs normal hemoglobin concentration [95% CI, 1.50–2.00]; P < .0001), year of ART initiation (HR, 0.44 for 2015–2016 vs 2006 [95% CI, 0.23–0.83]; P = .0113), and geographical region (HR, 1.50 for West Africa vs East Africa [95% CI, 1.30–1.74]; P < .0001; and HR, 0.29 for Southern Africa vs East Africa [95% CI, 0.22–0.37]; P < .0001). A lower height-for-age z score (HR, 2.79 for less than −3.0 vs greater than −2.0 [95% CI, 2.42–3.22]; P < .0001) was associated also with death in the adjusted model when we substituted it for the weight-for-age z score.
Factors Associated With Death While on ART (N = 22144)
| Characteristic | Deaths (n) | Patient-Years | Rate per 100 Patient- Years (95% CI) | Univariate HR (95% CI) | P | Multivariate HR (95% CI) | P |
|---|---|---|---|---|---|---|---|
| Overall | 1488 | 80507.6 | 1.85 (1.76–1.94) | ||||
| Co-trimoxazole/severe immunodeficiencya | |||||||
| Yes/no | 232 | 37274.3 | 0.62 (0.55–0.71) | 1.00 | 1.00 | ||
| No/no | 86 | 23561.6 | 0.37 (0.30–0.45) | 0.82 (0.64–1.06) | .1272 | 1.01 (0.77–1.34) | .9244 |
| Yes/yes | 739 | 11948.4 | 6.18 (5.75–6.65) | 5.33 (4.55–6.25) | <.0001 | 3.59 (3.06–4.22) | <.0001 |
| No/yes | 222 | 3711.9 | 5.98 (5.24–6.82) | 6.86 (5.69–8.26) | <.0001 | 6.76 (5.46–8.38) | <.0001 |
| Yes/unknown | 174 | 3006.9 | 5.79 (4.99–6.71) | — | — | ||
| No/unknown | 32 | 998.0 | 3.21 (2.27–4.53) | — | — | ||
| Age at ART initiationa | |||||||
| <1 years | 231 | 6677.4 | 3.46 (3.04–3.94) | 1.70 (1.45–1.98) | <.0001 | 1.52 (1.29–1.79) | <.0001 |
| 1 to <5 years | 547 | 30282.8 | 1.81 (1.66–1.96) | 1.00 | 1.00 | ||
| 5 to <10 years | 424 | 28964.9 | 1.46 (1.33–1.61) | 0.81 (0.71–0.92) | <.0001 | 0.85 (0.75–0.97) | .0142 |
| ≥10 years | 286 | 14582.5 | 1.96 (1.75–2.20) | 0.98 (0.85–1.13) | .7542 | 0.81 (0.70–0.94) | .0048 |
| Sex | |||||||
| Male | 772 | 40853.8 | 1.89 (1.76–2.03) | 1.00 | |||
| Female | 716 | 39653.7 | 1.81 (1.68–1.94) | 0.94 (0.85–1.04) | .2337 | ||
| Height-for-age z scoreb | |||||||
| Greater than −2.0 | 294 | 34107.3 | 0.86 (0.77–0.97) | 1.00 | 1.00 | ||
| −2.0 to −3.0 | 282 | 15384.4 | 1.83 (1.63–2.06) | 1.84 (1.56–2.16) | <.0001 | 1.64 (1.39–1.93) | <.0001 |
| Less than −3.0 | 607 | 15401.8 | 3.94 (3.64–4.27) | 3.56 (3.10–4.10) | <.0001 | 2.79 (2.42–3.22) | <.0001 |
| Unknown | 305 | 15614.1 | 1.95 (1.75–2.19) | — | — | ||
| Weight-for-age z scorea | |||||||
| Greater than −2.0 | 269 | 46428.6 | 0.58 (0.51–0.65) | 1.00 | 1.00 | ||
| −2.0 to −3.0 | 192 | 15398.2 | 1.25 (1.08–1.44) | 1.93 (1.60–2.32) | <.0001 | 1.72 (1.43–2.08) | <.0001 |
| Less than −3.0 | 921 | 16107.2 | 5.72 (5.36–6.10) | 7.86 (6.86–9.01) | <.0001 | 5.83 (5.07–6.71) | <.0001 |
| Unknown | 106 | 2573.6 | 4.12 (3.40–4.98) | — | — | ||
| Hemoglobin concentrationa | |||||||
| Normal | 334 | 40680.2 | 0.82 (0.74–0.91) | 1.00 | 1.00 | ||
| Anemic | 654 | 16568.0 | 3.95 (3.66–4.26) | 2.82 (2.47–3.23) | <.0001 | 1.73 (1.50–2.00) | <.0001 |
| Unknown | 500 | 23259.3 | 2.15 (1.97–2.35) | — | — | ||
| Year of ART initiationa | |||||||
| 2006 | 183 | 13682.6 | 1.34 (1.16–1.55) | 1.00 | 1.00 | ||
| 2007 | 217 | 13233.4 | 1.64 (1.44–1.87) | 1.11 (0.91–1.35) | .3104 | 1.11 (0.91–1.35) | .3167 |
| 2008 | 248 | 12343.5 | 2.01 (1.77–2.28) | 1.23 (1.02–1.49) | .0310 | 1.30 (1.07–1.58) | .0072 |
| 2009 | 203 | 12664.5 | 1.60 (1.40–1.84) | 0.89 (0.73–1.08) | .2458 | 0.96 (0.78–1.18) | .7004 |
| 2010 | 216 | 10992.3 | 1.97 (1.72–2.25) | 0.94 (0.77–1.14) | .5226 | 1.04 (0.85–1.27) | .6978 |
| 2011 | 171 | 8816.3 | 1.94 (1.67–2.25) | 0.78 (0.64–0.97) | .0224 | 0.93 (0.75–1.15) | .5001 |
| 2012 | 114 | 4931.5 | 2.31 (1.92–2.78) | 0.75 (0.60–0.95) | .0174 | 0.87 (0.68–1.10) | .2478 |
| 2013 | 80 | 2402.3 | 3.33 (2.67–4.15) | 0.87 (0.67–1.13) | .3047 | 0.82 (0.63–1.06) | .1339 |
| 2014 | 46 | 1095.3 | 4.20 (3.15–5.61) | 0.81 (0.59–1.13) | .2132 | 0.79 (0.57–1.09) | .1573 |
| 2015–2016 | 10 | 345.8 | 2.89 (1.56–5.37) | 0.48 (0.25–0.91) | .0245 | 0.44 (0.23–0.83) | .0113 |
| Regiona | |||||||
| East Africa | 670 | 33629.3 | 1.99 (1.85–2.15) | 1.00 | 1.00 | ||
| West Africa | 359 | 9906.2 | 3.62 (3.27–4.02) | 2.11 (1.86–2.40) | <.0001 | 1.50 (1.30–1.74) | <.0001 |
| Central Africa | 76 | 6293.2 | 1.21 (0.96–1.51) | 0.74 (0.58–0.93) | .0110 | 0.83 (0.64–1.06) | .1368 |
| Southern Africa | 100 | 12525.7 | 0.80 (0.66–0.97) | 0.46 (0.37–0.57) | <.0001 | 0.29 (0.22–0.37) | <.0001 |
| Asia Pacific | 283 | 18153.2 | 1.56 (1.39–1.75) | 1.14 (0.99–1.32) | .0642 | 0.86 (0.73–1.02) | .0803 |
Dash indicates that an OR or HR has been omitted (as explained in the Methods (3.36)).
Abbreviations: ART, antiretroviral therapy; CI, confidence interval; HR, (subdistribution) hazard ratio.
aIncluded in the final model.
bWhere weight-for-age z score was substituted by height-for-age z score in the multivariate model.
Co-trimoxazole Cessation After ART Initiation
Factors associated with co-trimoxazole cessation after ART initiation are described in Supplementary Table 2. Hazards of co-trimoxazole cessation were higher for children in Asia Pacific (HR, 10.60 vs East Africa [95% CI, 9.85–11.40]; P < .0001) and Southern Africa (HR, 18.64 vs East Africa [95% CI, 16.90–20.55]; P < .0001) than for those in other regions. Older age also was associated with a higher hazard of co-trimoxazole cessation (HR, 1.28 for ≥10 vs 1 to <5 years of age [95% CI, 1.17–1.39]; P < .0001), whereas a low hemoglobin concentration (HR, 0.79 vs normal hemoglobin concentration [95% CI, 0.74–0.85]; P < .0001), severe immunodeficiency (HR, 0.48 vs no severe immunodeficiency [95% CI, 0.45–0.51]; P < .0001), and later year of ART initiation (HR, 0.43 for 2015–2016 vs 2006 [95% CI, 0.30–0.63]; P < .0001) were associated with lower hazards of cessation.
DISCUSSION
Full implementation of the WHO guidelines on co-trimoxazole use in people with HIV has proven challenging. In 2010, it was estimated that 71% of the HIV-infected population eligible for co-trimoxazole were receiving it [5]. Our estimate of co-trimoxazole coverage among children initiating ART in resource-limited countries of Africa and Asia was similar (73.6%). In those with severe immunodeficiency, for whom co-trimoxazole is strongly indicated, coverage was slightly higher (81.3%). Many of the factors found to be associated with co-trimoxazole use suggest that there is a higher prevalence of use in children with an elevated risk of opportunistic infection and death while receiving ART. However, even after we adjusted for these factors and regional differences in co-trimoxazole use, we found a clear trend toward increasing use between 2006 and 2010, followed by a consistent decline.
This result could be explained by a growing awareness of early research that has supported the wide-scale use of co-trimoxazole in children with HIV [9, 23], followed by a shift toward immediate ART initiation, which has resulted in fewer children presenting for treatment with advanced disease [24]. When we restricted our analysis to children with severe immunodeficiency at ART initiation, the trend toward reduced use in later years persisted. However, because our definition of severe immunodeficiency was rather crude, it is possible that children who met this definition in later years of the analysis were clinically stable more often than those who met the definition earlier. Despite a low CD4 level, clinically stable children are less likely to receive co-trimoxazole. Another explanation could be that recent changes to local guidelines are being driven by concerns about the cost, long-term adverse effects, and drug resistance accumulation associated with co-trimoxazole along with reductions in the local prevalence of infectious diseases against which co-trimoxazole protects.
The optimal time to stop co-trimoxazole prophylaxis in HIV-infected children who live in a resource-limited setting remains uncertain [1]. Our analysis revealed that younger children, those with anemia, and those with severe immunodeficiency had a low hazard of cessation. Co-trimoxazole might mitigate the high rates of death associated with these factors [25], making prescribers reluctant to cease co-trimoxazole when any of them are present. Although co-trimoxazole causes myelosuppression, anemia is an uncommon adverse effect and should not prompt co-trimoxazole cessation until other more likely causes have been eliminated [26, 27]. Interesting to note is that Southern Africa and Asia Pacific had much higher hazards of co-trimoxazole cessation than other regions. The only country to contribute data to the cessation analysis from Southern Africa was South Africa, which has an upper-middle-income economy, and all countries represented in the Asia Pacific cohort were middle-income countries. In contrast, the East Africa, West Africa, and Central Africa cohorts predominantly comprised low-income countries. The difference in income statuses between these 2 groups might be reflected in their local HIV-treatment protocols. Although low-income countries might be conservative about co-trimoxazole cessation because of concerns about maintaining a continuous supply of ART, high local prevalence of infectious diseases, or capacity to undertake routine CD4 monitoring, middle-income countries might prioritize more expensive but strongly recommended interventions, such as routine viral load monitoring. Our adjusted analysis also revealed a trend toward lower hazards of cessation in more recent years, which potentially is indicative of recent guidelines recommending prolonged co-trimoxazole use and drug-supply systems improving over time across sites that participate in the IeDEA.
Consistent with our results, younger age, anemia, severe immunodeficiency, low height-for-age and weight-for-age z scores, nonuse of co-trimoxazole, and both temporal and regional factors have been shown previously to be associated with death in children with HIV [25, 28, 29]. Although it is recommended that children in a high-income area cease co-trimoxazole after immune recovery because of the low risk of Pneumocystis pneumonia [12], the ARROW trial found a lower risk of death or hospitalization (combined outcome) with continued co-trimoxazole prophylaxis in children living in sub-Saharan Africa who were stable on ART. This effect, which was driven by a difference in hospitalization rates, was observed regardless of whether malaria was endemic locally [8]. A later substudy of the ARROW trial also found that continued co-trimoxazole use was protective against incident tuberculosis [30]. The protective effect of co-trimoxazole against serious infections in children who were doing well on ART did not translate to a survival benefit in our cohort. Our results also suggest that the benefit of co-trimoxazole on survival in children with severe immunodeficiency is not related to this group having a low nadir CD4 level. Children with a history of severe immunodeficiency (and therefore a low nadir CD4 level) whose immune function was restored with ART and who contributed follow-up time to the non–severely immunodeficient group did not cause us to observe an association between co-trimoxazole use and improved survival among non–severely immunodeficient children. We believe that our findings warrant further investigation.
Our study had several limitations. As an observational analysis, co-trimoxazole use was not randomized, and we cannot rule out the influence of unmeasured factors such as the local prevalence of infectious disease, the use of other prophylactic treatments, breastfeeding practices, and clinical disease severity. It is possible that children who were clinically unwell, regardless of their CD4 level, were more likely to be using co-trimoxazole, which might have attenuated any mortality benefit of co-trimoxazole in children without severe immunodeficiency. However, the same could also be said for our severe immunodeficiency group, among whom the reduced hazard of death with co-trimoxazole was consistent with clinical trial data gathered predominantly from children with a low CD4 level [9]. We did not have access to data on serious infections and hospitalizations, so we could not assess morbidity as an analysis outcome. Such an analysis would have aided comparison of our results with those of the ARROW trial and other studies that evaluated the benefit of co-trimoxazole in reducing illness among children living with HIV. Because we included sites that collected co-trimoxazole data using start and stop dates and those that collected only prescription dates, we had to apply a heterogeneous definition of co-trimoxazole use. When the analysis was restricted to children with co-trimoxazole start and stop dates, the overall prevalence of co-trimoxazole use at ART initiation (85.1%) was higher than our primary estimate (73.6%). However, this result was driven by a high proportion of data from East Africa (where the overall prevalence of co-trimoxazole use exceeded 95%) in the restricted analysis. In our analysis of children with severe immunodeficiency at ART initiation, in which the regions were represented more evenly, the prevalences of co-trimoxazole use were similar between the main and restricted analyses (81.3% and 85.5% [data not shown], respectively). Some patients in our analysis were missing data for key variables, which could have introduced biases that caused us to overestimate or underestimate effects. Encouraging, however, is that our sensitivity analyses using imputed data produced findings similar to those of the main analyses.
Our results highlight the recent global decline in co-trimoxazole use among children initiating ART. This trend does not seem to be associated with the current shift toward early ART initiation. Despite the recent decrease in co-trimoxazole use, rates of cessation while on ART have slowed with time. Randomized clinical trial data might be needed to establish the survival benefit of co-trimoxazole in children without severe immunodeficiency to support recommendations for indefinite use.
Supplementary Data
Supplementary materials are available at Journal of the Pediatric Infectious Diseases Society online.
Author contributions. D. C. B. conceived of and carried out the analysis and drafted the manuscript; M. G. L., A. H. S., A. K., M-A. D., K. W.-K., V. L., M. Y., and A. E. provided critical input to the design of the analysis and helped draft the manuscript; M. V., R. V., M. A.-F., G. F., J. B., L. R., and A. A. helped draft the manuscript; and all the authors read and approved the final submission.
Acknowledgments. We thank the following for their contribution to this study: East Africa: L. Diero, S. Ayaya, and E. Sang (MOI University, AMPATH Plus, Eldoret, Kenya), E. Bukusi, Charles Karue Kibaara, and Elisheba Mutegi (KEMRI, Kenya Medical Research Institute, Kisumu, Kenya), John Ssali and Mathew Ssemakadde (Masaka Regional Referral Hospital, Masaka, Uganda), Fred Nalugoda and Francis X. Wasswa (Rakai Health Sciences Program, Kalisizo, Uganda), G. R. Somi and Joseph Nondi (NACP [National AIDS Control Program], Dar es Salaam, Tanzania), Rita Elias Lyamuya and Francis Mayanga (Morogoro Regional Hospital, Morogoro, Tanzania), Kapella Ngonyani and Jerome Lwali (Tumbi Regional Hospital, Pwani, Tanzania), Mark Urassa, Denna Michael, and Richard Machemba (National Institute for Medical Research [NIMR], Kisesa HDSS, Mwanza, Tanzania), and Kara Wools-Kaloustian, Constantin Yiannoutsos, Rachel Vreeman, and Beverly Musick (Indiana University School of Medicine, Indiana University, Indianapolis, Indiana); West Africa: Sikiratou Adouni Koumakpai-Adeothy (CNHU, Cotonou, Benin), Lorna Awo Renner (Korle Bu Hospital, Accra, Ghana), Sylvie Marie N’Gbeche (ACONDA CePReF, Abidjan, Ivory Coast), Clarisse Amani Bosse (ACONDA_MTCT+, Abidjan), Kouadio Kouakou (CIRBA, Abidjan), Madeleine Amorissani Folquet (CHU de Cocody, Abidjan), François Tanoh Eboua (CHU de Yopougon, Abidjan), Fatoumata Dicko Traore (Hopital Gabriel Toure, Bamako, Mali), Elom Takassi (CHU Sylvanus Olympio, Lomé, Togo), François Dabis, Elise Arrive, Eric Balestre, Renaud Becquet, Charlotte Bernard, Shino Chassagne Arikawa, Alexandra Doring, Antoine Jaquet, Karen Malateste, Elodie Rabourdin, and Thierry Tiendrebeogo (ADERA, Isped and INSERM U1219, Bordeaux, France), Sophie Desmonde, Julie Jesson, and Valeriane Leroy (INSERM 1027, Toulouse, France), and Didier Koumavi Ekouevi, Jean-Claude Azani, Patrick Coffie, Abdoulaye Cissé, Guy Gnepa, Apollinaire Horo, Christian Kouadio, and Boris Tchounga (PACCI, CHU Treichville, Abidjan); Central Africa: Nimbona Pélagie (ANSS, Burundi), Patrick Gateretse, Jeanine Munezero, Valentin Nitereka, Théodore Niyongabo, and Christelle Twizere (Centre National de Reference en Matiere de VIH/SIDA, Burundi), Hélène Bukuru and Thierry Nahimana (CHUK, Bujumbura, Burundi), Jérémie Biziragusenyuka and Risase Scholastique Manyundo (HPRC, Bujumbura), Kien Atsu and Tabeyang Mbuh (Bamenda Hospital, Cameroon), Rogers Ajeh, Mark Benwi, Anastase Dzudie, Akindeh Mbuh, Marc Lionel Ngamani, and Victorine Nkome (CRENC and Douala General Hospital, Cameroon), Djenabou Amadou, Eric Ngassam, and Eric Walter Pefura Yone (Jamot Hospital, Cameroon), Alice Ndelle Ewanoge, Norbert Fuhngwa, and Chris Moki (Limbe Regional Hospital, Cameroon), Catherine Akele, Faustin Kitetele, Patricia Lelo, and Martine Tabala (Kalembelembe Pediatric Hospital, Democratic Republic of Congo), Emile Wemakoy Okitolonda and Landry Wenzi (Kinshasa School of Public Health, Democratic Republic of Congo), Merlin Diafouka, Martin Herbas Ekat, and Dominique Mahambou Nsonde (CTA Brazzaville, Republic of Congo), Adolphe Mafou (CTA Pointe-Noire, Republic of Congo), Fidele Ntarambirwa (Bethsaida Hospital, Rwanda), Yvonne Tuyishimire (Busanza Health Center, Rwanda), Theogene Hakizimana and Gahanga Health Center (Rwanda), Josephine Ayinkamiye (Gikondo Health Center, Rwanda), Sandrine Mukantwali (Kabuga Health Center, Rwanda), Henriette Kayitesi and Olive Uwamahoro (Kicukiro Health Center, Rwanda), Viateur Habumuremyi (Masaka Health Center, Rwanda), Joyce Mukamana (Nyarugunga Health Center, Rwanda), Jean Claude Dusingize, Gallican Kubwimana, Pacifique Mugenzi, Benjamin Muhoza, Athanase Munyaneza, Emmanuel Ndahiro, Diane Nyiransabimana, Jean d’Amour Sinayobye, and Vincent Sugira (Rwanda Military Hospital, Rwanda), and Chantal Benekigeri, and Gilbert Mbaraga (WE-ACTx Health Center, Rwanda); United States: Adebola Adedimeji, Kathryn Anastos, Madeline Dilorenzo, Lynn Murchison, and Jonathan Ross (Albert Einstein College of Medicine, Bronx, New York), Diane Addison, Meg Baker, Ellen Brazier, Heidi Jones, Elizabeth Kelvin, Sarah Kulkarni, Denis Nash, and Olga Tymejczyk (City University of New York [CUNY], School of Public Health, New York, New York), Batya Elul (Columbia University, New York, New York), Xiatao Cai, Don Hoover, Hae-Young Kim, Chunshan Li, and Qiuhu Shi (Data Solutions, Wixom, Michigan), Kathryn Lancaster and Marcel Yotebieng (Ohio State University, Columbus, Ohio), Mark Kuniholm (University at Albany, State University of New York, Albany, New York), Andrew Edmonds and Angela Parcesepe (University of North Carolina at Chapel Hill, Chapel Hill, North Carolina), Stephany Duda (Vanderbilt University School of Medicine, Nashville, Tennessee), April Kimmel (Virginia Commonwealth University School of Medicine, Richmond, Virginia), and Margaret McNairy (Weill Cornell Medical Center, New York, New York); Southern Africa: Gary Maartens (Aid for AIDS, South Africa), Michael Vinikoor (Centre for Infectious Disease Research in Zambia [CIDRZ], Zambia), Monique van Lettow (Dignitas, Malawi), Robin Wood (Gugulethu ART Programme, South Africa), Nosisa Sipambo (Harriet Shezi Clinic, South Africa), Frank Tanser (Africa Centre for Health and Population Studies [Hlabisa], South Africa), Andrew Boulle (Khayelitsha ART Programme, South Africa), Geoffrey Fatti (Kheth’Impilo, South Africa), Sam Phiri (Lighthouse Clinic, Malawi), Cleophas Chimbetete (Newlands Clinic, Zimbabwe), Karl Technau (Rahima Moosa Mother and Child Hospital, South Africa), Brian Eley (Red Cross Children’s Hospital, South Africa), Josephine Muhairwe (SolidarMed, Lesotho), Anna Jores (SolidarMed Mozambique), Kamelia Kamenova (SolidarMed Zimbabwe), Matthew P. Fox (Themba Lethu Clinic, South Africa), Hans Prozesky (Tygerberg Academic Hospital, South Africa), Nina Anderegg, Marie Ballif, Julia Bohlius, Cam Ha Dao Ostinelli, Frédérique Chammartin, Matthias Egger, Lukas Fenner, Per von Groote, Andreas Haas, Taghavi Katayoun, Eliane Rohner, Adrian Spörri, Gilles Wandeler, Elizabeth Zaniewski, and Kathrin Zürcher (Institute of Social and Preventive Medicine, University of Bern, Bern, Switzerland), Andrew Boulle, Morna Cornell, Mary-Ann Davies, Victoria Iyun, Nicola Maxwell, Leigh Johnson, Patience Nyakato, Gem Patten, Michael Schomaker, and Priscilla Tsondai (School of Public Health and Family Medicine, University of Cape Town, South Africa); Asia Pacific: P. S. Ly* and V. Khol (National Centre for HIV/AIDS, Dermatology and STDs, Phnom Penh, Cambodia), J. Tucker (New Hope for Cambodian Children, Phnom Penh), N. Kumarasamy* and E. Chandrasekaran (YRGCARE Medical Centre, CART CRS, Chennai, India), D. K. Wati,* D. Vedaswari, and I. B. Ramajaya (Sanglah Hospital, Udayana University, Bali, Indonesia), N. Kurniati* and D. Muktiarti (Cipto Mangunkusumo–Faculty of Medicine Universitas Indonesia, Jakarta, Indonesia), S. M. Fong,* M. Lim, and F. Daut (Hospital Likas, Kota Kinabalu, Malaysia), N. K. Nik Yusoff,*‡ and P. Mohamad (Hospital Raja Perempuan Zainab II, Kelantan, Malaysia), T. J. Mohamed* and M. R. Drawis (Pediatric Institute, Hospital Kuala Lumpur, Kuala Lumpur, Malaysia), R. Nallusamy* and K. C. Chan (Penang Hospital, Penang, Malaysia), T. Sudjaritruk,* V. Sirisanthana, and L. Aurpibul (Department of Pediatrics, Faculty of Medicine, and Research Institute for Health Sciences, Chiang Mai University, Chiang Mai, Thailand), R. Hansudewechakul,* P. Ounchanum, S. Denjanta, and A. Kongphonoi (Chiangrai Prachanukroh Hospital, Chiang Rai, Thailand), P. Lumbiganon,*† P. Kosalaraksa, P. Tharnprisan, and T. Udomphanit (Division of Infectious Diseases, Department of Pediatrics, Faculty of Medicine, Khon Kaen University, Khon Kaen, Thailand), G. Jourdain (PHPT-IRD UMI 174 [Institut de recherche pour le développement and Chiang Mai University], Chiang Mai, Thailand), T. Puthanakit,* S. Anugulruengkit, W. Jantarabenjakul, and R. Nadsasarn (Department of Pediatrics, Faculty of Medicine and Research Unit in Pediatric and Infectious Diseases, Chulalongkorn University, Bangkok, Thailand), K. Chokephaibulkit,* K. Lapphra, W. Phongsamart, and S. Sricharoenchai (Department of Pediatrics, Faculty of Medicine Siriraj Hospital, Mahidol University, Bangkok), K. H. Truong,* Q. T. Du and C. H. Nguyen (Children’s Hospital 1, Ho Chi Minh City, Vietnam), V. C. Do,* T. M. Ha, and V. T. An (Children’s Hospital 2, Ho Chi Minh City), L. V. Nguyen,* D. T. K. Khu, A. N. Pham, and L. T. Nguyen (National Hospital of Pediatrics, Hanoi, Vietnam), O. N. Le (Worldwide Orphans Foundation, Ho Chi Minh City), A. H. Sohn,* J. L. Ross, and C. Sethaputra (TREAT Asia/amfAR–The Foundation for AIDS Research, Bangkok), and D. A. Cooper, M. G. Law,* and A. Kariminia, The Kirby Institute, University of New South Wales, Sydney, Australia (*, steering committee members; †, current steering committee chair; ‡, co-chair).
Disclaimer. The content of this manuscript is solely the responsibility of the authors and does not necessarily represent the official views of the abovementioned funding bodies.
Funding. The IeDEA is supported by the National Institute of Allergy and Infectious Diseases (100000060), the Eunice Kennedy Shriver National Institute of Child Health and Human Development (100009633), the National Institute on Drug Abuse (100000026), the National Cancer Institute (100000054), and the National Institute of Mental Health (100000025) in accordance with the regulatory requirements of the National Institutes of Health under award numbers U01AI069911 (East Africa), U01AI069919 (West Africa), U01AI096299 (Central Africa), U01AI069924 (Southern Africa), and U01AI069907 (Asia Pacific). The Kirby Institute (data center for the IeDEA Asia Pacific) is funded by the Australian Government Department of Health and Ageing (501100001027) and is affiliated with the Faculty of Medicine, University of New South Wales (Sydney, Australia).
Potential conflicts of interest. D. C. B. has received research funding from Gilead Sciences; M. G. L. has received unrestricted grants from Boehringer Ingelhiem, Gilead Sciences, Merck Sharp & Dohme, Bristol-Myers Squibb, Janssen-Cilag, and ViiV HealthCare and consultancy fees from Gilead Sciences and data and safety monitoring board sitting fees from Sirtex Pty Ltd; and A. H. S. has received research funding and travel support from ViiV Healthcare. All other authors: No reported conflicts of interest. All authors have submitted the ICMJE Form for Disclosure of Potential Conflicts of Interest. Conflicts that the editors consider relevant to the content of the manuscript have been disclosed.
References
IeDEA Pediatric Working Group. A Survey of Paediatric HIV Programmatic and Clinical Management Practices in Asia and Sub‐Saharan Africa—the International Epidemiologic Databases to Evaluate AIDS (IeDEA) 2013; 16:17998.
