


Abstract
This study examined how family factors impacted parents’ attitudes toward integrated behavioral health (IBH) in pediatric primary care during the COVID-19 pandemic. We hypothesized that COVID-19 impact would predict family functioning challenges, and that pre-existing familial contextual factors would predict parents’ interest in IBH modalities.
Parents of children ages 1.5–5 years (N = 301) from five primary care clinics completed a survey with measures assessing familial contextual factors (income, race and ethnicity, and parents’ childhood adversity), COVID-19 impact on family relationships and wellbeing, family functioning (child behavior, parenting self-efficacy, and parent psychological functioning), and parents’ preferences for behavioral support in primary care. A subsample of parents (n = 23) completed qualitative interviews to provide deeper insights into quantitative relationships.
Higher COVID-19 impact was significantly associated with worse parent mental health and child behavior problems, as well as lower interest in IBH virtual support options. Overall, lower SES and racial and/or ethnic minority parents both indicated greater interest in IBH modalities compared to higher SES and White parents, respectively. Qualitative interviews identified how pandemic stressors led to increases in parents’ desire for behavioral support from pediatricians, with parents sharing perspectives on the nature of support they desired, including proactive communication from providers and variety and flexibility in the behavioral supports offered.
Findings have important implications for the provision of behavioral supports for families in primary care, underlying the need to increase parents’ access to IBH services by proactively providing evidence-based resources and continuing to offer telehealth support.
Introduction
The novel coronavirus disease 2019 (COVID-19) pandemic has greatly impacted families in the United States (U.S.; Patrick et al., 2020). Parents of young children have faced multiple challenges including increased psychological stress, disruptions to routines, and financial instability (Adams et al., 2021; Brown et al., 2020). In the early stages of the pandemic, Prime et al. (2020) proffered a conceptual framework of familial risk and resilience informed by prominent theories of human development. The framework posited that pandemic-related stressors (e.g., financial distress, increased child-rearing demands) would result in worsening parent mental health and parent–child interactions, such that child adjustment would be negatively impacted. The framework further specified that pre-existing characteristics, including economic hardship, racial or ethnic minority status, and history of adversity, would place certain families at higher risk for detrimental effects. Subsequent research has largely supported this model. Racial and ethnic minorities and families with lower income have disproportionately absorbed the brunt of the impacts of the pandemic (e.g., Sun et al., 2021; Tai et al., 2022), and caregivers’ mental health during the pandemic has been linked to early childhood adjustment problems over time (e.g., Robertson et al., 2021; Thompson et al., 2022). Numerous studies have documented increased negative parenting practices during the pandemic (Katz & Fallon, 2022), and some evidence indicates increased negative parenting is associated with parental history of adverse childhood experiences (ACEs; Clemens et al., 2021; Hails et al., 2022). Pandemic-induced familial dysfunction may be especially impactful on the social and emotional development of young children, given interruptions to child-rearing environments during sensitive developmental periods and the potential lifelong impact of early childhood stress (Rao & Fisher, 2021).
In the U.S., primary care is an important setting for promoting optimal development in early childhood (McCabe et al., 2020), with 14 well-visits recommended in the first 5 years of life (Hagan et al., 2017). As the first point of access for child healthcare, primary care in the U.S. is designed to be comprehensive, with providers trained to address health concerns, provide anticipatory guidance on physical and behavioral health promotion, monitor development, and screen for behavioral and medical disorders that commonly present during childhood (Boudreau et al., 2022). Integrated behavioral health (IBH) is a model of care through which behavioral health services are provided in coordination with traditional medical care. Early childhood IBH services in primary care are thought to be especially promising methods for improving population health, because they allow for problem identification and intervention during sensitive developmental periods, thus shifting developmental trajectories and preventing significant problems later in life (Ader et al., 2015; McCabe et al., 2020). Researchers have developed a number of promising methods for addressing early child behavioral health concerns in primary care (Brown et al., 2018), and IBH interventions have been shown to effectively address early childhood mental health concerns (e.g., Berkovits et al., 2010) and promote healthy parent–child interactions to mitigate the impacts of stress (e.g., Minkovitz et al., 2007). In addition to being effective, evidence indicates that IBH increases access to mental health services compared with traditional referral mechanisms, especially for minoritized families (Burkhart et al., 2020). As such, IBH services are potentially well-suited to support children and families in the wake of the COVID-19 pandemic and other events that threaten early childhood development (von Schulz et al., 2022). However, as is true of other forms of healthcare (Curfman et al., 2021), COVID-19 impacted the delivery of IBH in many settings, most markedly through a shift to telehealth and other remote forms of care (Chakawa et al., 2021). This was a significant change, as many of the purported advantages of IBH services are based on physical proximity to medical care (Stancin & Perrin, 2014).
Little research has examined how pandemic-induced changes in IBH care models affected patients’ access to care. One study found that following transition to telehealth services, IBH appointments were less well attended overall, and Black children were less likely than White children to have an appointment scheduled following referral (Chakawa et al., 2021), though the reason for this disparity was unclear. Given the potentially lasting impact of COVID-19 on the delivery of pediatric primary care (Fiks et al., 2021) as well as pre-pandemic research suggesting that parents’ preferences for IBH modalities are related to demographic and clinical risk factors (Riley et al., 2019, 2022), it is essential to understand factors that may influence families’ desire or ability to engage with evolving IBH services. For example, Riley et al. (2019) found that reported household income and use of corporal punishment both negatively predicted parents’ interest in IBH methods that involved in-person, synchronous interactions with providers (e.g., brief consultations during well-child care, co-located IBH visits), but did not predict interest in multimedia-based interventions (e.g., written materials, online programs). Importantly, that study did not directly assess attitudes toward telehealth-based IBH services. Considering the findings of Chakawa et al. (2021), it is critical to learn more about how the pandemic may have affected access to and utilization of behavioral health services, especially for minoritized families and other traditionally underserved groups. We previously reported that parents of young children reported increased interest in multimedia-based behavioral health resources during the pandemic (Petts et al., 2022), but no study has examined how parents’ attitudes toward different modalities of IBH varied by sociodemographic and clinical characteristics in the context of COVID-19.
Current Study
We conducted a mixed method study to better understand how family and child factors impact attitudes toward IBH delivery methods in a sample of parents of preschool-age children (ages 1.5–5 years old) during the COVID-19 pandemic. We focused on this age range because parents commonly seek initial behavioral health support for their toddler to preschool-age children (Axelrad et al., 2009), and behavior problems often emerge during this time (Briggs-Gowan et al., 2006).
Our quantitative approach was informed by Prime et al.’ (2020) conceptual framework of familial risk and resilience during the pandemic, and included measures of socio-demographic characteristics, pandemic impact on family functioning, parent mental health, parenting self-efficacy, parental ACEs, and child behavioral/emotional problems. We hypothesized that pre-existing familial contextual factors (racial or ethnic minority status, lower socioeconomic status [SES], and parental childhood adversity) and COVID-19 impact would predict interest in all modalities of IBH services, both directly and indirectly via child and family functioning variables (child behavior concerns, parenting self-efficacy, parent psychological functioning). The subsequent qualitative phase and mixed method analyses were designed to provide deeper insights into the factors that impact parents’ attitudes toward IBH by answering the following research questions: Research Question 1: What factors influenced parents’ attitudes toward IBH services in pediatric primary care during the pandemic? Research Question 2: How did the pandemic affect parents’ preferences for how IBH services are delivered?
Materials and Methods
This study was conducted through members of the Pediatric Integrated Primary Care Research Consortium (PIPCRC), a national collaborative of pediatric IBH researchers and clinicians with the mission of advancing the science and practice of pediatric integrated primary care. The PIPCRC was established by members of the Society of Pediatric Psychology’s Integrated Primary Care Special Interest Group (SIG) and the Collaborative Family Healthcare Association’s Pediatrics SIG. Most members are psychologists, but some physicians and non-psychologist mental health professionals have participated. Membership is open to anyone interested in pediatric IBH scholarship. See Supplementary Data 1 for more information.
Design
We used a sequential-explanatory design, such that qualitative data were collected after an initial quantitative analysis to expand and enrich understanding of the findings (Ivankova et al., 2006). The study was initially planned prior to the COVID-19 pandemic and designed to be a national replication of Riley et al.’s (2019) previous study of parents’ preferences for early childhood IBH services. However, subsequent to the onset of COVID-19, we determined that the original aims of the study were no longer valid, so we pivoted to examining parents’ perspectives within the context of the pandemic.
To identify collaborating sites, the senior author presented the study aims to PIPCRC members via teleconference, then extended invitations for participation based on geographic and patient demographic diversity. Pre-pandemic, individuals from six organizations representing 10 primary care clinics were invited to participate in the study. Initially, clinician-researchers from all of those institutions agreed to participate. However, the onset of COVID-19 affected human-subjects research to varying degrees across institutions, such that three of those institutions were unable to participate in a timely manner and were dropped from the study. Ultimately, five clinics from three organizations participated. Methods were approved by human subject institutional review boards at the participating institutions. Data are available on request.
Participants and Procedures
We recruited 301 English- and Spanish-speaking parents of children aged 1.5–5 years. To be eligible for inclusion, participants had to be at least 18 years of age and self-identify as the primary caregiver of a child in the target age range, with the child receiving care from one of the five primary care clinics participating in the study. The five clinics included one Federally Qualified Health Center family medicine clinic in Kansas, one pediatric clinic in an academic medical center in Oregon, and three community pediatric clinics affiliated with a hospital system in Ohio. The majority (66%) of participants came from the Oregon clinic, with an additional 11% from the Kansas clinic, and a combined 23% from the three Ohio clinics.
Clinician-researchers affiliated with the PIPCRC helped to engage each site in recruitment procedures. Parents were initially recruited between July 2020 and January 2021 to complete an online survey. We utilized a mix of patient portal (Oregon and Ohio clinics), in-person (Ohio clinics), and text message (Kansas clinic) recruiting strategies, partially dependent on each organization’s pandemic-related restrictions on research procedures. We attempted to contact parents of a total of 1,938 children across the five sites. At the Oregon clinic, 900 patient portal messages were sent to parents of children within the target age range who attended a recent well-child visit, with 198 participants (22% of total messages) ultimately participating in the study. At the Kansas clinic, a total of 549 text messages were sent to all parents of children in the target age range, with 32 parents (6% of those who were sent text messages) participating in the study from this site. At the Ohio clinics, we attempted to recruit a total of 489 parents from a combination of patient portal messages and in-clinic recruitment, with 71 (15% of those we attempted to recruit) participants from this site.
Parents were provided a link to an online eligibility screening and survey in REDCap (Harris et al., 2009). A total of 423 entries were created, 33 of which were determined to be ineligible for participation (reasons for ineligibility include sibling enrolled, duplicate entry, or child outside of target age range). Of the 390 eligible parents, 301 (77%) subsequently enrolled in the study and completed at least one measure. Participants who completed at least one measure were provided a $20 gift card.
A secondary round of recruitment was conducted from January 2021 to April 2021, during which a subsample of parents who had completed the survey were recruited to participate in qualitative interviews. All survey completers were compared on the basis of several demographic and family variables that we identified as potentially important in affecting families’ opinions on behavioral support in primary care during the pandemic. Demographic variables included race and ethnicity and income. Family variables included pandemic impact and child behavior concerns. We then used a maximum variation sampling approach to obtain a diverse interview sample, oversampling participants who identified as Hispanic and/or a race other than White, and who reported a lower income range. Over a 3-month period, 124 survey participants (41% of initial sample) were sent an email invitation to participate in the interview. One follow-up email was sent to parents who did not respond to the initial email. Of those survey parents who we invited to participate in the interview, 91 did not respond. Thirty-three parents responded with interest in participating. Of those, 10 participants did not respond to subsequent emails or phone calls to schedule the interview, or did not show up to a scheduled interview. As we aimed to complete 20–25 interviews, we continued to reach out to prospective interview participants via email until that goal was reached, with a total of 23 interviews completed. The interval between when a parent completed the internet survey and the qualitative interview ranged from 3 to 32 weeks (M = 17.1, SD = 9.8). Interview participants were compensated an additional $20 gift card.
All interviews were conducted in English due to lack of Spanish-speaking interviewers. Three of the authors conducted one-on-one interviews via videoconferencing platform using a semi-structured interview guide (Supplementary Data 2). Interviews were recorded and lasted 30–45 min. Two postdoctoral psychology fellows and one psychology intern, all of whom identified as White women, conducted the interviews.
Measures
Demographics
Each participating parent completed a demographics questionnaire including information on parent and child age, sex, racial and ethnic identity, family composition, parent education, and annual household income.
Preferences for Behavioral Support in Primary Care
The Behavioral Information Preferences Scale (BIPS) is a measure of parents’ preferences for primary care-based behavioral services (Riley et al., 2020). We utilized two of the three subscales of the Delivery Methods section of the BIPS, which prompts parents to rate interest in different modalities of behavioral guidance on a 5-point Likert-type scale (“not at all interested” to “very interested”): Auxiliary Care and Multimedia Resources. The 5-item Auxiliary Care subscale (α = 0.86 in this sample) captures interest in synchronous interactions with a medical or behavioral provider beyond typical well-child care to address child behavior (e.g., meeting with a behavioral consultant). The 9-item Multimedia Resources subscale (α = 0.88 in this sample) captures interest in media-based tools and asynchronous digital interactions with providers (e.g., books, handouts, websites, patient portals, etc.). The other two BIPS sections, Behavior Topics and Intervention Approach, were administered but not included in the current study. All BIPS subscales are scored by summing the scores for the items within each subscale.
We modified the BIPS in two ways to increase relevancy to the conditions of the COVID-19 pandemic. First, we added the phrase “during the COVID-19 pandemic or similar events” to the instructions for each section. Second, the original BIPS includes only one item on telehealth (“Talking to a behavioral expert over the phone.”), so to create a supplemental Virtual Care subscale, we added four items to capture parents’ interest in a broader spectrum of telehealth services, including virtual care (i.e., synchronous audio and video; α = 0.84 in this sample). Each of the new items modified an existing BIPS item. For example, the original BIPS item, “Attending group classes or seminars with other parents,” was addended to, “Attending virtual (audio and video) group classes or seminars with other parents.” The four original BIPS items, all of which were in the Auxiliary Care subscale, were maintained, with “in person” added to one of the original items to further differentiate from the virtual care counterpart.
COVID-19 Impact
The 10-item Impact Scale of the COVID-19 Exposure and Family Impact Survey (CEFIS-I; Kazak et al., 2021) measures the impact of COVID-19 on specific aspects of family relationships and emotional well-being using a 4-point Likert scale ([COVID-19 pandemic] “made it a lot better” to “made it a lot worse”). Scores on this scale represent a mean of scores on the 10 items and range from 1 to 4, with higher scores indicating worse impact. The Impact Scale has demonstrated strong psychometric properties (Enlow et al., 2022). Internal consistency in this sample was excellent (α = 0.94).
Parent Childhood Adversity
The 10-item ACEs Questionnaire assesses parents’ history of adversity (Murphy et al., 2016). Parents endorse yes/no items on their own ACEs during the first 18 years of life and endorsed items are summed to produce a total score. Internal consistency in this sample was good (α = 0.80).
Child Emotional/Behavioral Problems
We used the first 13 items of the 18-item Preschool Pediatric Symptom Checklist (PPSC; Sheldrick et al., 2012) to capture parents’ report of child emotional/behavioral problems. The PPSC is a well-validated tool designed for use in primary care that correlates well with longer instruments such as the Child Behavior Checklist (Achenbach, 1991; Sheldrick et al., 2012). Consistent with the bifactor model described by Sheldrick et al., we chose to use only the first 13 items, which directly assess child behavior. These items ask parents to report on whether their child exhibits specific behaviors (e.g., “fights with other children”) on a 3-point scale (“not at all” to “very much”). Scores were summed to produce a total score. Internal consistency was strong in this sample (α = 0.90).
Parenting Self-Efficacy
The short form of the Self-Efficacy for Parenting Tasks Inventory—Toddler Scale (SEPTI) was used to measure parenting self-efficacy (Coleman & Karraker, 2003). Parents answered 26 items using a 6-point Likert scale (“strongly disagree” to “strongly agree”) to endorse their perceived ability to influence their child’s behavior and development in four domains: nurturance, discipline, play, and routine. Scores are summed to create a total score. The short form version of the SEPTI has demonstrated good psychometric properties (Van Rijen et al., 2014). Internal consistency in this sample was good (α = 0.91).
Parent Mental Health
The depression and anxiety subscales from the Patient-Reported Outcomes Measurement Information System (PROMIS-29) were used to capture parents’ mental health (Cella et al., 2010). Each subscale contains four 5-point scale items, which ask parents to rate their experience of a symptom from “never” to “always.” Items were summed to create a total score for each scale. The PROMIS-29 has good reliability and validity (Cella et al., 2010). Internal consistencies for both subscales were good (α = 0.92 for both).
Spanish versions of all measures were already available. Any supplementary items or instructions were professionally translated.
Statistical Analysis
We conducted a series of three structural equation models (SEMs) using R statistical software, specifically, the lavaan package (Rosseel, 2012), to model predictors of interest in IBH delivery methods. Missing values for all models were handled using Full Information Maximum Likelihood (Arbuckle, 1996).
We used maximum likelihood estimation to determine model fit, which compares the observed data to the data estimated by the model. Because chi-square statistics can be affected by sample size (Roth et al., 2005), we used two other fit indices: The Comparative Fit Index (CFI) in which values range from zero to one, and higher values represent better fit (a value of >0.90 represents good fit); and the RMSEA, in which scores closer to zero represent better fit (a value of <.08 represents good fit; Kline, 2005). Where theoretically applicable, most scales were represented by a latent variable, modeled consistently with previous literature using similar methodology (Cordts et al., 2020). We additionally conducted an analysis of nested models to determine whether COVID-19 impact was an important factor in predicting delivery method preferences. A χ2 difference test was used to compare fit for nested models.
Qualitative and Mixed Method Analysis
Audio recordings of interviews were transcribed and entered into Atlas.ti version 7.0 for management and analysis. We used an immersion–crystallization process to analyze qualitative data (Borkan, 2022). Immersion–crystallization is an inductive, iterative process that can be used to identify themes in qualitative data. “Immersion” refers to the process of researchers becoming closely familiar with the collected data. “Crystallization” refers to the process of pausing immersion to identify patterns and themes, and to reflect on the immersion process itself. These two phases are alternated until analytic saturation occurs (i.e., no further meaningful patterns or insights emerge from the data with further analysis). To begin the analysis, four of the authors read several interview transcripts to identify text relevant to the research questions. Data were then reviewed and discussed in a group format to develop a list of codes and operational definitions. Each transcript was then coded independently by at least two study team members. Initial coding focused on categorizing topics of conversation. For example, passages were coded if they pertained to a particular method of IBH delivery (e.g., “virtual”). Subsequent rounds of coding focused on identifying prominent themes pertinent to the research questions. An iterative consensus coding process was used, such that coded transcripts were compared to identify and resolve any discrepancy via discussion.
Data Integration
For Research Question 2, qualitative findings were sorted based on participants’ quantitative characteristics to further explore relationships of interest identified in the quantitative analyses, specifically how SES, racial, and ethnic identity, and level of COVID-19 impact related to attitudes on IBH delivery. For example, to examine how themes differed by annual income, qualitative findings were sorted and contrasted across reported levels of annual income. For the PPSC and ACEs questionnaire, we used established cutoff scores for sorting qualitative data. To examine COVID-19 impact, participants with CEFIS-I scores ≥1 SD above the mean (based on the larger survey sample) were compared to those with scores below that level. Race and ethnicity data (identifying as White and non-Hispanic versus as a racial or ethnic minority) were similarly sorted and compared.
Results
Table I displays the participant characteristics for both the quantitative (N = 301) and qualitative (N = 23) phases of the study. In the quantitative sample, the mean score on the CEFIS-I (M = 2.82, SD = 0.66) was comparable (i.e., within one standard deviation) to the validation sample, which consisted of parents of children attending an ambulatory care visit (Enlow et al., 2022). This score approximately corresponds to the response “made it a little worse” with regard to the pandemic’s impact on parenting and parent wellbeing. On average, parents indicated concerns for their children’s behavior on the PPSC, with almost half of the sample (48%) exceeding the recommended cutoff score of 9 for the 18-item version of this scale (Sheldrick et al., 2012).
Participant Characteristics
| Characteristic | Survey Participants (N = 301) | Interview Participants (N = 23) |
|---|---|---|
| Parent | ||
| Age, years, M (SD) | 33.58 (7.10) | 31.65 (5.91) |
| Relationship to child, % | ||
| Biological or adoptive mother | 85 | 87 |
| Biological or adoptive father | 8 | 9 |
| Stepparent | 1 | 0 |
| Grandparent/other relative | 3 | 4 |
| Other/unknown | 3 | 0 |
| Race/Ethnicity, % | ||
| Hispanic/Latino | 12 | 22 |
| White, non-Hispanic/Latino | 56 | 22 |
| Asian | 14 | 22 |
| Black or African American | 15 | 22 |
| American Indian or Alaska Native | 2 | 4 |
| Native Hawaiian or Pacific Islander | 1 | 9 |
| Other/Unknown | 10 | – |
| Marital Status, % | ||
| Married | 67 | 44 |
| Divorced or separated | 9 | 17 |
| Never married | 24 | 39 |
| Number of children, M (SD) | 2.02 (1.17) | 1.91 (0.84) |
| Parenting situation, % | ||
| Single parenting | 16 | 43 |
| Couple parenting, same household | 78 | 52 |
| Co-parenting, separate households | 6 | 4 |
| Education, % | ||
| High school diploma or less | 17 | 13 |
| Vocational school/some college | 19 | 30 |
| College degree | 34 | 35 |
| Graduate/professional degree | 30 | 22 |
| Annual household income, % | ||
| $25,000 or less | 22 | 35 |
| $25,001–$49,999 | 20 | 17 |
| $50,000–$79,999 | 16 | 22 |
| $80,000–$119,999 | 11 | 4 |
| $120,000–$149,999 | 10 | 9 |
| $150,000 or more | 22 | 13 |
| Survey language preference: Spanish, % | 2 | N/A |
| Child | ||
| Age, years, M (SD) | 3.4 (1.20) | 3.77 (1.30) |
| Female sex, % | 49 | 57 |
Note. Parents were asked to report on their oldest child in the target age range.
Quantitative Results
Model Design
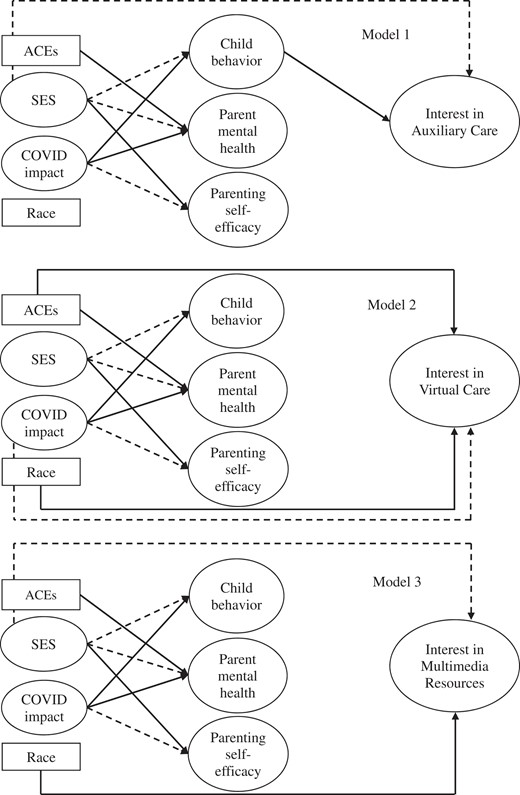
Several constructs of interest in the models were represented by latent variables. We modeled annual income and parent education to load onto a latent variable labeled “SES.” The 10 items from the CEFIS-I were modeled to load onto a “COVID Impact” latent variable, the 13 items from the PPSC loaded onto the child behavior problems latent variable, anxiety and depression subscales from the PROMIS-29 loaded onto a parent mental health latent variable, and the four SEPTI subscale totals loaded onto the parenting self-efficacy latent variable. For the BIPS latent variables, all items were modeled to load onto their respective subscale: BIPS-Auxiliary Care (AC), BIPS-Virtual Care (VC), and BIPS-Multimedia Resources (MR). Factor loadings were generally good and ranged from 0.50 to 0.90, except for three loadings on the PPSC which were between 0.39 and 0.49. Although the BIPS-VC latent variable was derived using questions that have not undergone factor analysis previously, loadings values were commensurate with those of the other BIPS subscales (virtual medical = 0.82, virtual separate = 0.90, virtual imbedded = 0.82, virtual group = 0.50, all statistically significant). Specific observed variables that made up latent variables and associated loadings are detailed in Supplementary Data 3. Additional observed variables included in the model were ACEs (total score) and race. Specifically, we use the term “race” to describe both race and ethnicity data and operationalize this variable as identifying as White and non-Hispanic versus as a racial or ethnic minority, given we did not have the statistical power to compare smaller racial or ethnic minority groups with one another. Categorized as such, race is an adequate proxy for concepts such as potential for discrimination in the healthcare system. The models were designed to examine the impact of broad family factors and specific parent and child behaviors on the three BIPS subscales, while controlling for relationships between predictor variables. The three models were thus identical except for the final outcome variables. Covariance relationships were modeled consistent with relationships expected based on a review of the literature, summarized in Supplementary Data 4. Model results are shown in Figure 1, full design is shown in Supplementary Data 5.
Model Results
Model Fit
Fit indices for each model were as follows: CFI = 0.83, RMSEA = .06 for Model 1 (BIPS-AC), CFI = 0.82, RMSEA = .07 for Model 2 (BIPS-VC), and CFI = 0.82, RMSEA = .06 for Model 3 (BIPS-MR). Each model had similarly adequate model fit: RMSEA in the good fit range and CFI slightly below the good fit range.
Covariances and Regression Relationships
Common Model Statistics
Because these relationships were modeled identically in all three models, the results across models were very similar. Statistical significance was virtually identical across all models. Regression slopes and covariances are displayed in Table II, and significant associations are depicted in Figure 1. Some notable relationships are as follows: Race was significantly correlated with SES and COVID-19 impact (White/Non-Hispanic associated with higher SES and lower impact). ACEs were significantly positively correlated with COVID-19 impact. Regarding regression relationships, COVID-19 impact was significantly positively associated with both parent mental health problems and child behavioral/emotional challenges. SES was significantly positively associated with parenting self-efficacy and negatively associated with both parent mental health problems and child emotional and behavioral challenges. Refer to Table II for an exhaustive listing of common model statistics.
Regression and Covariance Estimates for SEMs
| Variables | Model 1 (BIPS AC) | Model 2 (BIPS VC) | Model 3 (BIPS MR) | ||||||
|---|---|---|---|---|---|---|---|---|---|
| St. Est. | SE | p | St. Est. | SE | p | St. Est. | SE | p | |
| Parenting self-efficacy | |||||||||
| SES | 0.19 | 2.01 | .04 | 0.21 | 0.25 | .03 | 0.18 | 0.24 | .05 |
| ACEs | −0.02 | −0.28 | .78 | −0.02 | 0.13 | .89 | −0.03 | 0.13 | .75 |
| COVID-19 impact | −0.24 | −2.97 | .003 | −0.25 | 0.61 | .002 | −0.24 | 0.61 | .003 |
| Parent mental health | |||||||||
| SES | −0.32 | −4.05 | .000 | −0.31 | 0.18 | .000 | −0.32 | 0.16 | .000 |
| ACEs | 0.14 | 2.08 | .04 | 0.14 | 0.09 | .04 | 0.14 | 0.09 | .03 |
| Race | −0.05 | −0.88 | .38 | −0.04 | 0.36 | .42 | −0.05 | 0.36 | .37 |
| COVID-19 impact | 0.45 | 5.44 | .000 | −.246 | 0.52 | .000 | 0.45 | 0.52 | .000 |
| Child behavior | |||||||||
| SES | −0.27 | −3.09 | .002 | −0.28 | 0.18 | .000 | −0.27 | 0.01 | .002 |
| ACEs | 0.12 | 1.67 | .10 | 0.11 | 0.01 | .12 | 0.12 | 0.01 | .08 |
| Race | −0.05 | −0.92 | .36 | −0.05 | 0.02 | .36 | −0.05 | 0.02 | .36 |
| COVID-19 impact | 0.35 | 3.99 | .000 | 0.36 | 0.03 | .000 | 0.35 | 0.03 | .000 |
| Delivery method | |||||||||
| Parenting self-efficacy | −0.12 | −1.05 | .29 | −0.11 | 0.03 | .32 | 0.06 | 0.02 | .55 |
| Parent mental health | −0.14 | −1.19 | .23 | −0.10 | 0.04 | .40 | −0.01 | 0.03 | .95 |
| Child behavior | 0.20 | 2.07 | .04 | 0.18 | 0.50 | .06 | 0.06 | 0.36 | .48 |
| SES | −0.19 | −2.11 | .04 | 0.04 | 0.07 | .64 | −0.33 | 0.05 | .000 |
| Race | 0.03 | 0.50 | .62 | 0.12 | 0.13 | .05 | 0.12 | 0.10 | .05 |
| ACEs | 0.08 | 1.14 | .25 | 0.19 | 0.03 | .009 | 0.03 | 0.02 | .64 |
| COVID-19 impact | −0.15 | −1.74 | .08 | −0.21 | 0.18 | .02 | 0.01 | 0.13 | .92 |
| Covariances | |||||||||
| ACEs ∼ race | 0.00 | 0.04 | .96 | 0.00 | 0.07 | .97 | 0.00 | 0.07 | .98 |
| PROMIS anxiety ∼ CEFIS anxiety | 0.15 | 1.71 | .09 | 0.15 | 0.08 | .08 | 0.15 | 0.08 | .09 |
| PROMIS depression ∼CEFIS mood | 0.08 | 0.86 | .39 | 0.08 | 0.06 | .42 | 0.09 | 0.06 | .38 |
| SES ∼ race | −0.22 | −3.18 | .001 | −0.21 | 0.05 | .003 | −0.22 | 0.05 | .001 |
| COVID-19 impact ∼ race | −0.19 | −2.90 | .004 | −0.19 | 0.02 | .004 | −0.19 | 0.02 | .004 |
| SES ∼ ACEs | −0.34 | −4.74 | .000 | −0.35 | 0.25 | .000 | −0.33 | 0.26 | .000 |
| COVID-19 impact ∼ ACEs | 0.24 | 3.56 | .000 | 0.24 | 0.09 | .000 | 0.24 | 0.09 | .000 |
| COVID-19 impact ∼ SES | 0.16 | .059 | .03 | 0.16 | 0.06 | .03 | 0.16 | 0.06 | .03 |
| Parenting self-efficacy ∼ parent mental health | −0.53 | .947 | .000 | −0.53 | 0.95 | .000 | −0.53 | 0.95 | .000 |
| Parenting self-efficacy ∼ child behavior | −0.50 | .072 | .000 | −0.49 | 0.07 | .000 | −0.49 | 0.07 | .000 |
| Parent mental health ∼ child behavior | 0.30 | .042 | .001 | 0.25 | 0.04 | .001 | 0.29 | 0.04 | .001 |
Note. BIPS = Behavioral Information Preferences Scale; AC = Auxiliary Care; VC = Virtual Care; MR = Multimedia Resources; SES = Socioeconomic status; ACEs = Adverse childhood experiences; PROMIS = Patient-Reported Outcomes Measurement Information System; CEFIS = COVID-19 Exposure and Impact Scales.
Model 1: Interest in Auxiliary Care
Controlling for relationships between predictor variables, child emotional/behavioral problems positively predicted interest in Auxiliary Care (β = 0.20, p = .04) and SES negatively predicted interest (β = −0.19, p = .04).
Model 2: Interest in Virtual Care
Controlling for relationships between predictor variables, race was significantly associated with interest in Virtual Care, with racial and/or ethnic minority participants reporting higher interest (β = 0.12, p = .05). Parent ACEs were positively associated with Virtual Care interest (β = 0.19, p = .01) and COVID-19 impact was negatively associated with Virtual Care interest (β = −0.21, p = .02).
Model 3: Interest in Multimedia Resources
Controlling for relationships between predictor variables as outlined above, race was significantly associated with interest in Multimedia Resources such that racial and/or ethnic minority participants reported higher interest (β = 0.12, p = .05). SES was negatively associated with interest in Multimedia Resources (β = −0.33, p < .001). Other predictors were not significant.
Nested Models
To examine the importance of COVID-19 for model fit (i.e., whether COVID-19 impact significantly affected parent and child factors and preference for resources), we compared the original model to a model where we removed relationships between COVID-19 impact and other variables. For all models, removing the COVID-19 impact relationship significantly decreased model fit, suggesting that COVID-19 impact is an important factor in the model. Degrees of freedom difference for all models was 6, Model 1 chi-square difference = 84.01, p < .001, Model 2 chi-square difference = 86.43, p < .001, Model 3 chi-square difference = 79.05, p < .001.
Qualitative Results
Twenty-three parents participated in interviews. Of these, 6 (26%) reported at least one child with a special healthcare need, and 9 (39%) reported previous contact with IBH services.
Table III displays the identified themes, sub-themes, and indicative quotes for each research question. Text corresponding with each quote is denoted with “Q[#]” below.
Identified Themes, Sub-Themes, and Representative Quotes
| Research Question 1: What factors influenced parents’ attitudes toward IBH services during the pandemic? | |||
|---|---|---|---|
| Theme | Sub-theme | Representative quote | |
| Parenting demands | Child emotions/behaviors | Q1 | “She’s crying a lot more… the social worker at [clinic] thought it would be good for her to see a counselor because she’s been like, really just crying.” [P10] |
| Expanded roles | Q2 | “It was tough because I was expected to be a teacher, I work full time, I was sick, and then I’m also in school. So it was… it was a lot to try to balance.” [P5] | |
| Parenting capacity | Resources | Q3 | “You have a hyperactive child. There are no parks open. There are no indoor places open in the winter… You can’t go out and interact with social groups. Overnight, everything is just gone.” [P3] |
| Parent mental health | Q4 | “I had to increase my dose of depression medicine to maintain my ability to parent… If I can’t tolerate, then I’m getting angry and yelling and then the kids are upset by that, and then they’re fighting with each other. It’s like, one, horrible, snowball effect.” [P3] | |
| Uncertainty | Child impact | Q5 | “Will staying home all the time impact her mentally and socially? If it does, we still can’t really go out at this point, so what can we do at home to remedy that? Would more [video chatting] with others help? Would that not help?” [P16] |
| Healthcare ambiguity | Q6 | “I don’t really know what type of sessions we could even book if we didn’t have an actual physical concern. One of my first questions would be, ‘Oh, is this only for people who have really bad behavior?’” [P14] | |
| Research Question 2: How did the pandemic affect preferences for how IBH services are delivered? | |||
|---|---|---|---|
| Theme | Sub-theme | Representative quote | |
| Proactive communication | Service availability | Q7 | “Forgive my language, but parents are losing their shit. They don’t know which way is up, which way is down… So, send out resources. Somewhere in there, connecting and saying, ‘Did you know this resource was available? Did you know there was a behavioral health specialist available?” [P6] |
| Mitigating pandemic impact | Q8 | “How can I better protect my child? You know, keeping her at home but then also at the same time, providing her the social skills. You know, because I wanted to provide that for her, but I can’t because I want to protect her.” [P4] | |
| Practical strategies | Q9 | “At the start of the pandemic, they could have sent out an email. Maybe activities to do with kids at home. Little things of how to work on their behaviors and being stuck at home.” [P20] | |
| Ease of use | Comfort with technology | Q10 | “I use technology more than I did before. I’ve become more knowledgeable… It’s made me have to come out my little bubble of not wanting to learn how to do new things.” [P10] |
| Same-day access | Q11 | “If we’re already there, I’m going to take [IBH]. Having to come back with young kids, would just be kind of a hassle… I’d have to take more time out of my schedule.” [P8] | |
| Perceived utility | – | Q12 | “If the clinic thinks it’s safe, I’d be happy to meet in person. I think that would give the provider the richest information about our kiddo.” [P21] |
Note. IBH = integrated behavioral health; [P#] = participants in the order they were interviewed.
Research Question 1: What Factors Influenced Parents’ Attitudes Toward Integrated Behavioral Services in Pediatric Primary Care During the Pandemic?
Overall, parents expressed high desire for IBH services during the pandemic, undergirded by three main themes: Parenting Demands, Parenting Capacity, and Uncertainty.
Parenting Demands
Participants’ responses largely fell into two subthemes of mounting caregiving demands resulting from the pandemic. First, parents noted markedly increased child emotional and behavioral challenges that arose or were exacerbated by social isolation and other pandemic conditions (Q1). Parents noted a range of child concerns, including sadness, anxiety, irritability, clinginess, and disruptive behavior. Second, parents described an expansion of caregiving roles as other forms of childcare, particularly schools and daycares, were unavailable. Parents noted feeling overwhelmed as they were suddenly required to provide full-time caretaking and facilitate online schooling in addition to their other responsibilities (Q2).
Parenting Capacity
Concurrent with increased caregiving demands, parents often felt their capacity to meet those demands were diminished. Participants noted that previously helpful parenting strategies and resources were no longer available to them (Q3). For instance, some participants noted how the closure of parks, museums, and other child-friendly spaces limited their options for positive activities. Others felt they had become overly reliant on screens and electronics to manage child behavior due to a lack of other strategies. Beyond environmental limitations, parents expressed how challenges with their own mental health impacted their ability to parent (Q4). Participants described how the stressors of the pandemic impacted their frustration tolerance, which limited their ability to parent calmly and positively and led to increased negative parenting strategies.
Uncertainty
As parents were facing the child-rearing challenges described above, they also felt uncertain about whether and how to seek help. Some parents described worry about how the disruptions of the pandemic would impact their child’s development, and uncertainty about what to do in response (Q5). While these parents were generally desirous of professional guidance, they also communicated uncertainty about the availability and appropriateness of IBH services in the acute phases of the pandemic (Q6). This was exacerbated by a perception that medical providers and systems were overwhelmed, resulting in reluctance to inquire about behavioral care options.
Research Question 2: How Did the Pandemic Affect Preferences for How IBH Services Are Delivered?
We identified three key themes through the analysis of Research Question 2: Proactive Communication, Ease of Use, and Perceived Validity. Generally, these themes mirrored those identified for Research Question 1, in that parents wished to access information and services that would alleviate uncertainty and buoy their capacity to manage increased parenting demands in the context of pandemic life. Consistent with the overall high need for behavioral support, parents generally expressed openness to multiple modalities of IBH services, but also cited pros and cons of different options.
Proactive Communication
Parents emphasized a strong preference for proactive communication from primary care practices about the availability of IBH services and other behavior supports during the pandemic (Q7). Parents suggested phone calls, patient portals, and mailings as possible methods for such communication. In addition to information on available resources, parents were interested in pandemic-specific guidance, regarding both how to guard against the potential developmental impacts of pandemic conditions on young children (Q8), and practical strategies for managing pandemic-induced behavioral challenges, such as resistance to online schooling (Q9).
Ease of Use
Parents’ preferences for modality of IBH service were partially determined by perception of ease and convenience of access. Some parents expressed a preference for technology-based communication for healthcare, including patient portals and telehealth visits, because the pandemic had led to greater facility with those technologies (Q10). Parents were most enthusiastic about in-person IBH services that could be provided same-day as medical care, whereas returning for separate visits was viewed as inconvenient, especially given heightened health and safety protocols in medical settings (Q11).
Perceived Utility
Parents’ delivery method preferences also hinged on the perceived utility of different modalities for their child and family. For example, parents who preferred in-person options tended to perceive that direct child–provider interactions would allow for more meaningful assessment and intervention (Q12). By contrast, some parents preferred a virtual format because they perceived the home environment would provide a more valid representation of child behavior.
Mixed Method Results
Table IV summarizes the integration of quantitative and qualitative findings. With respect to the cross-model quantitative finding that COVID-19 impact and SES predicted child behavior, parent mental health, and parenting self-efficacy, we found high correspondence with the qualitative findings. While all parents communicated increased parenting demands during the pandemic, lower income parents reported comparatively less capacity to deal with those demands due to external factors (e.g., lack of low-cost childcare). Those parents described how a lack of options and resources contributed to self-perceived suboptimal parenting practices, resulting in greater distress and a lower sense of parenting self-efficacy. By contrast, higher income parents identified factors that facilitated their capacity to meet rising demands, including flexible employment and ability to engage childcare supports.
Joint Display of Integrated Results
| Quantitative Finding | Comparison Variables | Qualitative Findings | Exemplar Quote and Relevant Participant Characteristics |
|---|---|---|---|
| COVID-19 impact and SES predicted child behavior, parent mental health, and parenting self-efficacy (Models 1–3) | CEFIS-I Z-score ≥1; income <$50K/year |
|
|
| CEFIS-I Z-score <1; income ≥$50K/year |
|
| |
| SES and child behavior predicted interest in Auxiliary Care (Model 1) | Income <$50K/year; PPSC ≥9 |
|
|
| Income ≥$50K/year; PPSC <9 |
|
| |
| COVID-19 impact, parent ACEs, and race predicted interest in Virtual Care (Model 2) | CEFIS-I Z-score ≥1; ACEs ≥4; racial/ethnic minority |
|
|
| CEFIS-I Z-score <1; ACEs <4; racial/ethnic identity |
|
| |
| SES and Race predicted interest in Multimedia Resources (Model 3) | Income <$50K/year; racial/ethnic minority |
|
|
| Income ≥$50K/year; racial/ethnic majority |
|
|
Note. SES = socioeconomic status; CEFIS-I = COVID-19 Exposure and Family Impact Survey—Impact Scale; PPSC = Preschool Pediatrics Symptom Checklist; ACEs = adverse childhood experiences; IBH = integrated behavioral health; P[#] = participants in the order they were interviewed.
With respect to predictors of preference for specific modalities of IBH, we observed less congruence between quantitative and qualitative findings. For instance, in Model 1 SES and child behavior predicted interest in Auxiliary Care, but qualitative evidence that parents of children with elevated PPSC scores perceived synchronous, in-person services as holding greater utility was less consistent. Preferences for modality were otherwise driven by perceived ease of use and utility, but those perceptions did not appear to vary systematically by SES, racial and ethnic identity, parent ACEs, or COVID-19 impact.
Discussion
Predictors of IBH Preferences During the COVID-19 Pandemic
COVID-19 has undoubtedly changed the lives of families worldwide. Based on the framework of Prime et al. (2020), we fit SEMs to examine associations between COVID-19 impact and family and child factors as they related to interest in IBH. Findings suggest that COVID-19 impact both directly and indirectly impacted the relationship between family factors and preferences for IBH resources. As anticipated, and consistent with other research, our quantitative findings indicated that higher COVID-19 impact was associated with worse child behavior (Kerr et al., 2021), greater parent mental health problems (Gadermann et al., 2021), and lower parenting self-efficacy. Interview participants clearly articulated how those challenges, as well as a general uncertainty about appropriate child rearing during the pandemic, drove a desire for proactive and pragmatic guidance from their child’s primary care. However, few parents reported that they expected or sought this support from their child’s primary care team, with reasons including lack of knowledge of the availability of integrated and/or co-located behavioral support or the perception that doctors were already inundated with more pressing requests and concerns.
Surprisingly, with the exception of child behavior concerns predicting interest in Auxiliary Care, other family functioning variables did not directly predict interest in IBH delivery methods. By contrast, a pre-pandemic research study has indicated that factors such as parenting style and parenting self-efficacy are associated with interest in IBH modalities (Riley et al., 2019, 2020). It could be that during the pandemic, IBH behavioral supports became more attractive to parents with greater parenting self-efficacy and/or few mental health challenges because they experienced a sudden onset of new, pandemic-related parenting challenges and stressors. While we were unable to directly test this hypothesis, it is in line with our mixed method finding that parents experienced greater parenting demands and concerns about children’s social–emotional development during the pandemic regardless of participant characteristics.
Sociodemographic variables more consistently predicted IBH interest, with lower SES predicting greater interest in both Auxiliary Care and Multimedia Resources and identification as a racial or ethnic minority predicting higher preferences for Virtual Care and Multimedia Resources. Low-income parents’ greater interest in IBH modalities may be driven by the greater challenges they faced in accessing other options for support. Qualitative interviews highlighted the difficulty of caring for a young child full-time during a pandemic with reduced parenting resources, the negative effects of which were likely exacerbated for low-income families.
Racial and/or ethnic minority identity status predicted interest in and a preference for Virtual Care and Multimedia Resources, but identified themes underlying IBH preferences did not vary substantially by race in our mixed method analysis. There are several possible reasons for this discrepancy. First, while race was a statistically significant predictor in Models 2 and 3, the strength of those associations was modest. Further, while we recruited a diverse interview sample, it was difficult to stratify the sample in a manner that corresponded directly to the complex, multifactorial statistical models that were generated. Whereas our mixed method analyses drew comparisons across individual quantitative factors (e.g., income level), the statistical models considered all variables simultaneously, controlling for shared variance. The statistical findings may therefore reflect a level of intersectionality that we were unable to achieve in the mixed-method analysis, which may limit understanding of pandemic experiences (Kira et al., 2021). Second, it is possible our qualitative methods failed to detect important themes that vary across racial and ethnic lines. For example, some research indicates that individuals from historically marginalized racial and ethnic groups were more fearful of COVID-19 than White individuals (Niño et al., 2021), which could explain a preference for remote-based IBH, but this did not emerge as a prominent theme. All three of the interviewers identified as White, as did the members of the analytic team. Although none of the interview questions explicitly addressed race or ethnicity, some research suggests that sociodemographic features of interviewers may affect participants’ responses (West & Blom, 2017). Third, it should be noted that this study was conducted shortly after the murder of George Floyd (Eichstaedt et al., 2021) and other high-profile attacks on people of color in the U.S. (e.g., Tessler et al., 2020). These events and their sequelae profoundly affected many Americans, and it is unclear how the results may have varied if we had explicitly engaged participants regarding the impact of racial identity on care-seeking at the time of the study.
Clinical Implications
Although the acute phase of the pandemic may have passed, our findings have important implications for the provision of behavioral support for parents of young children in the pediatric primary care setting, particularly in the context of an ongoing mental health crisis (Benton et al., 2021) combined with a severe shortage of mental health providers (Auerbach & Miller, 2020). Findings underline the need to increase the accessibility of IBH services, particularly for parents of color and/or with low income. Strategies may include offering a range of telehealth and in-person care options, proactively providing evidence-based resources on behavioral topics (e.g., videos, websites, handouts) to families (Glascoe & Trimm, 2014), and connecting families with community services and resources (e.g., utility bill assistance, legal services, child care), which has been found to have beneficial effects on both child health and family wellbeing (Gottlieb et al., 2016). Proactive communication with families to build awareness of available supports and resources is particularly important during periods of community turmoil that are likely to result in increased family stress (e.g., future pandemic, natural disaster, economic recession), especially when those events also impact models of care delivery. This may require expanding teams and hiring personnel who specialize in health/family navigation, social work, psychology, and care coordination. Alternative payment models may be necessary to support services that do not fit within a traditional fee for service model (e.g., Ross et al., 2019).
Strengths, Limitations, and Future Directions
The current study has a number of strengths. The quantitative sample included participants from several different geographical areas of the U.S., and racial and ethnic minority participants and families with lower income were overrepresented in the qualitative sample. These strengths, and the findings in general, should be considered in the context of several limitations. The quantitative portion of this study was cross-sectional, so conclusions cannot be drawn regarding the direction of associations. For example, in our model the pathway in which COVID-19 impact predicts parent mental health was statistically significant, but it could also be that parent mental health challenges affected their perception of the impact of COVID-19 on their family functioning. The BIPS-VC subscale displayed good internal consistency, but was not previously validated with the rest of the BIPS, so it is unclear how the additional items may impact the overall factor structure of the Delivery Methods section. The qualitative interviews took place an average of approximately 4 months after participants completed the survey. Information related to the criteria used to select participants for the qualitative interview (e.g., pandemic impact, child behavior concerns) may have been outdated, as families’ contexts may have changed significantly during that time (e.g., children returned to in-person school, changes to caregivers’ employment situations). Parents involved in this study were predominantly mothers (85% of survey participants and 87% of interview participants), so our understanding of how fathers and other caregivers perceive COVID-19 stressors to have impacted their family functioning, and their preferences for IBH supports during the pandemic, is limited. Finally, parents were asked about their hypothetical preferences for and interest in various IBH modalities, but it is unclear the extent to which these reported preferences would predict actual service usage, especially given that fewer than half of participants in the qualitative interviews reported previous contact with IBH services. This is an important area for future research.
In conclusion, this study found that pre-existing family contextual factors were stronger predictors of parents’ preferences for IBH than family functioning variables. We also found that although parents generally did not expect or seek out behavioral support from their child’s primary care providers, they would have appreciated proactive communication and distribution of resources about managing child behavior during the pandemic, as well as continued flexibility in services offered (e.g., continuing to offer virtual visits). Findings from this study bolster a growing body of research on how the social disruptions of the COVID-19 pandemic challenged family functioning and highlight parents’ views on how primary care-based services could have helped mitigate challenges around child emotional and behavioral adjustment during the pandemic. Findings also highlight the importance of preventative models and anticipatory guidance for parents and families as part of their healthcare experience (e.g., Breitenstein et al., 2021; Snider et al., 2020). Specifically, this study illustrates the need to expand behavioral health services to children and caregivers during times of both unique and everyday stressors with the goal of mitigating child behavior concerns and other family functioning challenges. This may include increasing access to behavioral health personnel in the context of preventative care.
Author Contributions
Katherine A. Hails (Conceptualization [lead], Data curation [equal], Formal analysis [equal], Investigation [equal], Methodology [equal], Project administration [equal], Writing—original draft [lead], Writing—review & editing [equal]), Brianna C. Wellen (Data curation [equal], Formal analysis [lead], Methodology [lead], Writing—original draft [equal], Writing—review & editing [equal]), Marisa Simoni (Data curation [supporting], Project administration [supporting], Writing—original draft [supporting], Writing—review & editing [supporting]), Wendy M. Gaultney (Data curation [supporting], Investigation [supporting], Writing—original draft [supporting], Writing—review & editing [supporting]), Rachel A. Petts (Conceptualization [equal], Methodology [equal], Project administration [equal], Writing—original draft [supporting], Writing—review & editing [supporting]), Cody A. Hostutler (Conceptualization [equal], Methodology [equal], Project administration [equal], Writing—original draft [supporting], Writing—review & editing [supporting]), and Andrew R. Riley (Conceptualization [equal], Data curation [supporting], Formal analysis [supporting], Funding acquisition [lead], Investigation [lead], Methodology [lead], Project administration [lead], Writing—original draft [equal], Writing—review & editing [equal])
Supplementary Data
Supplementary data can be found at: https://dbpia.nl.go.kr/jpepsy.
Funding
This work was supported by the Agency for Healthcare Research and Quality (grant number K12HS022981), Health Resources and Services Administration (grant number D40HP26865), and the National Institutes of Health (grant numbers UL1GM118964 and RL5GM118963). The content is solely the responsibility of the authors and does not necessarily represent the official views of the funders.
Conflicts of interest: None declared.
