


Abstract
Since March 2020, millions of children have been confined to their homes and restricted from in-person activities, radically changing the dynamics of parent–child relationships. This study examines the association between coronavirus disease 2019 (COVID-19) impact and the mental health of parents and school-aged children; specifically, whether qualities of the parent–child relationship moderated the relationship between parents’ emotional health (EH) and children’s emotional and behavioral health (EBH).
Data from this Internet-based study of a community sample were collected in March–May 2020. Parents (N = 158, 92.4% White, 96.2% female) reported on COVID-19 impacts, their own EH, perceptions of their relationship with their eldest child between 6 and 12 years-old, and the EBH of that child.
Responses to questions about COVID-19 impact were assigned weighted values and used to create a COVID-19 impact scale. Hierarchical linear regressions revealed that greater COVID-19 impact was associated with greater parents’ EH issues only, and parents’ EH was a significant positive predictor of children’s EBH. Positive qualities and conflict in the parent–child relationship moderated the link between parents’ and children’s EH. At higher levels of relationship conflict and lower levels of positivity, there were stronger positive associations between parents’ and children’s EH. Parent–child relationship quality did not moderate the association between parents’ EH and children’s behavioral health (BH).
These cross-sectional study results suggest that beyond focusing on symptom management, families may benefit from supports targeting the parent–child relationship. Insights and implications for practitioners are discussed.
Introduction
The 2019 coronavirus disease (COVID-19) has impacted millions of lives since being declared a global pandemic. Numerous countries, including the United States, have utilized isolation, quarantine, and social distancing as primary tools to prevent transmission of the virus (Anderson et al., 2020). Though children are not at the highest risk for contracting COVID-19 (Dong et al., 2020), they are vulnerable to the psychological impacts of this outbreak. In China, 22% of students in grades 2–6 who were quarantined for approximately 1 month reported depressive symptoms, compared to 17.2% pre-pandemic, and nearly 19% reported experiencing anxiety (pre-pandemic rates were not reported; Xie et al., 2020). Similarly, children and adolescents were more likely than adult patients to have moderate to severe concerns about the 2009 H1N1 influenza pandemic (Page et al., 2011).
In addition to elevated anxiety about risk of illness (Cullen et al., 2020), potential effects of isolation on children and parents are varied (Golberstein et al., 2020). Disruption to children’s routines, access to social outlets and the normative separation-individuation processes can create anxiety, depression, and developmental regressions (Prime et al., 2020). Parents also shoulder a far heavier load than usual (Prime et al., 2020), simultaneously working and home-schooling children, increasing work-family conflict (Greenhaus & Beutell, 1985). Forced proximity and economic stress heighten risk for domestic violence and family relationship difficulties (Campbell, 2020). Furthermore, many youths receive mental health services in school, so closures may affect those from marginalized groups the most (Golberstein et al., 2020).
The effects of COVID-19 on parents and children likely vary based on children’s ages and developmental levels. This study focuses on middle childhood, a central time for the development of independence and social and emotional skills. Young people’s cognitive capacity for empathy, logical reasoning, and future-oriented thinking is rapidly increasing (e.g., Coughlin et al., 2014; Decety & Michalska, 2010), yet children remain dependent on their parents in many ways. Attachment research suggests that throughout the school-age years, children view their caregivers as a “safe haven” they can turn to when threats emerge, as sources of information and as a support for co-regulation of emotions and behaviors (Grossmann et al., 2008).
Stressful events, like COVID-19, may impact parents’ emotional wellbeing, and thereby availability to their children. For example, parents in Singapore who reported greater impact of COVID-19 reported higher stress, harsher parenting, and less closeness to their children (Chung et al., 2020). In pandemic and non-pandemic times, parental mental health problems are generally associated with children’s psychological wellbeing (Connell & Goodman, 2002; Sprang & Silman, 2013). The quality of the parent–child relationship can, however, play a crucial role in attenuating the effects of stress and parents’ emotional health (EH) on children’s wellbeing. Studies of maternal depression demonstrate that relationship qualities, such as maternal sensitivity and perceived maternal warmth, moderated the effects of maternal depression on children and predicted children’s resilience (Brennan et al., 2003; National Institute of Child Health & Human Development, Early Child Care Research Network, 1999). High quality parent–child relationships also protect children’s cognition (Spieker et al., 2003), cortisol stress response (Hostinar et al., 2015), amygdala reactivity (Gee et al., 2014), and depression (Sichko et al., 2016).
In the current study, we assess the link between parents’ EH and children’s emotional and behavioral health (EBH) during COVID-19 in the United States, and examine parent–child relationship quality (i.e., conflict and positivity) as a potential factor moderating this link. We hypothesize that (H1) greater impact from COVID-19 will be associated with greater EH issues in parents and EBH problems in children. Second, we predict that (H2) parents’ EH (trauma, depression, and anxiety) will be positively associated with children’s EBH (trauma, internalizing, and externalizing). Third, we predict that (H3) parent–child relationship quality will moderate the association between parent EH and child EBH. We anticipate that better relationship quality (lower conflict and greater positivity) will attenuate the positive association between parent EH and child EBH.
Method
Procedure
Data were collected between March 31 and May 15, 2020. We recruited participants using Facebook advertisements and flyer distributions to social/professional networks, and to parenting groups in New York and California. Eligibility included U.S. residency, English fluency, and having a child between 6 and 12 years-old. Text described the study’s aim as “Parents of children between the ages of 6 and 12, help researchers learn more about the impact of coronavirus on children and families by participating in an online research study. Click here to complete this survey that will help researchers understand more about your experiences.” The advertisements and flyers provided a link to the Internet address of the Qualtrics survey. Parents provided informed consent.
Participants
Participants were parents (N = 158; 96% female, Mage = 39.14, SDage = 5.96), with at least one child between the ages of 6 and 12 years-old. Participants indicated all ethnicities that they identified with, and thus could select multiple ethnicities; 92% identified as non-Hispanic White, 7% Latinx, 3% Black, and 2% Asian American. To avoid having nested data, parents were asked to respond to the questionnaires with regards to their oldest child between 6 and 12 years (Mage = 8.73, SDage = 2.01, 56% male). Ninety-four percent of children were identified as non-Hispanic White, 12% Latinx, 7% Black, and 6% Asian American.
Participants resided in 29 different states, with the largest groups located in New York (16.5%) and California (13.3%). Most (89%) were married or in a domestic partnership; 5.7% divorced/separated; 5.7% single/never married. More than half (57%) reported a household income over $100,000, with 12% reporting household income less than $40,000. Nearly 15% had one child, 49% had two children, 22% had three children, 12% had four children, and 2% had five or more children. Of those who indicated how they heard about the study (n = 148), 47% heard through a friend/contact, 26% through an online advertisement, 11% through a listserv or community they are part of, and a minority through individual email or could not remember.
Measures
COVID-19 Impact
COVID-19 Impact
We listed 38 stressful situations individuals may experience due to the pandemic (e.g., change in parents’ working conditions, loss of a loved one, diagnosis within the family, change in child's routine and school). If a situation applied, parents indicated with a “yes.” In order to examine severity of COVID-19 impact, four raters coded each item on a 5-point scale with 1 signifying least severe and 5 signifying most severe impact. Two raters (the first and last author) have doctorate degrees in clinical psychology and their research focuses on parents and children, the other two raters are doctorate students in developmental psychology. Raters achieved a high level of inter-rater reliability, α = .93. A weighting score was created for each item based on the mean of the 4 raters’ scores. Weighting scores ranged from 1.25 to 5 across items. These weighting scores were summed up from all items a participant endorsed as “yes,” producing a total COVID-19 impact score. Possible scores ranged from 1 to 129. Cut scores were determined based on guidelines from the Holmes-Rahe Stress Inventory (Noone, 2017), with 0–5 indicating not-at-all severe, >5–15 somewhat severe, >15–25 severe, and >25 extremely severe COVID-19 impact, respectively.
Parent Emotional Health
Depression and Anxiety Symptoms
Parents completed the Patient Health Questionnaire (Spitzer et al., 1999)—9 items for depression (PHQ-9) and 7 items for anxiety (GAD-7). Participants rate how frequently they have experienced each symptom in the past 2 weeks (for depression) and the past 4 weeks (for anxiety). The validity is well-documented (e.g., Kroenke et al., 2010). Scores for both the depression and anxiety scales range from 0 to 27, and cut scores of 5, 10, and 15 indicate mild, moderate, and severe symptoms. Previous studies in community samples have found that 75.3% of respondents reported no depression, 16.2% were in the mild range, and less than 9% were in the moderate to severe range (Ettman et al., 2020), and that 55.5% of respondents had no anxiety, 24% had scores in the mild range, and approximately 20% had scores in the moderate to severe range (Spitzer et al., 2006). Internal consistency in this sample was good, αdepression = .87, α anxiety =.78.
Trauma Symptoms
Parents completed the Impact of Events Scale-Revised (IES-R; Weiss & Marmar, 1997), a 22-item self-report measure assessing subjective distress caused by traumatic events. Respondents identify a specific stressful life event (in this case, they were told to respond re: COVID-19) and indicate on a scale of 0 (not at all) to 4 (extremely) how much they were distressed during the past 7 days. Items are summed and total scores range from 0 to 88. The scale has demonstrated validity in several studies (e.g., Beck et al., 2008). A score of 24 indicates clinical concern (Asukai et al., 2002). Reliability was good, α = .92.
Child Emotional and Behavioral Health
Internalizing (EH) and Externalizing (BH) Symptoms
Parents reported their child’s symptoms using the 35-item Pediatric Symptom Checklist (PSC; Jellinek et al., 1999). Parents rate how frequently each symptom has occurred, as 0 (never), 1 (sometimes), 2 (often); a time frame is not specified. The total score ranges from 0 to 70; scores of 28 or higher indicate psychological impairment for children and adolescents 6–16 years old. The prevalence rates of impairment range from 11% to 22% (Jellinek et al., 1988; Murphy et al., 1992). Subscales assess internalizing (e.g., “is down on his/herself”), externalizing (e.g., “irritable, angry”), and attention-related symptoms (e.g., “fidgety, unable to sit still”). The PSC shows convergence with informant ratings (Jellinek et al., 1995) and criterion and predictive validity (Jutte et al., 2003). Internal consistency was good, αinternalizing = .80, αexternalizing = .84, αinattention = .82, αtotal= .92.
Trauma-Related Symptoms
Parents completed the Child Revised Impact of Events Scale-13 (CRIES-13; Perrin Meiser-Stedman & Smith, 2005), a 13-item screening for children at risk for post-traumatic stress disorder (PTSD). Parents indicate how frequently the child experienced each symptom during the past week, 0 (not at all), 1 (rarely), 3 (sometimes), 5 (often); for example, “Does your child get startled more easily or is s/he more nervous than before it happened?” The scale has been validated extensively, and factor analyses identify three factors (intrusion, arousal, avoidance, e.g., Lau et al., 2013). Total scores range from 0-65 and a cutoff score of 30 is associated with PTSD (Perrin et al., 2005). Internal consistency was α = .87.
Moderators: Relationship Constructs
Parent–Child Relationship Quality
Parents completed the Child–Parent Relationship Scale (CPRS; Pianta, 1992), a 15-item parent-report measure of parents’ perceptions of their relationships with their children. Parents rate the degree to which each statement applies to their relationship with the child, from 1 (definitely does not apply) to 5 (definitely applies). Factor analyses identified two distinct subscales, conflict (e.g., “My child is sneaky and manipulative with me”) and positive aspects (e.g., “If upset, my child will seek comfort from me,” Driscoll & Pianta, 2011). Subscale scores are calculated by summing the items. Scores on the Conflict subscale range from 8 to 40 and scores on the Positive subscale range from 7 to 35. The CPRS has good criterion validity (e.g., Escalante-Barrios et al., 2020). Internal consistency was good, αconflict = .90; αpositivity = .76.
Data Analytic Plan
To reduce the number of variables, we explored the utility of creating broadband EBH composite scales for parents and children. We created standardized z-scores for all variables (M = 0, SD = 1), then tested whether the scales for parental EH (PHQ-9, GAD-7, IES intrusion, IES avoidance, and IES hyperarousal) and child EBH (PSC inattention, PSC internalizing, PSC externalizing, CRIES intrusion, CRIES avoidance, CRIES arousal) loaded onto one or more factors using exploratory factor analysis (EFA), using Kaiser–Meyer–Olkin, Bartlett’s test of sphericity, root mean square error of approximation (RMSEA), Tucker-Lewis fit index (TLI) to determine the adequacy of the composite scores. We then conducted a confirmatory factor analysis (CFA) to obtain additional assurance that the EFA factor solution explained a significant portion of the variance in the EBH data, using Kline’s (2013) approach of model fit evaluation to determine fit. We used the factor scores derived from the CFA in our hypothesis testing in order to reduce the number of analyses conducted.
First, we provide descriptive data to characterize the sample in terms of their experiences in the pandemic (COVID-19 impact). Using both bivariate correlations and independent samples t-tests, we evaluated the associations of demographic variables with EBH composite scores in order to identify potential covariates. Second, we tested our hypotheses using linear regressions. To test Hypotheses 1 and 2, we conducted regressions involving two steps: Step 1 included the covariates and Step 2 included the independent variable (Hypothesis 1: COVID-19 impact; Hypothesis 2: parent EH composite variable). To test Hypothesis 3, we used regressions conducted with Hayes’ PROCESS Macro (Model 1) for SPSS. Step 1 included the covariates and main effects and Step 2 included the interaction term (parent EH composite × parent–child relationship quality variable).
Due to the limited number of fathers in the sample, we reran all analyses excluding fathers/non-binary parents (n = 6) after running the initial analyses to see if the pattern of effects remained the same.
Results
Emotional and Behavioral Health Factor Structure
EFAs on parents’ EH and children’s EBH were completed based on the subscales specified in the Data Analytic Plan. For parents, all five scales loaded into a single factor—EH (Kaiser–Meyer–Olkin = 0.85, Bartlett’s test of sphericity = 1735.52, p < .001, RMSEA = .26, TLI = .83). Factor loadings ranged from .71 to .93. For children, the six scales loaded into two factors (Kaiser–Meyer–Olkin = 0.80, Bartlett’s test of sphericity = 1103.34, p < .001, RMSEA = .02, TLI = .99). Factor loadings ranged from .54 to .90. The first factor involved children’s internalizing symptoms or EH—CRIES intrusion, CRIES avoidance, CRIES arousal, and PSC internalizing. The second factor involved children’s externalizing symptoms or behavioral health (BH)—PSC inattention and PSC externalizing. According to Kline’s (2013) approach of model fit evaluation (i.e., χ2p < .05, CFI ≥ .90, RMSEA < .08, and SRMR < .08 indicating good fit), CFAs revealed that the factor structures of both parents’ EH (χ2 = 84.81, p < .001, CFI = .92, RMSEA = .26, SRMR = .05) and children’s EBH (χ2 = 39.29, p < .001, CFI = .92, RMSEA = .15, SRMR = .07) demonstrated considerably good fit. Thus, we utilized the parent EH factor and the child EBH factors in subsequent analyses. High scores on all factors signified greater severity of EBH issues.
Characterizing the Sample: COVID-19 Impact and Parents’ and Children’s Mental Health
Participants’ scores on the COVID-19 impact scale ranged from 0 to 36 (M = 16.80, SD = 7.41). Most participants (63.1%) indicated experiencing severe or extremely severe COVID-19 impact (see Table I), which could entail having at least one person in their immediate family die, at least one person in their immediate family getting diagnosed with COVID-19, and at least one parent losing their job.
Parent-Report Questionnaire Clinical Cutoffs
| Scale | N (%) |
|---|---|
| PHQ-9 | |
| None/minimal (0–4) | 41 (25.9) |
| Mild (5–9) | 67 (42.4) |
| Moderate (10–14) | 26 (16.5) |
| Severe (15+) | 24 (15.2) |
| GAD-7 | |
| None/minimal (0–4) | 31 (19.6) |
| Mild (5–9) | 74 (46.8) |
| Moderate (10–14) | 39 (24.7) |
| Severe (15+) | 0 (0.0) |
| IES-R | |
| No indications of PTSD | 67 (42.4) |
| PTSD clinical concern (>24) | 81 (51.4) |
| CRIES-13 | |
| No indications of PTSD | 131 (82.9) |
| Probable PTSD (>30) | 25 (15.8) |
| PSC total | |
| None/minimal | 130 (82.3) |
| Impairment (>28) | 28 (17.7) |
| PSC internalizing symptoms | |
| None/minimal | 126 (79.7) |
| Clinical concern (>5) | 32 (20.3) |
| PSC inattention symptoms | |
| None/minimal | 129 (81.6) |
| Clinical concern (> 7) | 29 (18.4) |
| PSC externalizing symptoms | |
| None/minimal | 129 (86.0) |
| Clinical concern (>7) | 29 (18.4) |
| COVID impact | |
| Not at all severe (0–5) | 23 (15.1) |
| Somewhat severe (>5–15) | 43 (28.3) |
| Severe (>15–25) | 69 (45.4) |
| Extremely severe (>25) | 17 (11.2) |
Most participants resided where social gatherings were restricted (94.9%), non-essential businesses were closed (91.1%), social distancing was required (91.1%), and/or stay-at-home orders were issued (77.2%). A majority reported their families were social distancing (96.8%; mode 15–21 days) and sheltering in place (79.7%). Most were working remotely (61%); 56% reported another adult in their household was working remotely; 26% continued to work in-person. Nearly all children were home from school (98.1%; mode: 3 weeks).
The percentages of parents and children scoring within each designated symptomatology range (e.g., mild, moderate) on each of the measures are reported in Table I. Goodness-of-fit Chi-square analyses revealed that our participants reported significantly greater depressive symptoms in comparison to one prior study of a nationally representative sample, χ2 (4) = 126.02, p < .001, as well as to a nationally representative sample assessed during COVID-19, χ2 (4) = 27.25, p < .001 (Ettman et al., 2020). Demographic covariates were inversely associated with the parent EH (education and income) and child EBH (education only) composite scores (see Table II). Independent samples t-tests revealed sex differences: Parents of females characterized their children as having higher EH issues than males, t(155) = 2.46, p = .015, whereas parents of males characterized their children as having significantly higher BH issues than females, t(155) = 2.98, p = .003.
Correlations Among Demographic Factors and Key Study Variables
| Child–parent relationship | Parent emotional health | Child emotional and behavioral health | |||||||||||
|---|---|---|---|---|---|---|---|---|---|---|---|---|---|
| C-P Con | C-P Pos | COVID Impact | EH factor | Anx | Dep | PTSD | EH factor | BH factor | Intern Sxs | Extern Sxs | Inatten Sxs | PTSD Sxs | |
| Parent age | −0.12 | −0.14 | 0.02 | −0.09 | −0.05 | −0.09 | −0.10 | 0.08 | −0.13 | 0.01 | −0.13 | −0.11 | 0.07 |
| Education | 0.03 | −0.01 | 0.06 | −0.25** | −0.19** | −0.22** | −0.23** | −0.06 | −0.18* | −0.22** | −0.07 | −0.20* | −0.05 |
| Income | −0.01 | −0.01 | −0.10 | −0.25** | −0.21** | −0.25** | −0.24** | 0.01 | −0.12 | −0.10 | −0.04 | −0.15 | 0.01 |
| Child Age | −0.02 | −0.23** | −0.13 | −0.02 | −0.06 | 0.04 | −0.04 | 0.14 | −0.08 | 0.25** | −0.10 | −0.10 | 0.09 |
| C-P Con | — | −0.34** | 0.01 | 0.16* | 0.18* | 0.12 | 0.14 | 0.42** | 0.66** | 0.47** | 0.68** | 0.46** | 0.46** |
| C-P Pos | — | 0.14 | 0.09 | 0.07 | 0.07 | 0.10 | −0.08 | −0.22** | −0.18* | −0.19* | −0.16* | −0.08 | |
| COVID Impact | — | 0.24** | 0.22** | 0.25** | 0.21** | 0.12 | 0.01 | 0.08 | −0.02 | 0.05 | 0.12 | ||
| P EH Factor | — | 0.87** | 0.86** | 0.95** | 0.47** | 0.22** | 0.35** | 0.11 | 0.25** | 0.48** | |||
| P Anx | — | 0.81** | 0.72** | 0.40** | 0.19* | 0.30** | 0.09 | 0.21** | 0.41** | ||||
| P Dep | — | 0.70** | 0.38** | 0.18* | 0.29** | 0.09 | 0.18* | 0.39** | |||||
| P PTSD | — | 0.46** | 0.21** | 0.34** | 0.10 | 0.25** | 0.46** | ||||||
| Child EH Fac | — | 0.32** | 0.75** | 0.26** | 0.30** | 0.98** | |||||||
| Child BH Fac | — | 0.56** | 0.85** | 0.87** | 0.37** | ||||||||
| C Intern Sxs | — | 0.38** | 0.46** | 0.66** | |||||||||
| C Extern Sxs | — | 0.54** | 0.32** | ||||||||||
| C Inatten Sxs | — | 0.34** | |||||||||||
| C PTSD Sxs | — | ||||||||||||
p < .05,
p < .01.
Note: Anx = anxiety; BH = behavioral health (composite factor score comprised of externalizing symptoms); C = child; Con = Conflict; C-P = child–parent; Dep = depression; EH = emotional health (composite factor score comprised of internalizing symptoms); Extern = externalizing; Inatten = inattention; Intern = internalizing; P = parent; Pos = Positivity; Sxs = symptoms.
Hypothesis Testing
Associations Between COVID-19 Impact and Parents’ EH and Children’s EBH
Controlling for child age, child gender, parent education, and parent income, R2 = .07, p = .01, the step containing COVID-19 impact contributed to the prediction of parents’ EH, ΔR2 = .03, p = .03, with greater COVID-19 impact associated with greater EH issues (see Supplementary Table 1). In contrast, controlling for these same demographic covariates, R2 = .02, p = .54, the step containing COVID-19 impact was not significantly associated with child EH, ΔR2 = .02, p = .08, or child BH, ΔR2 = .00, p = .66.
Parents’ EH and Children’s EBH
Controlling for demographic covariates, R2 = .04, p = .25, the step containing parents’ EH significantly contributed to the prediction of children’s EH, ΔR2 = .23, p < .001 (see Supplementary Table 2). Greater parent EH issues were associated with greater child EH issues. Similarly, controlling for demographic covariates, R2 = .06, p = .04, parents’ EH were positively associated with child BH, ΔR2 = .03, p = .02.
Parent–Child Relationship Quality as a Moderator of the Association Between Parents’ EH and Childrens’ EBH
Controlling for demographic covariates, R2 = .04, p = .25, and the main effects, ΔR2 = .35, p < .001, the interaction between parent–child conflict and parents’ EH significantly predicted children’s EH, ΔR2 = .03, p = .004 (see Supplementary Table 3). The positive association between parents’ EH issues and children’s EH issues increased as conflict increased (low conflict: b = .27, p = .01, mean conflict: b = .46, p < .001, high conflict: b = .65, p < .001; see Figure 1). Switching the independent variable and the moderator revealed that parent–child conflict and children’s EH issues were only positively associated at mean, b = .37, p < .001, and high, b = .58, p < .001, but not low levels of parents’ EH, b = .16, p = .816.
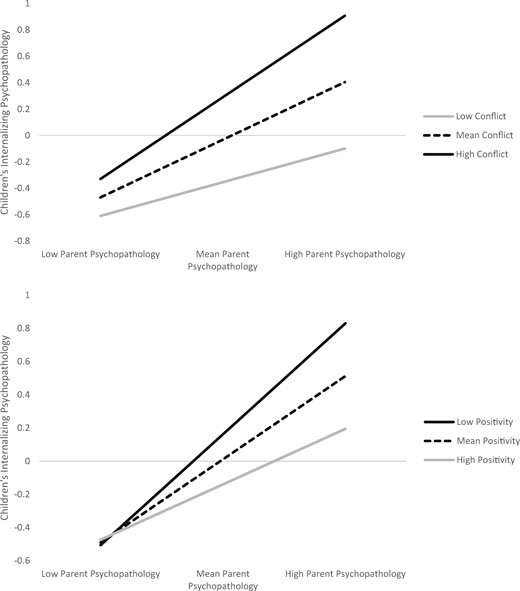
Parent emotional health interacts with parent-child relationship quality to predict child emotional health.
Controlling for demographic covariates, R2 = .03, p = .25, and the main effects, ΔR2 = .24, p < .001, the interaction between parent–child positivity and parents’ EH issues significantly predicted children’s EH issues, ΔR2 = 02, p = .03. The positive association between parents’ EH issues and children’s EH issues became less strong as positive qualities increased (low positivity: b = .69, p < .001; mean positivity, b = .52, p < .001; high positivity: b = .35, p = .002; see Figure 1). Switching the independent variable and the moderator revealed that positive parent–child interactions and children’s EH issues were only negatively associated at mean, b = −.34, p = .04, and high, b = −.73, p = .01, but not low levels of parents’ EH, b = .04, p = .86.
Controlling for demographic covariates and main effects, the interaction between parent–child conflict and parents’ EH issues was not a significant predictor of children’s BH, ΔR2 = .001, p = .64. Controlling for demographic covariates and the main effects, the interaction between positivity and parents’ EH issues was not a significant predictor of children’s BH issues, ΔR2 = .02, p = .09.
Analyses Excluding Non-Mothers
We reran all analyses excluding fathers/non-binary parents (n = 152). Findings followed the same pattern as with the full sample, except that the regression examining COVID-19 impact and parents’ EH dropped just below significance, ΔR2 = .02, p = .053.
Discussion
Our findings reveal important information regarding the familial context of EBH during the COVID-19 pandemic, which must be situated in an understanding of the sample. Parents’ self-reported depression symptoms were significantly higher than rates among adults in other studies during the pandemic and pre-pandemic, with more than 75% of parents reporting at least mild depression. Approximately 80% of parents reported mild to moderate anxiety, and more than half endorsed concerning trauma symptoms. It is important to note that participants in this study were mostly White, middle and upper middle-class parents who were either married or in domestic partnerships. Parents with less education, younger children, and lower household income reported greater EH issues. The majority of the children in the sample did not reach clinical cutoffs for psychiatric symptoms, as reported by their parents. Thus, our findings should primarily be contextualized in terms of clinical risk for parents, which may vary depending on socioeconomic status.
Our central hypotheses pertained to the familial context of EBH. COVID-19 impact was positively associated with parents’ EH issues, but not children’s EBH. There was, however, a positive association between parents’ EH and children’s EH, which was moderated by the quality of the parent–child relationship. Specifically, higher conflict in the parent–child relationship strengthened the positive links between parent and child EH issues, but positive aspects of the parent–child relationship were protective. When parent EH issues were low, levels of children’s EH did not vary as a function of parent–child positivity. However, when parent EH issues were medium or high, child EH issues increased as positive parent–child interactions decreased.
Implications for Families and Clinicians
Attachment theory dictates that caregivers serve as safe havens who their children can turn to in times of distress (Bowlby, 1969/1982). The COVID-19 pandemic presents myriad threats, putting children and adults alike in need of a safe haven. Besides serving as safe havens for their children, parents need their own safe havens; provided by not only friends and family but also clinicians. Professionals should focus on families’ emotional needs, for example, by inviting parents to share their thoughts and feelings, both in general and toward their children.
Interventions that aim to improve the parent–child relationship and reduce conflict may help to stem the transmission of symptomatology. Such treatment models include Child-Parent Psychotherapy (CPP; Lieberman et al., 2005), Parent–Child Interaction Therapy (PCIT; Funderburk & Eyberg, 2011) and the Incredible Years® (Webster-Stratton & Reid, 2010). These approaches include psychoeducation and coaching for parents on praising positive behaviors, following the child’s lead, observing and narrating play, and reflecting emotions in interactions. Although families are together more than usual, parents should be encouraged and helped to set aside and engage in quality play time with their children. With older children, this might involve a walk together or sitting with them to watch their favorite television show.
With so many worries on parents’ minds, being present with their children may be especially challenging. Distress tolerance skills may help parents remain connected with their children in difficult moments; these include deep breathing, meditation, exercise, or using sensory experiences to self-soothe, like taking a hot or cold shower, a bath, or listening to music (Linehan, 2015). Parents can also engage their children in distress tolerance and emotion regulation strategies, transforming them into opportunities to do something positive together.
Psychotherapy can provide parents and children with support to discuss stressful experiences associated with the pandemic (e.g., loss, domestic violence, psychopathology; Lieberman et al., 2005). When parents’ mentalizing (i.e., ability to understand the thoughts and feelings that underlie their children’s behaviors) is maintained or restored following trauma, it may protect and promote parent–child relationship quality in the longer term (Berthelot et al., 2015). Therapeutic support may be particularly important when children have emotional or behavioral symptoms, because parents who perceive their child’s behavior or emotion regulation as problematic tend to have higher parenting stress and are at increased risk of abuse (Haskett et al., 2006). Interventions can and should be provided not only through mental health services but also through preventative efforts in schools and primary care settings.
Limitations
First, our study was cross-sectional and correlational, which limits our ability to draw conclusions about the directionality of the relationship between parents’ and children’s EBH. The relationship observed is likely reciprocal (Belsky, 1984). Parents’ EH issues may impact their children, and children’s EBH may also impact parents. In fact, in a previous study, bidirectional effects between mothers’ depressive symptoms and children’s antisocial behavior were most pronounced during the transitions to elementary school and adolescence, underscoring the relevance of bi-directionality during middle childhood (Gross et al., 2008).
Second, we were unable to determine whether the pattern of symptoms is unique to the pandemic-induced quarantine. Nonetheless, we cautiously use the data to inform our thinking regarding the situation in which families are currently embedded, recognizing the limitations of the design. These findings highlight the importance of assessing not only parents’ and children’s EBH, but also the quality of the parent–child relationship.
Third, data were collected in March–May 2020, which was the beginning of pandemic-related precautions in the United States. Future studies must investigate the trajectory of parents’ and children’s wellbeing throughout the pandemic to elaborate the role of attachment in buffering or exacerbating the negative impact of pandemic-related stressors over time.
Fourth, the sample mostly consisted of White, middle-class, and healthy individuals. As such, these findings may not reflect the effects of COVID-19 among non-White communities and may not generalize to populations that are considered at higher risk.
Last, the study relied on parents’ reports to efficiently reach a larger sample. However, self-report questionnaires are subject to biased reporting and limited to conscious insights. The reliance on parents’ reports for all measures presents the possibility of shared method variance that may inflate the relationship between parent and child EBH. Future studies should include observational and qualitative assessments, as well as children’s self-report. In addition, this study used a parent–report measure of the parent–child relationship as a proxy for attachment. Future research would benefit from using a more direct measure of parent–child attachment. Moreover, our sample was composed primarily of mothers; more research is needed on fathers’ EBH in relation to children’s mental health.
Conclusions
Our findings provide a snapshot of the psychological toll of the COVID-19 pandemic on families, highlighting the role parent–child relationships may play in the intergenerational transmission of emotional and behavioral health issues. With a more fully developed picture of how multiple factors interact to explain the variation in children’s wellbeing, mental health providers can provide more adequate treatment and prevention of mental health issues and intergenerational transmission. High conflict and low positive qualities in the relationship appear to strengthen the positive association between parents’ and children’s mental health difficulties during this pandemic. Interventions that place the attachment relationship at the center may benefit both parents and children. Not only do children need their parents, but families also need therapeutic spaces to be their safe havens.
Supplementary Data
Supplementary data can be found at: https://dbpia.nl.go.kr/jpepsy.
Acknowledgments
Thank you to Dr. Tracy Prout for your inspiration and consultation on the design of this study and data collection. We also wish to acknowledge the support of graduate students from the Attachment and Psychotherapy Research Lab at Ferkauf Graduate School of Psychology, Yeshiva University, especially Puja Sabnani and Adina Goodman.
Conflicts of interest: None declared.
References
National Institute of Child Health & Human Development, Early Child Care Research Network. (
