


Abstract
The present nonrandomized controlled trial aimed to evaluate feasibility, acceptability, and preliminary efficacy of a tailored text message intervention for increasing adolescent physical activity, as compared with passive monitoring.
Forty adolescents (13–18 years old) received either a tailored text messaging intervention (Network Underwritten Dynamic Goals Engine [NUDGE]; N = 20), or participated in an attention-control condition (N = 20), for 20 days. Physical activity was measured for all participants via continuous accelerometry. Frequency analyses were conducted on program usage and satisfaction ratings to evaluate feasibility and acceptability, and multilevel models were used to evaluate the efficacy hypotheses.
The vast majority of participants (90%) reported being very or mostly satisfied with the NUDGE program and rated their enjoyment as above average. The intervention group was estimated to spend an average of 20.84 more minutes per day in moderate-to-vigorous physical activity relative to the attention-control group (β = 20.84, SE = 8.19). Exploratory analyses revealed that the intervention group also engaged in 82 fewer minutes of sedentary time per day on average, although this effect was not significant due to the large variability in sedentary time (β = −81.98, SE = 46.86).
The NUDGE tailored text messaging intervention was feasible, acceptable, and efficacious in increasing physical activity in this sample. Findings warrant additional evaluation of NUDGE as both a standalone physical activity intervention or as part of a multicomponent package.
Introduction
It is recommended that adolescents obtain 60 min of moderate-to-vigorous physical activity (MVPA) daily. This practice can promote overall health and help to prevent problems such as cardiovascular disease, diabetes, and obesity (Danaei et al., 2009). Interestingly, many young children engage in adequate MVPA (Nader et al., 2008). However, marked declines in health promoting physical activity and increases in sedentary time are observed around age 13 and worsen through adulthood, at which point only 1 out of 5 Americans meet the 2008 Physical Activity Guidelines (DHHS, 2008; Nader et al., 2008). Given the observed rapid decline it is essential to find acceptable and efficacious intervention approaches that can facilitate adolescents’ engagement in more MVPA, which may translate into improved health over the lifespan.
Adolescents are high adopters of smartphone technologies and are generally comfortable with communication via text message (Lenhart, 2015). In fact, representative surveys suggest that the average adolescent sends ∼30 text messages per day and texting is their dominant mode of communication (Anderson, 2015). A recent meta-analysis aimed to evaluate the efficacy of mobile health interventions for improving health outcomes, in children and adolescents, and found that the average overall effect size associated with these interventions was small, yet statistically significant (Fedele et al., 2017). One conclusion from this work was that very few mHealth studies use a clear theoretical framework to guide the choice of the behavior change techniques in the intervention. Moreover, several studies have demonstrated that consumer-facing mobile applications specifically for physical activity do not widely employ efficacious behavior-change techniques (Brannon & Cushing, 2015). Importantly, this runs counter to recent finding that parents are open to a range of evidence-based behavior change techniques embedded in mHealth interventions, which indicates that the market is receptive to features that should change behavior (Cushing et al., 2018).
There is evidence that control theory might be a powerful framework for designing interventions to promote physical activity (Michie et al., 2009). Indeed, control theory interventions (particularly those that encourage self-monitoring) have support for promoting adolescent physical activity (Brannon & Cushing, 2015). Control theory posits that, individuals achieve goals by monitoring progress toward an end state, incorporating feedback, and modifying goals as needed (Carver & Scheier, 1981, 1982). Michie et al. (2009) found interventions that leveraged the control theory strategy of self-monitoring with at least one other behavioral self-regulation component were significantly more effective than interventions that did not involve this combination. Broadly, interventions consistent with control theory use the techniques of goal-setting, self-monitoring of behavior, receiving feedback, and goal review (Carver & Scheier, 1981, 1982). Goal setting is typically defined as a detailed plan of what a person will do that is time-bound and measurable. Self-monitoring is simply the act of keeping track of a behavior. Goal review refers to actively reconsidering previously set goals to determine if they are still framed in a way that is relevant and reasonable. Feedback can be either a depiction of data that indicates progress toward a goal or more qualitative commentary on how well or poorly the person has performed an action. Adolescents are still developing the ability to self-regulate their own behavior (Pokhrel et al., 2013). Therefore, tailored interventions that provide developmentally appropriate external supports for self-regulatory skills consistent with control theory could support long-term health habits in adolescents (Lansing & Berg, 2014). Moreover, there is some evidence that interventions that adapt to the user over time may be more effective than static interventions (Smyth & Heron, 2016).
Digital interventions offer the potential to leverage user data within the program to change or “adapt” the intervention experience based on user inputs. Such paradigms were originally framed as ecological momentary interventions, just-in-time interventions, and in some cases where the rules of the interventions change over time can be known as just-in-time adaptive interventions (Heron & Smyth, 2010; Nahum-Shani et al., 2016; Smyth & Heron, 2016). Importantly, such a digital intervention system that adapts to user input can be easily conceptualized as a form of feedback control (i.e., the controlled system from control theory) because the system itself is continually optimizing its performance based on user inputs (Rivera et al., 2007).
As one goes about building an adaptive intervention some consideration must be given to how the system will be designed. In contrast to large packages with many active ingredients, the ORBIT (Obesity-Related Behavioral Intervention Trials) model encourages the smallest intervention possible with the intention of repurposing efficacious intervention concepts in larger packages. The advantage of conducting small scale interventions is that individual elements are closely tied to theoretical models or empirical evidence. Then, when an intervention succeeds or fails a clear picture of why it produces an observed effect emerges from the study (Czajkowski et al., 2015). Currently, it is unclear if simple prompts—designed in a manner consistent with control theory—would be effective on their own in increasing adolescent physical activity. In large part this is because most studies combine messaging with other intervention elements (Ludwig et al., 2018).
This study aimed to evaluate feasibility, acceptability and gather preliminary data on the effect of an adaptive mHealth intervention in which adolescents receive messages about physical activity that are tailored based on their recent exercise. Participants are asked to self-report their physical activity, review goals in the light of their past performance, set a goal for the future, and receive feedback on their performance. Consistent with the ORBIT model of intervention development, this study was designed with as few active ingredients as possible to ensure that the mechanisms of action would be unambiguous provided that the intervention has an effect (Czajkowski et al., 2015). It was hypothesized that adolescents who received a tailored text messaging intervention (intervention group) that involved goal-setting, self-monitoring, feedback, and goal re-evaluation would engage in more physical activity over a 20-day study period than adolescents in the passive monitoring group (attention control group). Although not a specific target of the intervention, an exploratory analysis of the intervention effect on sedentary time was also performed.
Materials and Methods
Participants
Because adolescence (13–18) is a time of declining physical activity, forty adolescents, ages 13–18 years old, participated in the study (see Table I). A total of 20 participants made up the intervention group (Network Underwritten Dynamic Goals Engine; NUDGE), whereas 20 were in the attention-control group. The attention control group were drawn from a larger sample that participated in an ecological momentary assessment study assessing the relationship between state and trait psychological variables and physical activity. Attention control participants were matched to NUDGE participants on age, sex, and race/ethnicity, with priority given in the order the variables are listed. Participants from each study were recruited using the same procedures (i.e., through flyers posted in a midwestern city) and the respective protocols (i.e., study measures and duration), apart from the NUDGE intervention, were equivalent. The protocols were approved by the local institutional review board. Adolescents and/or their parents contacted the research lab to express interest in the study, completed a brief screening process, and were scheduled for an initial lab visit. Inclusion criteria were: (a) age range of 13–18 years old, (b) able to read at grade level in English. Exclusion criteria included : (a) significant uncorrected visual impairments, (b) any physical impairments that limited activity, and (c) independent living without a caregiver (e.g., 18-year-old college undergraduates living in a dormitory; Figure 1).
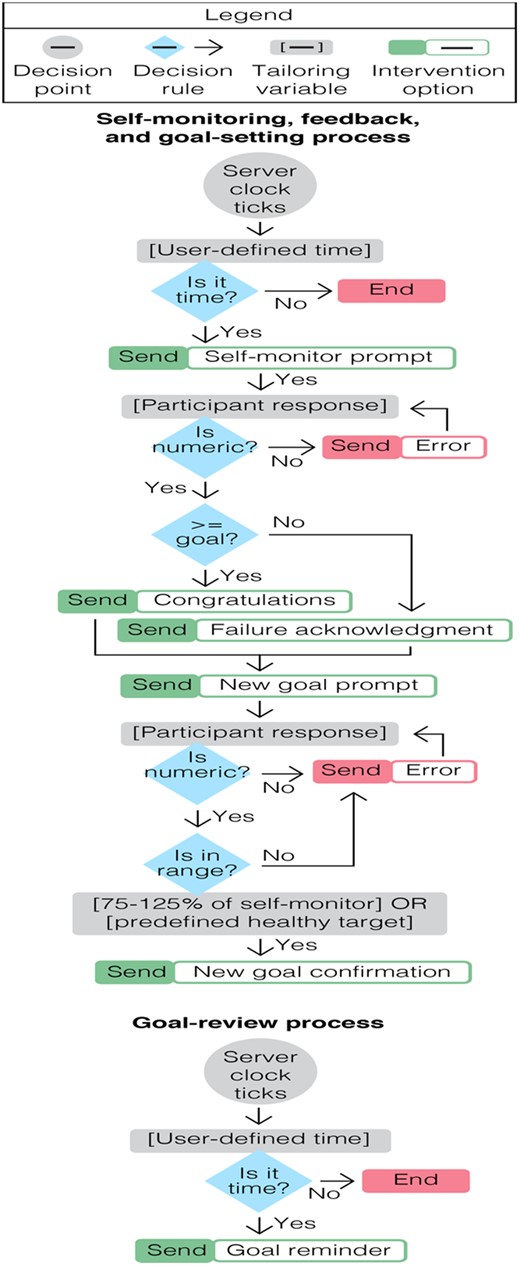
Flowchart of NUDGE processes.
NUDGE Participant Demographics
| Demographic variable | ||
|---|---|---|
| Intervention group (N = 20) | Attentional control group (N = 20) | |
| M (SD) or N (%) | ||
| Gender | ||
| Male | 5 (25%) | 5 (25%) |
| Female | 15 (75%) | 15 (75%) |
| Age at baseline (years) | 15.25 (1.80) | 15.25 (1.62) |
| Race/Ethnicity | ||
| White/Caucasian | 16 (80%) | 12 (60%) |
| Black/African American | 2 (10%) | 1 (5%) |
| Hispanic/Latinx | 2 (10%) | 2 (10%) |
| Asian | 0 (0%) | 2 (10%) |
| Other/Multiracial | 0 (0%) | 2 (10%) |
| Missing | 1 (5%) | |
| BMI Percentile | 70.9 (22.7) | 65.4 (28.3) |
| Approximate family income | ||
| <$10,000 | 1 (5.0%) | 0 (0%) |
| $10,000–$20,000 | 0 (0%) | 2 (10%) |
| $21,000–$30,000 | 0 (0%) | 1 (5%) |
| $31,000–$40,000 | 0 (0%) | 1 (5%0 |
| $41,000–$50,000 | 1 (5%) | 1 (5%) |
| $51,000–$60,000 | 2 (10%) | 4 (20%) |
| > $60,000 | 15 (75%) | 11 (55%) |
| Mother’s highest level of education | ||
| High school graduate | 6 (30%) | 4 (20%) |
| College graduate or above | 14 (70%) | 16 (80%) |
| Father’s Highest Level of Education | ||
| High school graduate | 6 (30%) | 7 (35%) |
| College graduate or above | 14 (70%) | 13 (65%) |
Note. M = mean; SD = standard deviation; BMI = body mass index. One intervention group participant did not report family income. One control group participant did not report race/ethnicity.
Procedures
Recruitment procedures as well as study procedures for the intervention and attention control groups were similar. Participants were recruited using flyers posted in a midwestern community. Postings were made at businesses, places of worship, and schools when allowed. Flyers indicated that participants would be asked to complete surveys, wear sensors, and would be compensated financially for the time they devoted to the project. Informed consent was obtained along with assent if the child was a minor. The research team recruited participants in the attention-control group from 2015 to 2016 and participants in the NUDGE group in 2017. Recruitment occurred across all four seasons of the year.
Enrollment Visit
Parent-adolescent dyads attended a scheduled visit in the lab and completed an informed consent and assent process, respectively.1 They completed a set of baseline questionnaires pertaining to physical activity, dietary behavior, and mood on a lab computer. These measures included a demographics survey, the Treatment Self-Regulation for Exercise and Diet Questionnaire (Levesque et al., 2006), Perceived Competence for Exercise Questionnaire (Williams et al., 1998), Social Support for Exercise Scale (Sallis et al., 1987), Physical Activity Self-Efficacy Questionnaire (Motl et al., 2000), Physical Activity Attitudes Questionnaire (Nelson et al., 2010), Pediatric Quality of Life Inventory (Varni et al., 2001), Power of Food Scale (Lowe et al., 2009), and the Children’s Report of Sleep Patterns (Meltzer et al., 2013). Research staff provided the adolescent with a smartphone for use in the study and explained instructions for usage.2 Consistent with other studies in youth (Heron et al., 2017) we limited the features of the smartphones given to participants to only those necessary to complete the study (i.e., SMS capability and access to the survey app). Each participant chose four times to complete a daily survey that would take about 3–5 min. These daily surveys included the Positive and Negative Affect Scale-Child Version (Ebesutani et al., 2012), the three highest loading items for five of the subscales from the Profile of Mood States scale (depression, anxiety, anger, energy, fatigue, McNair et al., 1971), questions about the participant’s environment, dietary intake, social support for exercise (Sallis et al., 1987), and hedonic hunger (Mitchell et al., 2016). Control participants received the same contacts as the intervention condition (i.e., same surveys). In addition to the control procedures, NUDGE participants provided convenient times to receive intervention text messages. NUDGE participants were trained to report MVPA in minutes. In the training, we defined exercise as activities such as running, swimming, or brisk walking that makes it hard to carry on a conversation. Adolescents in both groups were also provided an accelerometer for tracking physical activity (ActiGraph wGT3X-BT) to be worn on their non-dominant wrist throughout the duration of the study. The accelerometer did not provide feedback on activity to the participant.
Exit Visit
At the end of the 20-day3 study period, all participants returned to the lab for a scheduled visit to complete postintervention measures and return the smartphone and accelerometer. Participants were compensated $15 for wearing the accelerometer for 24 h on 18 out of 20 study days; and, an extra $25 if the participant answered all four surveys on at least 17 days.
Attention Control Condition
The attention-control group did not receive the NUDGE intervention text messages (described below). Instead, participants completed identical study measures (enrollment, exit, and daily surveys) in the NUDGE protocol and wore an accelerometer as well as a blinded heart rate monitor for the 20-day study duration. As mentioned previously, the recruitment, consenting, assessment procedures, and the study period for the attention-control study were identical to the NUDGE protocol. Research staff explained to participants that their physical activity would be monitored during the study. Participants in this condition received no intervention content.
NUDGE Intervention
NUDGE is a chat bot developed for the purposes of this study. The bot is a server-side computer program that adapts text messages based on user input with the goal to promote adolescent physical activity. The platform engages in a chat with users to help them set and review goals, self-monitor progress, provide feedback on goal attainment, and revise future goals. The adaptive nature of the intervention means that the program changes the wording of messages, and the ranges of goals based on user input and self-reported activity levels. To begin, participants choose a time of day when they would like to receive a text message to set a physical activity goal. The goal is then stored overnight; at a predetermined time the next morning, NUDGE sends a message reminding the user of their stored goal (e.g., “Just a friendly reminder that your exercise goal today is 25 min. I will check in with you later to see how you did”). Later the same day, the user is prompted to self-monitor their physical activity via self-report (e.g., “How much exercise did you get [in minutes]?”). NUDGE used self-report in this instance because control theory posits that the active comparison of one’s performance to a goal is essential in goal attainment. For this reason, the self-report (even if less accurate than an accelerometer) is desired over a passive monitoring system (Michie et al., 2009). The participant replies to the NUDGE bot with a numerical value representing their accumulated exercise. The entry is compared against the previously entered goal value. The NUDGE bot then provides feedback to the user indicating whether or not their predefined goal was met and subsequently requests a new goal (e.g., “This is fantastic! You met your goal!” or “It looks like you didn't meet your goal.”). The maximum allowable goal value was 120 min and the minimum was 15. In addition, NUDGE only accepts goal values that were between an investigator defined range (i.e., 75–125%) of the last self-monitored physical activity value, so that future performance is tied to past performance and goals cannot be set too high or too low to be useful (Wrosch et al., 2003; e.g., “Let’s set a new exercise goal. Based on what you did this time [25 min], I think you should choose between 15 and 45 min”). If users exceeded 60 min of self-reported exercise, the feedback message was modified to congratulate the user on their healthy level of exercise (e.g., “This is fantastic! You met your goal! You exercised a healthy amount! Let’s set a new goal between [75–125% of current MVPA]”).
Measures
Demographics and Anthropometrics
Participants completed a brief demographic questionnaire and their height and weight were measured by study staff. Body mass index percentile was calculated based on age and sex, as indicated by the Centers for Disease Control (Kuczmarski, 2002).
Objective Measure of Activity
Physical activity (MVPA) and sedentary behavior (SB) were measured by an accelerometer (ActiGraph wGT3X-BT; Actigraph LLC, Pensacola, FL). Participants were instructed to wear the accelerometer for 24 h per day on their nondominant wrist during the study. The accelerometer was used only for passively monitoring physical activity. The goal was to use the device only to track outcomes and not as an element of the intervention. Accelerometers were set to sample movement at a rate of 30 Hz. Data were processed using the Actilife software v.6.10.2, and summarized daily measurements of MVPA and the secondary outcome of SB using the Chandler et al. (2016) algorithm.
Feasibility and Acceptability
To determine the feasibility of the NUDGE protocol, we computed the average number of participant-provided responses per day, messages sent by the NUDGE bot per day, exchanged messages per day between participants and the NUDGE bot per day, as well as the number of unexpected messages (i.e., the participant texted without receiving a message from NUDGE) received from participants, and compared them with expected values based on the protocol. In addition, we calculated instances of what we describe as a goal-loop, or occurrences when participants were unable to set goals within a personally useful range (i.e., 75-125% of their previous attainment). This occurred when participants continually enter values that are outside the acceptable range for the algorithm and indicate lack of understanding of the NUDGE rules, and may reflect frustration with the system. Participants completed the Consumer Satisfaction Questionnaire (CSQ) as a measure acceptability of the intervention. This consisted of a list of questions administered in survey format at the end of the study to assess participant satisfaction with NUDGE. The CSQ-8 is comprised of eight items on a 4-point response scale (α = .90) and measured general satisfaction with NUDGE as well as quality of program. Some example items on the CSQ-8 are “how satisfied are you with the amount of help you have received?” and “how do you rate the quality of service you received?” Total satisfaction scores were generated (based on the sum of individual items) to investigate acceptability of the program. Participants also completed two text responses regarding what participants liked and did not like about the study: “please tell us what you liked about the study”; and, “please tell us what you did not like about the study” (Table II).
Consumer Satisfaction Questionnaire-8
| Item | Percentages |
|---|---|
| How do you rate the quality of service you received? | |
| Excellent | 40.0 |
| Good | 45.0 |
| Fair | 10.0 |
| Poor | 5.0 |
| Did you get the kind of service you wanted? | |
| No, definitely not | 0.0 |
| No, not really | 5.0 |
| Yes, generally | 40.0 |
| Yes, definitely | 55.0 |
| To what extent has our program met your needs | |
| Almost all of my needs have been met | 55.0 |
| Most of my needs have been met | 40.0 |
| Only a few of my needs have been met | 5.0 |
| None of my needs have been met | 0.0 |
| If a friend were in need of similar help, would you recommend our services to him or her? | |
| No, definitely not | 0.0 |
| No, not really | 0.0 |
| Yes, generally | 60.0 |
| Yes, definitely | 40.0 |
| How satisfied are you with the amount of help you have received? | |
| Quite dissatisfied | 5.0 |
| Indifferent or mildly dissatisfied | 10.0 |
| Mostly satisfied | 30.0 |
| Very satisfied | 55.0 |
| Have the services you received helped you to deal more effectively with your problem? | |
| Yes, they helped a great deal | 15.0 |
| Yes, they helped somewhat | 70.0 |
| No, they really didn’t help | 15.0 |
| No, they seemed to make things worse | 0.0 |
| In an overall, general sense, how satisfied are you with the services you have received? | |
| Very satisfied | 60.0 |
| Mostly satisfied | 30.0 |
| Indifferent, or mildly dissatisfied | 10.0 |
| Quite dissatisfied | 0.0 |
| If you were to seek help again, would you come back to our program | |
| No, definitely not | 0.0 |
| No, not really | 5.0 |
| Yes, generally | 70.0 |
| Yes, definitely | 25.0 |
Data Analysis Plan
To evaluate feasibility and acceptability we evaluate the mean number of text messages exchanged and the average value in our acceptability measure. Our a priori criteria for feasibility and acceptability was that both values would be above the midpoint of the scale. To evaluate the efficacy hypotheses, we conducted multilevel models using SAS PROC MIXED. We ran two sets of identical models for MVPA and our exploratory analysis of sedentary time as assessed by objectively monitored accelerometry. First, the dependent variable was entered into a model with no predictors to allow for the computation of an intraclass correlation coefficient (ICC). Next, we explicitly modeled an effect of time by fitting dummy codes for each observation centered at baseline. We fit models for linear, random linear, quadratic, and random quadratic effects of time. The best fitting and most parsimonious model was selected using −2LL difference tests (Snijders & Bosker, 2011). Group membership was then entered into the model as a predictor with the control group centered at zero this was done so that the interpretation of the effect would be the number of minutes increase or decrease in the dependent variable for the intervention group. Finally, a dummy-coded variable representing weekend and weekdays was entered into the model as a main effect and interaction with group membership. This variable was centered so that the zero point would represent weekdays. Finally, we called up conditional effects of the interaction so that we could report on specific parameter estimates (e.g., MVPA levels in intervention participants on weekdays).
Results
Feasibility
Based on the NUDGE protocol, there should be six messages exchanged between the NUDGE bot and the user (e.g., four from NUDGE bot and two from the user). The average number of participant-provided responses per day was 1.35, the average number of sent messages from the NUDGE bot per day was 1.66, and the average number of exchanged messages per day was 3. There was a small, but significant decline in participant engagement with the NUDGE bot across time (b = −0.02, p = .004). In real terms this means that by the end of the study participants were responding to .4 fewer messages than on the first day, which is a trivial difference. There were 16 occasions of unexpected messages from participants and 2 occasions of goal-loop frustration (i.e., participants were not able to set a goal within the acceptable range). We anticipated 800 days of accelerometer data and obtained 799.
Acceptability
The mean satisfaction score from the CSQ-8 was 26.65 (SD = 4.03, range = 16–32). This indicates that the average participant was satisfied with the intervention. Scores from an individual item, “In an overall, general sense, how satisfied are you with the services you have received?,” on the CSQ-8 indicated that 60% of participants were very satisfied, 30% were mostly satisfied, and 10% were indifferent or dissatisfied with the NUDGE program.
Free text responses regarding what participants liked and disliked about the study were coded to create frequencies of common themes in responses. Five participants commented how the NUDGE program increased their motivation for healthy behaviors, such as physical activity. Four participants endorsed that NUDGE facilitated self-reflection and self-monitoring of physical activity. For example, participants commented how they liked “how it made me think about exercising”, how “it forced me to look at how much exercising I was getting” and how it “keeps tabs on the physical activity I did.” Seventeen participants commented on the ease of the intervention, the helpfulness of goal reminders, and the flexibility to incorporate NUDGE into their daily schedule. Ten participants indicated some dissatisfaction with the equipment (e.g., accelerometer) with the majority of complaints relating to discomfort wearing the device.
MVPA Efficacy
To evaluate the equivalence of the two groups we conducted an independent samples t-test across the two groups on the first day of the study. There were no group differences in MVPA at that timepoint. In an empty multilevel model for MVPA the ICC was .57 indicating that ∼57% of the variance in MVPA is between-person and 43% is within-person. In the models for time, it was established that a random effect linear model of time fit best and was used for subsequent analyses; this suggests that MVPA increases or decreases at different rates across study participants during the study window. Participants in the control condition averaged ∼28 min of MVPA. In the final model, the main effect of group was β = 20.84 (SE = 8.19; Table III) indicating that the intervention group engaged in ∼21 more minutes of MVPA than the control group. Moreover, the magnitude of this difference is more than three quarters of a SD (d = .83). Finally, day of the week did moderate the intervention effect with NUDGE participants obtaining significantly more MVPA on weekdays compared with weekends. Moreover, controls obtained less activity than the intervention group on weekend days.
Final Model for MVPA
| 95% CI for slope | ||||
|---|---|---|---|---|
| Fixed effects | Slope | Lower | Upper | p |
| Intercept | 28.28 | — | — | — |
| Time | −0.31 | –0.17 | 0.11 | 0.04 |
| Group | 20.84 | 19.36 | 22.30 | 0.01 |
| Weekend | −0.7 | −5.52 | 4.12 | .78 |
| Group * Weekend | −7.45 | −14.70 | −0.2 | .04 |
| Random Effects | Estimate | SE | ||
| Intercept | 688.65 | 174.14 | ||
| Time | 0.12 | 0.12 | ||
| Intercept-time | −2.90 | 4.23 | ||
| Residual | 540.75 | 28.53 | ||
Note. MVPA = moderate-to-vigorous physical activity. Models were conditioned such that the intercept represents the number of MVPA minutes for a control participant, on a weekday, on the first day of the study.
Sedentary Efficacy
There were no differences in sedentary time across the two groups on the first day of the study. The empty model revealed an ICC for sedentary activity of .63. This indicates that 63% of the variability in SB is between-person, whereas 37% is within-person. Again, a random linear effect of time fit the longitudinal data best and was retained for analyses; this again suggests that participants increased or decreased in sedentary time at different rates. Participants in the control condition obtained ∼725 min of sedentary time. In the final model, there was a nonsignificant effect of the intervention on SB (Table IV). The effect size of the model implied means was d = .40. Day of the week did not have a significant main effect or interaction for SB.
Final Model for Sedentary
| 95% CI for slope | ||||
|---|---|---|---|---|
| Fixed Effects | Slope | Lower | Upper | p |
| Intercept | 725.47 | — | — | — |
| Time | 0.88 | 0.77 | −0.63 | 0.22 |
| Group | −81.97 | 46.86 | −173.82 | 0.09 |
| Weekend | −23.76 | 12.29 | −47.85 | .05 |
| Group * weekend | 33.2 | 18.5 | −3.06 | .07 |
| Random effects | Estimate | SE | ||
| Intercept | 19,799 | 4,854.69 | ||
| Time | 1.84 | 3.98 | ||
| Intercept-time | 128.37 | 94.53 | ||
| Residual | 13,563 | 712.40 | ||
Note. MVPA = moderate-to-vigorous physical activity. Models were conditioned such that the intercept represents the number of sedentary minutes for a control participant, on a weekday, on the first day of the study.
Discussion
The current nonrandomized controlled trial demonstrated the initial feasibility, acceptability, and preliminary efficacy of the NUDGE text messaging intervention. With only three text messages per day exchanged on average, the intervention group obtained 21 more minutes of MVPA and 82 fewer minutes of sedentary time. The satisfaction with the program was high and participant confusion or frustration were low.
In the development of NUDGE, we have used a minimalist approach to intervention design. Other valuable physical activity promotion packages are built on sound theory and contain many intervention strategies that are hypothesized to produce the treatment effect (Gourlan et al., 2016; King et al., 2013). Consistent with the ORBIT model of intervention development, our approach was to design the smallest possible intervention that could reasonably produce an effect (Czajkowski et al., 2015). By linking every possible text message to an element of control theory, we hoped to minimize wasted interactions with participants, and also reduce the risk of habituation. We attribute the high feasibility and acceptability to, at least in part, the minimalist approach to design. Given that participants are asked to use a familiar behavior (i.e., text messaging), it was relatively easy for them to complete the protocol. Moreover, as a result of oversampling females, the generalizability of the intervention is enhanced as girls transition more rapidly from obtaining adequate MVPA in youth to inactivity in adolescence and the effect is more pronounced than for boys (Nader et al., 2008).
It is important to note that while the aggregate effect of NUDGE exceeds that found in comparable text message interventions (Armanasco et al., 2017) and face-to-face health promotion programs (Cushing et al., 2014), the effects are not uniformly positive for every participant. That is to say, we think it is important to note that not every person who receives the intervention will engage in a clinically meaningful amount of more MVPA and less sedentary time. For instance, the lower bound 95% CI for MVPA is 4.8. Although even the participant who achieves this muted intervention effect is increasing MVPA at a level in keeping with prior physical activity interventions (Metcalf et al., 2012), additional studies that seek to optimize the effect of NUDGE are needed. In other words, there is value in raising the “floor” of the intervention effect so that the person who benefits the least still experiences a meaningful change. We expect that the variables that influence MVPA and sedentary time are likely to fluctuate within-person and that their effect will likely be different from person-to-person (Cushing et al., 2019). Importantly, the intervention period is quite brief (20 days) and additional studies are needed to understand the durability of the intervention effect over time.
We agree with the microtemporal framework put forward by Dunton (2018) as a way of identifying variables that can be used to optimize NUDGE. For example, we imagine that environmental context may moderate the effect of a NUDGE message. In our own work, we have demonstrated that when participants judge the weather to be poor they are less likely to engage in MVPA (Bejarano et al., 2019). Related, we have observed that adolescents are highly individualized in the degree to which their mood or energy level influences their MVPA or sedentary time (Cushing et al., 2017). These findings suggest that environment and mood states might be used to modify the delivery of an activity prompt or other intervention content. Another point of optimization is message timing. As a day progresses for an individual participant there is an asymptote in the probability that they are going to engage in meaningful exercise. Specifically, there appears to be a window of opportunity for prompting activity between 5 and 8 p.m. that deserves experimental investigation (Ortega & Cushing, 2020). Finally, some evidence exists that suggests digital interventions may not be the right solution for every participant who wants to change their physical activity behavior, some participants may benefit more from messages delivered by providers or practitioners than those delivered by a piece of software (Brannon et al., 2018). With these findings in mind, it will be important to demonstrate the effect of NUDGE in a larger clinical trial, and to determine if it has utility in clinical populations (e.g., pediatric overweight and obesity).
Limitations
This project is a nonrandomized trial. For this reason, both generalizability and causality are unknown. Second, the intervention period is short (∼3 weeks), and no maintenance phase was conducted. Therefore, we are not able to assess the durability of the intervention effect nor can we predict the point at which participants would have habituated to the intervention. Third, the sample is small which introduces three problems: (a) The sample is not fully representative of all those who might benefit from NUDGE, (b) the effect sizes are likely to change in a larger trial, and (c) the p < .05 criterion may be too stringent for a significance test. This report is of a nonclinical sample that is more likely to benefit from this type of intervention compared with one with significant impairments.
Real World Application
A brief intervention like NUDGE does have real-world application beyond its function as a pilot trial. It is meaningful to have an extremely brief intervention that improves MVPA in 20 days. Even if the intervention effect were to deteriorate after this window (an open empirical question) it is easier to maintain a behavior than to start it from nothing. Therefore, intervention content that follows after NUDGE has an abundance of MVPA to attempt to reinforce. Because the accelerometer was only used for outcome tracking, teens do not need to wear a smartwatch or accelerometer to benefit from NUDGE, which further enhances its real-world application. Finally, a real-world application would deliver texts directly to any phone. Because a smartphone is not needed the cost of entry for NUDGE is low.
Toward Recruitment of a Diverse Sample
The sample in this study was primarily white and upper income. This suggests to us that the community recruitment methods lack feasible for producing diversity on income and race. Future studies may need to employ clinic recruitment or more targeted recruitment from specific organizations where race and income diversity is present (e.g., Boys and Girls clubs, faith groups, etc.).
Conclusion
NUDGE should be explored as both a standalone physical activity intervention as well as part of a multicomponent package. This study serves as a useful model for mapping intervention components onto specific elements of an established theory. By using as few intervention components as possible the mechanism of action is unambiguous.
Funding
Data collection for the control group was supporded by a Targeted Research Grant from the Society of Pediatric Psychology awarded to CCC.
Conflicts of interest: None declared.
Footnotes
On review, colleagues requested that all measures administered to participants be listed. Because a larger number of measures were given that are not analyzed in the current report, we list them in the procedures section rather than the list of study measures which are used to evaluate the study aims.
Participants were provided with a smartphone because our app used for distributing surveys was unstable on phones it was not programmed for. For this reason, we gave participants phones so that we could ensure the app would work properly.
Participants were provided with a smartphone because our app used for distributing surveys was unstable on phones it was not programmed for. For this reason, we gave participants phones so that we could ensure the app would work properly.
References
DHHS. (
