


Abstract
The purpose of this study was to better understand conflicting findings in the literature regarding the adjustment of siblings of children with cancer by examining, in a single sample, differences in patterns of results as a function of reporter and comparator used (i.e., population norms, demographically matched classmates).
Self- and parent-report standardized measures of depression, anxiety, and behavioral problems were collected for 67 siblings and 67 demographically matched classmates. Comparisons were made to norms and controls.
Siblings consistently demonstrated poorer psychosocial functioning than their demographically matched peers across all measures but their scores did not differ from norms. A significantly greater percentage of siblings fell outside the normal range than that expected in the general population for parent-reported total and internalizing problems, but not for externalizing problems or the self-report measures.
Findings regarding the psychological adjustment of siblings of children with cancer differ according to the research methods used. It is important to use rigorous methods such as demographically matched peer comparisons when investigating the impact of childhood cancer on siblings.
Introduction
Every year, approximately 16,000 children in the Unites States are diagnosed with cancer (Siegel et al., 2017). Treatments for childhood cancers are invasive and intense. To meet the demands of treatment, families must reorganize their roles, typical routines, and responsibilities (Alderfer & Kazak, 2006). Because of this family-level impact, the adjustment of siblings of children with cancer has received research attention.
Systematic reviews (Alderfer et al., 2010; Long et al., 2018) and meta-analyses (Sharpe & Rossiter, 2002; Vermaes et al., 2012) of this literature generally conclude that siblings of children with cancer are an at-risk group in need of support (Gerhardt et al., 2015), experiencing poorer adjustment than norms or comparison peers. However, at the level of individual studies, conflicting results abound. Some studies reveal sibling emotional or behavioral difficulties in comparison to control groups or population norms (e.g., Santacroce & Crandell, 2014), some find no differences (e.g., Gianinazzi et al., 2013; Van Dongen-Melman et al., 1995); others suggest better psychosocial adaptation among siblings of children with cancer (e.g., Cordaro et al., 2012).
The variability in findings regarding the adjustment of siblings of children with cancer may be due to methodological differences across studies. Samples across studies differ, for example, in age range and time since the cancer diagnosis and these factors may relate to outcomes. Further, the specific constructs investigated (e.g., anxiety, depression), sources of information (i.e., sibling self-report, parent-report), and comparators (e.g., norms, controls) vary across and within studies. Early meta-analyses of this literature concluded that parent reports of sibling functioning revealed greater adjustment difficulties than sibling reports and that comparisons to norms resulted in larger effects than comparisons to control groups (Sharpe & Rossiter, 2002).
Given the variability in conclusions across and within studies, careful consideration of study design is warranted. Most studies of siblings of children with cancer use norms on standardized measures as their comparator. However, the way in which norms are used varies. Some authors interpret a sample mean falling within the normal range as indicative of normal functioning for the full sample. Others compare the mean in their sample to the mean in the general population through single sample t-test interpreting a statistically significant difference as an indicator of differential adjustment regardless of the level of adjustment. In contrast, other studies use z-tests to compare the percentage falling into the clinical range on their measure to the percentage of the general population expected in that range. Some studies provide data that allow for more than one of these methods of comparing data to norms within a single sample producing seemingly conflicting conclusions (e.g., Buizer et al., 2006; Kaplan et al., 2013; Long et al., 2013).
Only a small percentage of studies investigating siblings of children with cancer use peer samples as comparators. We identified seven such studies published since 1995 that investigated anxiety, symptoms of depression, or internalizing, externalizing, and total behavioral problems among school-aged siblings (Alderfer et al., 2003; Buizer et al., 2006; Cordaro et al., 2012; Dolgin et al., 1997; Gianinazzi et al., 2013; Lahteenmaki et al., 2004; Van Dongen-Melman et al., 1995.) Across these studies, only 4 significant differences were found among the 24 relevant analyses comparing siblings to control peers. Among the significant differences, both poorer (Lahteenmaki et al., 2004) and better functioning (Cordaro et al, 2012) among siblings were found.
This pattern of results raises important questions regarding the suitability of these control groups. In some of these studies, the purpose of collecting sibling data was primarily to provide a comparison to their brother or sister with cancer; direct comparisons between siblings and healthy controls were secondary (e.g., Buizer et al., 2006; Gianinazzi et al., 2013). In these studies, demographic similarity between the sibling and control samples was not considered and in others, demographic similarity was not well achieved (e.g., Alderfer et al., 2003; Lahteenmaki et al., 2004). Further, even when demographic matching was done (e.g., Dolgin et al., 1997; Van Dongen-Melman, 1995), samples sizes were often <60 per group, limiting statistical power to <80% to find even medium-sized effects.
Methodological decisions, such as the choice of a comparator, are important. Meta-analyses can only summarize patterns in available data and most studies of siblings of children with cancer use norms on standardized measures as their comparator. The small number of studies using peer comparators and the poor suitability of these groups as sibling controls may be why meta-analyses of siblings of children with chronic illness find larger and more reliable decrements in sibling adjustment when normative data, as opposed to peer controls, are used as the comparator. However, when sibling samples are small and/or non-representative of the general population or of the normative samples of the measures used, comparing sibling functioning to norms is not ideal (Lavigne & Faier-Routman, 1992; Long, 2019). Using a contemporary, adequately sized, demographically matched comparison group should provide the most rigorous and valid conclusions regarding the adjustment of siblings of children with cancer.
The overarching aim of this study was to compare results as a function of research method while providing a rigorous investigation into the adjustment of siblings of children with cancer. We recruited a relatively homogenous sample with respect to time since diagnosis, and both sibling and parent-report data on the adjustment of siblings were collected. These data were then compared with norms on standardized measures (in multiple ways) and to demographically matched comparison children. Based on previous patterns across studies, we predicted that within our study, different comparisons would yield different findings as follows: (a) the siblings of children with cancer would demonstrate poorer psychosocial functioning when compared with matched peers; (b) the mean scores for siblings as a group on the standardized measures would be within the normal range and not different from population means; and (c) a significantly greater percentage of siblings would fall into the at-risk/clinical range on the measures than that expected in the general population.
Materials and Methods
General Overview
Data for this study were drawn from a larger investigation of the social and emotional adjustment of siblings of children with cancer. The full study consisted of two phases of data collection (see Alderfer et al., 2015, for details). Phase 1 data were collected from peers, teachers, and siblings within classrooms and focused on the social functioning of the siblings. Phase 2 data were collected in the homes of these same siblings and of demographically matched classmates (one per sibling) and focused on emotional and behavioral adjustment. All procedures were approved by an Institutional Review Board and, for Phase 1, from participating schools.
A prior publication reported findings regarding the social functioning of the siblings in this sample (Alderfer et al., 2015). The Phase 1 classroom-based data revealed no differences between siblings (N = 87) and case-control comparison classmates (N = 256) on peer-based reports (N = 1,633) of social reputation, number of friendships and reciprocated friendships, or peer acceptance. Teacher-reported likeability and self-reported prosocial behavior were higher for siblings than comparison peers. Phase 2 data (N = 63 sibling-peer pairs) revealed that siblings’ reports of loneliness, friendship quality, and perceived social support did not differ from demographically matched peers; however, siblings’ mothers reported poorer school performance and lower levels of involvement in activities for their children than did mothers of the comparison peers.
All relevant data for this study were gathered in Phase 2 of the larger project.
Participants
Families were eligible for this study if they had: (a) a living child with cancer who was within two years of diagnosis or still on treatment; (b) another child aged 8–16 years without a chronic illness who attended regular classes; and (c) fluency in English. The sibling closest in age to the child with cancer was selected to participate in this study.
Detailed enrollment information is shown in Figure 1. In summary, 80% of eligible families approached for Phase 1 enrolled in the study and 71% of the schools approached for participation agreed. Classroom data were collected for 87 siblings (Alderfer et al., 2015). A total of 76 siblings (93% of eligible approached families) participated in Phase 2 of the study; 75 demographically matched classmates were approached for recruitment into the comparison group. A total of 67 (89%) enrolled in the study resulting in 67 matched pairs providing data for the current analyses.
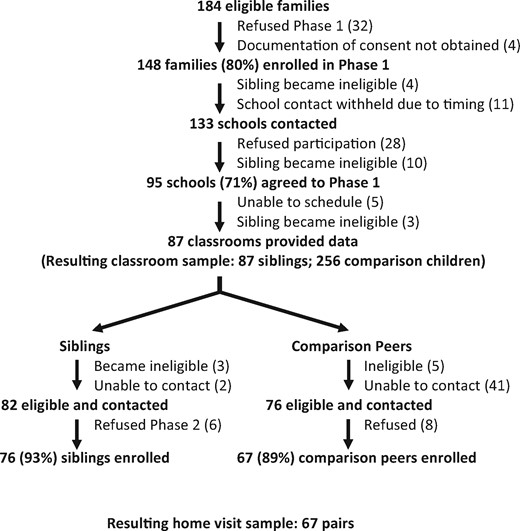
Recruitment and enrollment flow chart.
Across the 67 families of children with cancer, diagnoses included solid tumor (45% of the sample; N = 30); leukemia (33%; N = 22); brain tumor (13%, N = 9); lymphoma (8%, N = 5); and, other (1%, N = 1). Treatment plans included combinations of chemotherapy (84% of the sample), resection (42%), and radiation (37%) with 11% receiving bone marrow or stem cell transplant. The children with cancer ranged in age from 2 to 21 years (M = 10.0; SD = 5.3) and were 3–38 months postdiagnosis (M = 20.1; SD = 8.1) at the time of data collection. Information on treatment status was missing for 24% of the sample (N = 16), but most (57%; N = 38) were off treatment at the time of study. The participating siblings ranged in age from 6 to 15 years (M = 10.0; SD = 2.4) at the time of cancer diagnosis and most (66%; N = 43) were older than the diagnosed child (range in age difference: −7 to 10 years, M = 1.7; SD = 4.5). At the time of study, siblings and comparison peers ranged in age from 8 to 16 years and were similar across all measured sociodemographic characteristics (Table I). Overall, the sample was comprised of predominantly White/non-Hispanic, highly educated, two-parent families.
Demographics
| Siblings (N = 67) | Comparison peers (N = 67) | |
|---|---|---|
| Age: Range (M; SD) in years | 8–16 (12.2; 2.4) | 8–16 (12.3; 2.4) |
| Female gender | 55% (N = 37) | 55% (N = 37) |
| Race/ethnicity | ||
| White/non-Hispanic | 81% (N = 54) | 85% (N = 57)a |
| Black/non-Hispanic | 13% (N = 9) | 13% (N = 9) |
| White/Hispanic | 3% (N = 2) | 2% (N = 1) |
| Other/unknown | 2% (N = 1) | |
| Mother’s education (median category) | University graduate | University graduate |
| Household income (median category) | $100,000–$124,999 | $75,000–$99,999b |
| Married/partnered parents | 85% (N = 57) | 82% (N = 54) |
Not different from sibling sample, McNemar, p = .56.
Not different from sibling sample, Wilcoxon signed-rank test, p = .95.
Not different from sibling sample, McNemar, p = .75.
Recruitment, Consent, and Data Collection Procedures
Potentially eligible families of children with cancer were identified from the tumor registry of a large Northeast American children’s hospital. They were contacted by mail then phone to ascertain eligibility and interest in participating in a study of family and peer influences on sibling adjustment to childhood cancer. At the time of enrollment, parents were introduced to both Phase 1 and Phase 2 data collection; however, they only provided consent for the researchers to approach the sibling’s school for participation. Consent for Phase 1 data collection was collected from the families of siblings in the same manner as it was collected for all students in the sibling’s classroom (see Alderfer et al, 2015, for further details).
After Phase 1 data collection was complete for each sibling, their family was contacted to participate in Phase 2. Once they enrolled in Phase 2, comparison families drawn from the sibling’s classroom were identified and approached for participation. Comparison families were told that they were selected for participation in a study examining adjustment during times of stress based on their child’s specific set of demographic characteristics and experiences. Families were considered ineligible if any child within the family was diagnosed with chronic illness.
Two research assistants visited the homes of families interested in participating to obtain consent/assent and collect data. Children and parents were asked to complete a battery of questionnaires including measures of the child’s psychological adjustment. Families received $50 for completing the home visit.
Measures
The Children’s Depression Inventory—Short Form
This 10-item self-report inventory assesses the experience of symptoms of depression in the past 30 days on a 3-point scale (i.e., 0 = absence of the symptom, 1 = mild or possible presence of the symptom, and 2 = definite and evident presence of the symptom). Raw scores are summed and converted to T scores (M = 50, SD = 10), with higher scores indicating more depressive symptoms. T scores ≥60 are considered outside the normal range. Coefficient alpha in our sample was .76 (Kovacs, 1992).
The Revised Children’s Manifest Anxiety Scale
This 37-item self-report measure assesses anxiety in youth. The number of “yes” responses to the 28 items that comprise the Total Anxiety Scale are counted and converted to an age and gender-based T score (M = 50, SD = 10). Higher scores indicate more anxiety symptoms. T scores ≥60 are considered above the normal range. In our sample, coefficient alpha was .88 (Reynolds & Richmond, 1985).
The Child Behavior Checklist
The behavioral/emotional problems scales of this parent checklist were used in this study. Mothers’ responses were analyzed, with the internalizing (emotional) and externalizing (behavioral) problems subscale scores and the total behavioral problems scale converted to T scores based on the child’s age and gender (M = 50, SD = 10). Higher scores equate to more behavioral problems and scores ≥60 are considered above the normal range. Coefficient alphas for the summary scales, calculated in our sample were as follows: Total Problems (.94); Internalizing (.81), and Externalizing (.89; Achenbach & Rescorla, 2001).
Statistical Approach
The purpose of this study was to compare self- and parent-reported sibling adjustment to norms and to demographically matched comparison children. First, descriptive statistics were used to summarize the mean scores in the sample and frequencies were calculated to examine the percentage of siblings falling outside the normal range of adjustment (i.e., in the “at-risk” and “clinical” ranges combined) on each of the measures (Children’s Depression Inventory—Short Form [CDI-S], Revised Children’s Manifest Anxiety Scale [RCMAS], Child Behavior Checklist [CBCL] Internalizing, Externalizing, and Total Problems). Single group t-tests were used to compare the sample mean to the population mean (M = 50) for each measure. Binomial tests were used to compare the percentage of our sample falling outside the normal range to that expected in the general population (16%). Paired samples t-tests were used to compare sibling adjustment in our sample to the adjustment of the comparison children for continuous measures; effect sizes of these differences were estimated using Cohen’s d. McNemar tests were used to compare the percentage of siblings falling outside the normal range to the percentage of demographically matched classmates falling outside the normal range on each measure; effect sizes were estimated using odds ratios and their 95% CIs.
Results
Comparing Sibling Adjustment to Norms
Descriptive statistics (i.e., M, SD, and % outside normal range) for our sample across all measures are provided in Table II. Mean scores on all measures were within the normal range. There were no statistically significant differences between mean scores in our sample and the population mean across measures, ts (63–66) = −0.58 to 1.92, ps > .05, Cohen’s d = .02–.32. The percentages of siblings falling outside the normal range on the self-report measures were not significantly different from those expected in the general population (Depression: p = .50; Anxiety: p = .18). The percentages of siblings falling above the normal range on Total Problems and Internalizing symptoms were significantly greater than those expected in the general population (ps = .036 and .002, respectively). However, this was not the case for Externalizing symptoms (p = .22).
Sibling Adjustment and Comparison Peer Adjustment
| T-scores | Percentages in “at-risk/clinical” range | |||||
|---|---|---|---|---|---|---|
| Siblings | Peers | Paired t-test | Siblings | Peers | McNemar | |
| Adjustment measure | M (SD) | M (SD) | t (p value); Cohen’s d | % (N) | % (N) | p value; odds ratio (95% CI) |
| Self-report | ||||||
| Depression (CDI-S) | 49.34 (9.26) | 44.70 (7.91) | 3.01 (.004)a; .54 | 16.4 (11) | 3.0 (2) | .022c; 5.5 (1.22–24.81) |
| Anxiety (RCMAS) | 51.72 (10.15) | 45.42 (9.31) | 4.14 (.000)a; .65 | 20.9 (14) | 4.5 (3) | .007c; 6.5 (1.47–28.80) |
| Parent-report (CBCL) | ||||||
| Total problems | 50.23 (12.01) | 46.15 (8.61) | 2.17 (.034)b; .39 | 26.7 (16) | 3.3 (2) | .001d; 8.00 (1.84–34.79) |
| Internalizing | 53.20 (11.88) | 49.00 (7.88) | 2.32 (.024)b; .42 | 31.7 (19) | 10.0 (6) | .007d; 4.25 (1.43–12.63) |
| Externalizing | 49.55 (11.60) | 45.02 (9.75) | 2.37 (.021)b; .42 | 21.7 (13) | 6.7 (4) | .049d; 3.23 (1.06–9.97) |
Degrees of freedom for this analysis was 66.
Degrees of freedom for this analysis was 59 (families in which only fathers completed the CBCL were dropped from the CBCL analyses).
Number of valid cases, 67.
Number of valid cases, 60.
Comparing Sibling Adjustment to Demographically Matched Peers
Across all sibling-report and parent-report measures and all comparisons (i.e., mean scores and percentages falling outside the normal range), siblings demonstrated poorer adjustment than their demographically matched peers. The differences in means across measures were medium sized effects (d = 0.39–0.54). Siblings were 3.25 to 8 times more likely than their demographically matched peers to fall within the at-risk/clinical range on our measures of adjustment. See Table II for detailed statistical information.
Discussion
This study allowed us to re-evaluate possible explanations for inconsistent findings observed across sibling studies by incorporating various methodological approaches in one single study. This approach allowed us to control various sample characteristics, such as time since diagnosis, while conducting a range of comparisons to norms and demographically matched peers to investigate the emotional and behavioral adjustment of siblings of children with cancer. Our findings may have implications for studies investigating adjustment across a broad range of pediatric populations.
As a group, across a number of measures, the mean levels of sibling adjustment were similar to norms in regard to depression symptoms, anxiety symptoms, internalizing, and externalizing problems when reported by either siblings or their parents. The percentage of siblings exceeding normative levels of symptoms was no different from that expected in the general population when emotional symptoms were reported by the siblings themselves. However, when reported by parents, a greater number of siblings fell outside the normal range for total problems and internalizing symptoms. When compared with demographically matched peers, siblings consistently demonstrated poorer psychological functioning. These patterns in the data support most of our hypotheses.
Taken together, these findings suggest that our sample of siblings of children with cancer displayed “average” levels of psychological adjustment. However, demographic differences between our sample of siblings and the normative groups for standardized measures may mask important differences in adjustment. Overall, our sample consisted predominantly of White/non-Hispanic, well-educated, high socioeconomic status (SES) American families with two parents. Although these demographics represent participants from the tumor registry of the large Northeastern American children’s hospital from which our sample was drawn, they are not an adequate representation of the general population of children or families. When comparisons were made between siblings and peers carefully matched on demographic characteristics, important differences emerged and these differences pointed to poorer psychological adjustment for siblings. While at the time of data collection the siblings in our sample were, as a group, functioning within normative ranges and at a level similar to population means in the areas assessed, some may have been functioning better than average prior to the cancer diagnosis within their family, much like their demographically matched peers.
It is noteworthy that parent reports, but not sibling reports, resulted in a greater percentage of siblings being classified in the at-risk/clinical range of emotional functioning than expected in the general population. This was in contrast to our hypothesis that the pattern of results would be consistent across informants. There are a number of potential explanations for this discrepancy between reporters. This may, for example, reflect overestimation by parents regarding their children’s levels of psychological distress, perhaps reflecting their own levels of distress, or a reluctance of the siblings to fully disclose their levels of distress, perhaps due to factors such as concern about distressing their parents. This pattern of findings is consistent with a previous meta-analysis of the adjustment of siblings of children with chronic illness, in which parent reports produced a larger negative effect size than sibling reports (Sharpe & Rossiter, 2002). In the general population, low levels of concordance have been found across children and parents in their ratings of the severity of the child’s emotional and behavioral difficulties, especially for internalizing and anxiety symptoms (see Miller et al., 2014; Smith, 2007). This pattern of findings points toward the importance of using multiple informants with information regarding the child across settings (e.g., Schniering et al., 2000). Interestingly, given that the mean levels of functioning that parents reported for siblings did not differ from norms, it seems that in addition to a subset of siblings with poor adjustment there must also be a subset of siblings displaying exceptional adjustment. Further research is needed to identify different patterns of adjustment for siblings, focusing on both positive and negative outcomes.
The findings of this study need to be considered within the limitations of the design. Although multiple respondents were employed, we only collected self- and mother-report data. Data from additional sources (e.g., teachers) would have been valuable. Further, the study was cross-sectional in nature and the sample was somewhat heterogeneous in regard to sibling age and cancer treatment status. These factors may influence adjustment and, therefore, our findings may not generalize to siblings of other ages or siblings of children at other points in the cancer experience trajectory. Similarly, as noted above, our sibling sample was biased in regard to demographic variables. This may have contributed to less robust internal consistencies for some of the measures used, though all fell within acceptable ranges. Additionally, while our sample size was adequate for identifying medium-sized effects in comparisons between siblings and matched peers, it was not large enough, nor designed to statistically examine the effects of cancer diagnosis, treatment status, time since diagnosis, or other possible moderators of adjustment such as gender, age, or relative age in comparison to the child with cancer. Larger scale, longitudinal samples are needed to adequately address important questions related to the adjustment of siblings across the cancer trajectory within a developmental context.
The results of this study are relevant to the clinical work of pediatric psychologists. The findings suggest that there is an important subset of siblings who have difficulties with adjustment within the first few years after cancer diagnosis. Identifying siblings who are most at risk and providing them with interventions to support their adjustment is important and is now a standard of psychosocial care for families of children with cancer (Gerhardt et al., 2015). Future research should include more diverse samples, examine different patterns of adjustment within sibling samples, use multiple informants (e.g., teachers, peers), a range of indices of adjustment beyond symptoms of emotional and behavioral problems, and focus on factors capable of identifying those siblings at greatest risk for persistent difficulties to help clinicians achieve this goal. Only through such subgroup analysis will progress be made toward understanding and addressing the needs of siblings who are experiencing difficulties.
Although systematic reviews and meta-analyses generally point toward the conclusion that the siblings of children with cancer are, indeed, at risk for adjustment problems (Alderfer and Hodges, 2010; Gerhardt et al., 2015; Long et al., 2018; Sharpe & Rossiter, 2002; Vermaes et al., 2011) further research is needed to substantiate these claims. Given the limitations of comparing child adjustment to norms, and, more generally, the lack of direct replication studies, various shortcomings remain in the field. Thus, more rigorous methodological designs—for example, designs that compare siblings to demographically matched peers—are critical to better understanding sibling adjustment.
Acknowledgments
We thank the schools and families who participated in this study and the research team that contributed to conceptualization and conduct of the parent project including Diane L. Fairclough, Anne E. Kazak, Robert T. Noll, Rebecca Shorter, Shelby Rosario, Willy Tang, Lindsey Teitinen, Leela Jackson, Joanna Cohen, Jilda Hodges, David Moore, Kim Wesley, Stephanie Pelligra, Jessica Rosskam, Elizabeth Weyman, Chelsea Pasmore, Margaret Cheng, Rachel Bobrick, Ivy Pete, Kristen Craig, and Tracy Hills.
Funding
This work was supported by the American Cancer Society (grant number MRSG 05-213 CPPB to M.A.A).
Conflicts of interest: None declared.
