


Abstract
Determining how the health-related quality of life (HRQOL) is impacted by living with Sickle Cell Disease (SCD) can inform psychosocial interventions. The purpose of the present study is to determine if demographic and treatment variables predict membership into empirically derived subgroups of HRQOL among youth and young adults with SCD.
Three hundred and seven youth and young adults with SCD (mean 17.63 years ± 3.74 years, 50.5% female) completed the Pediatric Quality of Life InventoryTM Sickle Cell Disease Module. Latent profile analysis examined subgroups/classes of HRQOL and relationships with demographic and treatment variables.
Three distinct classes emerged: High HRQOL (34% of the sample), Moderate HRQOL (44% of the sample), and Low HRQOL (22% of the sample). Being female was associated with increased odds of being in the moderate or low groups. Living with more severe SCD (genotypes HbSS and HbSβ0 thalassemia) was associated with increased odds of being in the Low HRQOL group. Treatment with chronic red blood cell transfusion therapy was associated with increased odds of being in the High HRQOL group. Older age predicted a small increase in the odds of being in the Low versus High HRQOL group.
The present study adds to the literature on HRQOL in SCD by exploring person-centered, empirically derived groups of HRQOL. Identification of demographic and treatment factors that predict membership into those groups within a large sample assists in tailoring needed psychosocial interventions for youth with SCD.
Introduction
Sickle cell disease (SCD) is a group of inherited red blood disorders characterized by abnormal hemoglobin that affects approximately 100,000 Americans, the majority of whom are of African descent (Hassell, 2010). In those with SCD, red blood cells are misshapen, and their sickle-shaped leads to circulation problems, known as vaso-occlusive episodes (National Heart Lung and Blood Institute, 2014). Pain is a common symptom resulting from vaso-occlusive episodes and over time chronic episodes can lead to damage from repeated restricted blood flow. Low hemoglobin levels, or anemia, result from the shorter lifespan of sickled red blood cells and can lead to fatigue and exercise intolerance (National Heart Lung and Blood Institute, 2014). Additional complications include stroke resulting from the crescent-shaped blood cells reducing oxygen and blood flow to the brain, and infections from compromised immune system functioning (National Heart Lung and Blood Institute, 2014). Further, many youths with SCD experience neurocognitive difficulties across multiple domains such as memory and executive functioning, which have been associated with decreased quality of life (Allen et al., 2017; Hardy et al., 2018; Ludwig et al., 2018).
Due to advances in the medical treatment of SCD (e.g., penicillin prophylaxis, hydroxyurea, chronic red blood cell transfusion), youth with SCD now live well into adulthood and life-expectancies have increased dramatically over the past several decades (Quinn et al., 2010). Thus, medical care has changed from acute care to chronic management of symptoms, and psychological care is becoming increasingly important to improve quality of life (Lemanek et al., 2017). SCD has been associated with poor health-related quality of life [HRQOL; (Barakat et al., 2008)] which is conceptualized as an individual’s “appraisal of how his/her wellbeing and level of functioning, compared to the perceived ideal, are affected by individual health” (Panepinto & Bonner, 2012).
Several factors are known to relate to HRQOL in those with SCD, including gender, age, SCD severity, frequency of hospitalizations, and use of disease-modifying treatments (including hydroxyurea, a medication associated with decreased pain episodes in those with SCD, and chronic transfusion therapy to reduce the risk of stroke) (Panepinto et al., 2005). The sickle cell genotype has been used to categorize disease severity, given the lack of a standard measure of disease severity. Individuals with HbSS or HbSβ0 thalassemia genotype on average have more severe disease symptoms and complications, shortened lifespan, and lower HRQOL compared to patients with HbSC or HbSβ+ thalassemia genotype (National Heart Lung and Blood Institute, 2014). Older age has been associated with decreased HRQOL, with pain symptoms and complications increasing as a individual ages (Amr et al., 2011b). Some research suggests that female gender is associated with decreased HRQOL, but additional research is needed to explore the mechanisms behind this gender difference (Amr et al., 2011b). Chronic transfusion therapy has been associated with increased HRQOL, likely due to the decreased risk of stroke and physical complications of SCD (Beverung et al., 2014). Hospitalizations have been both qualitatively (Thomas & Taylor, 2002) and quantitatively (Dampier et al., 2010) linked to negative psychological experiences and reduced HRQOL. Conversely, research has shown a significant positive association between taking hydroxyurea regularly, decreased pain, and improved HRQOL (Badawy et al., 2017). Additionally, SCD has been associated with impaired psychosocial functioning and wellbeing, namely depressive symptoms, low self-esteem, neurological complications (e.g., cognitive decline and motor deficits due to stroke), low academic performance, and challenges to peer relationships (Lemanek et al., 2017). Therefore, maximizing HRQOL is a goal of most psychosocial interventions for those living with SCD.
One of the most widely used and validated measures of HRQOL in this population is the Pediatric Quality of Life InventoryTM Sickle Cell Disease Module (PedsQL SCD), which assesses HRQOL across multiple domains including pain and hurt, pain impact, pain management and control, worry, emotions, treatment, and communication (Panepinto et al., 2013). There is merit in considering the distinct profiles of impairment that individuals living with SCD might experience. Given that the phenotypic presentation of SCD is heterogeneous among youth with SCD, we expect subgroups of individuals whose HRQOL is differentially impacted by SCD exists. Simply looking at a total score across all HRQOL domains, or the mean of each HRQOL subscale across all members of a population, is not as informative as looking at profiles among the domains of HRQOL and determining if subgroups exist within a population. The ways in which HRQOL profiles characterize and differentiate these subgroups from one another can allow for psychosocial interventions targeted at specific areas of impairment to improve and/or areas of strength to foster. Additionally, determining variables that are associated with a particular profile can inform screening for treatment and provide insight into how HRQOL might differ based on demographic (age, sex, SCD genotype), therapeutic (e.g., treatment with chronic transfusion and hydroxyurea therapies), and disease severity (e.g., acute care utilization) variables.
Though research on HRQOL in those with SCD has found associations between variables of interest, and clinically meaningful cutoffs have been evaluated to categorize impaired pain-related HRQOL (Beverung et al., 2015), to date no study has utilized person-centered analytic approaches to explore the multidimensional construct of HRQOL. Latent profile analysis (LPA) is an exploratory person-centered analytic approach that facilitates the discovery of smaller homogenous profiles within a larger heterogenous population (Berlin et al., 2013, 2018). LPA allows for the identification of characteristics of the profiles to tailor interventions for these specific populations (Berlin et al., 2013). Previous research on youth with chronic illnesses (including diabetes, cerebral palsy, and asthma) has utilized LPA and discovered distinct HRQOL profiles (Kim et al., 2014). However, to date, HRQOL research in SCD has only focused on associations between HRQOL and other variables of interest including demographic factors and pain using variable-centered approaches (Lemanek et al., 2017). These studies typically explore HRQOL as the sample mean total score or the sample means of HRQOL subscales of the PedsQL SCD. No known study has explored patterns of HRQOL profiles in youth with SCD using LPA or has determined how demographic and treatment/therapeutic variables predict membership into different HRQOL subgroups.
For the present study, LPA was used to assign individuals probabilistically to unobserved (latent) groups based on similar patterns of subscale scores on the PedsQL SCD and determined if and how membership in those subgroups was predicted by demographic and treatment/therapeutic variables, specifically sex, age, SCD severity, use of hydroxyurea, utilization of chronic transfusion therapy, and acute care utilization (see Figure 1 for a conceptual model of the LPA). Further, to examine potential differences by age, a wide age range (8–24 years) of participants are included in the present study, including young adults. Emerging adults experience a transition from pediatric to adult care which requires them to navigate a new health system and become more responsible for their health. Young adults also experience increased disease severity which results in increased health care utilization and mortality risk ((Kayle et al., 2019); Quinn et al., 2010). Thus, the purpose of the present article is to empirically derive profiles of HRQOL in a sample of youth and young adults with SCD, and explore the predictive power of demographic and treatment variables, to inform clinical care of this population.
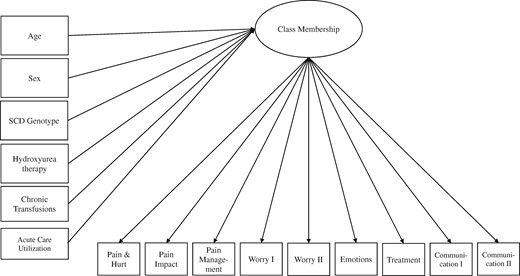
Latent profile analysis of health-related quality of life in youth and young adults with sickle cell disease. A conceptual model is presented, with demographic and treatment variables (pictured on the left) as predictors of the latent class membership variable, which is indicated by the nine subscales of the Pediatric Quality of Life Inventory Sickle Cell Disease Module, pictured on the bottom.
Methods
Participants and Procedure
Children and young adults, ages 8–24, who completed the PedsQL SCD instrument November 2014–December 2017 as part of participation in the Sickle Cell Clinical Research and Intervention Program (SCCRIP; Hankins et al., 2018) were included in the present study’s analyses. The purpose of SCCRIP is to understand the progression of SCD and psychosocial functioning across the lifespan from birth through adulthood by compiling medical, biospecimen, and psychosocial data (Hankins et al., 2018).
As of August 2017, 1,044 (92.3% of eligible) patients with SCD consented to participate in the SCCRIP study (Hankins et al., 2018). The most common reason for refusal was “do not want to spend extra time due to research activities,” but there was no difference in the demographics of those who agreed to participate and those who refused (Hankins et al., 2018) Youth and young adults were excluded from the present study if they had a history of a bone marrow transplant. Youth from the larger SCCRIP study below age 8 were not included because the PedsQL has a different response scale for children this age. The Institutional Review Board approved all SCCRIP study procedures and all participants, or their legal guardian (if participant was a minor), provided written informed consent before data collection began. Data from 307 youth and young adults were available for the present study. See Table I for the characteristics of the sample.
Sample Demographic and Health-Related Information (n = 307)
| Variables | Statistics |
|---|---|
| Age (years), M (SD) | 14.98 (3.74) |
| Race | |
| Black | 99.7% |
| Biracial | 0.3% |
| Ethnicity | |
| Non-Spanish Speaking/Non-Hispanic | 92.2% |
| Unknown | 7.8% |
| Genotype | |
| HbSS or HbSβ0 thalassemia | 69.7% |
| HbSC or HbSβ+ thalassemia | 30.3% |
| Sex | |
| Male | 49.5% |
| Female | 50.5% |
| Chronic red blood cell transfusions | 11.1% |
| Stroke | 2.9% |
| Acute chest syndrome | 42.7% |
| Hydroxyurea therapy exposure | 53.7% |
| Acute care utilization | |
| 0 visits | 11.1% |
| 1 or more visits | 89.1% |
Measures
Demographics and SCD Treatment Variables
As part of the SCCRIP study, demographic variables (age and sex) were collected from participants’ medical record. Additional health information, including SCD genotype, history of being prescribed hydroxyurea, use of chronic red blood cell transfusions, and acute care utilization data were also extracted from medical records. SCD genotype was coded as “more severe” if the individual had a HbSS or HbSβ0 genotype, and “less severe” if the individual had a HbSC or HbSβ+ genotype, consistent with past research (Quinn, 2016). For the present study, individuals’ data were coded as “yes” for hydroxyurea use if they were actively prescribed hydroxyurea at some point within one year prior to their PedsQL SCD completion date, and “no” if that medication was not listed in their active medications at any point during that year. Individuals’ data were coded as “yes” for chronic red blood cell transfusion if they received red blood cell transfusions at regular intervals (usually monthly) during the 1 year prior to PedsQL SCD completion. One-time transfusions, usually done for acute decline in the hemoglobin concentration due to an acute event (e.g., acute chest syndrome), were not considered chronic transfusions. If there was no evidence of regular transfusions, participants were coded as “no” for chronic transfusions. Acute care utilization was defined as emergency department visits and hospital stays (Brousseau et al., 2010). If an individual had been admitted to the emergency department and/or had a hospital admission for any reason during the 1 year prior to PedsQL SCD completion, they were coded as “yes” for acute care utilization.
The Pediatric Quality of Life InventoryTM Sickle Cell Disease Module
The PedsQL SCD is a 43-item self-report measure of HRQOL designed for individuals with SCD (Panepinto et al., 2013). Youth and young adults were asked to report how much of a problem items have been in the past 1 month using a 5-point Likert scale (0 = never to 4 = almost always). Items are reverse coded and linearly transformed to a 0–100% scale (0 = 100%, 1 = 75%, 2 = 50%, 3 = 25%, 4 = 0%), with higher scores indicating higher HRQOL and lower SCD symptoms. The total score is created by averaging all subscale items (α = .956 for the present study). Research has confirmed the 9-factor structure of the PedsQL SCD, with the following subscales created by averaging items: Pain and Hurt (9 items), Pain Impact (10 items), Pain Management and Control (2 items), Worry I (5 items), Worry II (2 items), Emotions (2 items), Treatment (7 items), Communication I (3 items), and Communication II (3 items). Pain and Hurt items encompass features and characteristics of pain, including items such as “I have pain so much that I need medicine” (α = .894 for the present study). Pain Impact items ask about how pain impacts an individual’s life and the subscale includes items such as “It is hard for me to do what others do because I have pain” (α = .923 for the present study). Pain Management and Control items are about managing and controlling pain symptoms, and the subscale includes items such as “It is hard for me to manage my pain” (α = .869 for the present study). Worry I items ask about worry related to pain and seeking emergency care and include items such as “I worry that I will have pain” (α = .860 for the present study). The Worry II subscale encompasses worry related to SCD complications like stroke and acute chest syndrome and includes items such as “I worry that I might have a stroke” (α = .742 for the present study). The Emotions subscale items are about emotional reactions to SCD and include items like “I feel mad I have sickle cell disease” (α = .693 for the present study). The Treatment subscale concerns feelings about medicine and other treatments for SCD and includes items such as “I do not like how I feel after I take my medicine” (α = .746 for the present study). The Communication I subscale asks about difficulty communicating with others about SCD symptoms and include items such as “It is hard for me to ask doctors and nurses questions” (α = .711 for the present study). Communication II subscale items are about communicating with others about having SCD and include items such as “It is hard for me when others do not understand about my sickle cell disease” (α = .755 for the present study).
Analytic Plan
Data were examined for missingness, univariate skewness, and univariate kurtosis. Missing data on the PedsQL SCD subscales was minimal (see Table II). No missing data existed for demographic and treatment variables, except acute care utilization. Since close to 10% of individuals were missing acute care utilization data, multiple imputation was conducted using m = 100 following the suggestion of Graham et al. (2007) using Mplus version 8.3 (Muthén & Muthén, 1998-2017) to avoid listwise deletion in prediction analyses. LPA was used to empirically derive subgroups of HRQOL. Full information maximum likelihood with robust standard error estimation was used in Mplus version 8.3, which takes into account missingness and nonnormal distributions (Muthén & Muthén, 1998-2017). Individuals were probabilistically assigned to unobserved, latent, classes of HRQOL, based on means of the PedsQL-SCD subscales as indicators of the categorical latent class variable.
Correlations of Demographic, Treatment, and Health-Related Quality of Life Variables
| 1. | 2. | 3. | 4. | 5. | 6. | 7. | 8. | 9. | 10. | 11. | 12. | 13. | 14. | 15. | |
|---|---|---|---|---|---|---|---|---|---|---|---|---|---|---|---|
| 1. Pain and hurt | – | ||||||||||||||
| 2. Pain impact | 0.687** | – | |||||||||||||
| 3. Pain management | 0.539** | 0.696** | – | ||||||||||||
| 4. Emotions | 0.374** | 0.431** | 0.351** | – | |||||||||||
| 5. Treatment | 0.529** | 0.483** | 0.353** | 0.482** | – | ||||||||||
| 6. Worry I | 0.572** | 0.645** | 0.537** | 0.510** | 0.524** | – | |||||||||
| 7. Worry II | 0.487** | 0.423** | 0.328** | 0.379** | 0.428** | 0.495** | – | ||||||||
| 8. Communication I | 0.378** | 0.382** | 0.362** | 0.414** | 0.531** | 0.494** | 0.337** | – | |||||||
| 9. Communication II | 0.410** | 0.433** | 0.365** | 0.465** | 0.536** | 0.545** | 0.357** | 0.507** | – | ||||||
| 10. Age | −0.206** | −0.134* | −0.015 | −0.149** | −0.042 | −0.205** | −0.064 | −0.003 | −0.114* | – | |||||
| 11. Sex (female) | −0.154** | −0.084 | −0.085 | −0.087 | −0.128* | −0.122* | −0.047 | −0.113* | −0.193** | 0.029 | – | ||||
| 12. Severity (more severe) | −0.094 | −0.040 | −0.001 | −0.116* | 0.045 | −0.079 | −0.165** | −0.051 | −0.072 | 0.001 | −0.043 | – | |||
| 13. Hydroxyurea (yes) | −0.142* | −0.055 | −0.059 | −0.012 | 0.118* | 0.025 | 0.026 | 0.001 | −0.016 | 0.147** | −0.056 | 0.440** | – | ||
| 14. Transfusions (yes) | 0.081 | 0.110 | 0.120* | −0.028 | −0.058 | 0.032 | −0.188** | 0.061 | 0.008 | −0.047 | 0.038 | 0.233** | −0.256** | – | |
| 15. Healthcare utiliz. (yes) | −0.124* | −0.072 | −0.008 | −0.021 | 0.043 | 0.019 | −0.041 | 0.027 | −0.033 | −0.181** | 0.045 | 0.190** | −0.015 | 0.086 | – |
| n | 307 | 307 | 305 | 306 | 301 | 306 | 306 | 304 | 306 | 307 | 307 | 307 | 307 | 307 | 277 |
| M*** | 68.00 | 55.37 | 63.93 | 71.36 | 72.55 | 68.29 | 79.86 | 77.77 | 62.83 | 14.98 | 50.5% | 69.7% | 53.7% | 11.1% | 88.1% |
| SD | 21.05 | 23.94 | 27.70 | 28.41 | 20.38 | 23.89 | 25.07 | 22.50 | 28.01 | 3.74 | – | – | – | – | – |
| Min | 2.78 | 0.00 | 0.00 | 0.00 | 16.67 | 0.00 | 0.00 | 0.00 | 0.00 | 11.00 | – | – | – | – | – |
| Max | 100.00 | 100.00 | 100.00 | 100.00 | 100.00 | 100.00 | 100.00 | 100.00 | 100.00 | 24.41 | – | – | – | – | – |
Notes. Acute care indicates those with acute care utilization; Transfusions, on chronic transfusion therapy; NS = not significant, p > .05; and PedsQL SCD, Pediatric Quality of Life Inventory Sickle Cell Disease Module.
p < .05.
p < .01.
Frequency presented for females, those prescribed hydroxyurea, those utilizing chronic transfusion, and those with one or more acute care visits/hospitalizations.
To determine the optimal model solution, models were compared on the Bayesian information criterion (with lower scores indicating better model fit), and the Lo–Mendell–Rubin (LMR) test and Bootstrap Likelihood Ratio test (BLRT), both of which provide p values that can be used to determine if statistically significant improvement in fit is achieved by including an additional class—for example, if a 3-class solution is statistically improved over a 2-class solution (Berlin et al., 2014). Entropy (ranging from 0 to 1 with higher scores representing greater classification accuracy) was also explored, though not used to decide between competing class models. Parsimony was favored (e.g., if a 3-class solution is not significantly improved over a 2-class solution, the 2-class solution would be chosen as the model of best fit). Models with small class sizes (approximately n = 35 or under) were not considered due to potentially low power and lack of meaningfulness (Berlin et al., 2014). Univariate entropy (Ej), a measure of how much an indicator variable identifies the latent classes and contributes to class separation, was assessed for indicator variables in the model of best fit. The closer Ej is to 1, the more informative the indicator is in identifying the latent classes, compared with Ej values closer to 0 that do not contribute much information about the latent class variable. Once the best-fitting model was determined, demographic (age and sex), and treatment variables (use of hydroxyurea, utilization of chronic red blood cell transfusion therapy) were included as predictors of class membership as R3STEP auxiliary variables following methods of Asparouhov & Muthén (2014). When including predictors as auxiliary variables, this results in classes remaining consistent and not shifting.
Results
Correlations, means, standard deviations, and ranges for all variables (and frequencies for categorical variables) can be found in Table II. The model fit information for 1–6 class LPA models is available in Table III. The model that had a significant p value for both the LMR and BLRT tests was chosen, namely, the 3-class model. Though the 4–6 class models did have lower Bayesian information criterion (BIC), the LMR p-value did not suggest that they were significantly improved over neighboring class models (though the BLRT tests did), and after examining plots of the profiles, meaningful additional class information was not gained from the 4 to 6 class models compared to the 3-class model. So, parsimony was favored, and the 3-class model was chosen and used in predictor analyses. The loglikelihood of the 3-class model was replicated four times, indicating that global (vs. local) maxima were likely found. Worry I, Pain Impact, Pain & Hurt, and Treatment contributed the most to the latent class separation (Ej = .446, .423, .326, and .301, respectively). Pain Management, Communication II, Emotions, Worry II, and Communication I contributed less information to the latent class variable (Ej = .293, .289, .286, .238, and .227, respectively).
Model Comparison for Latent Profile Analyses
| Number of classes | Entropy | BIC | LMR p value | BLRT p value | Smallest class size (n, %) |
|---|---|---|---|---|---|
| 1 | NA | 25,448.435 | NA | NA | 307 (100) |
| 2 | 0.847 | 24,587.536 | .0026* | .0000* | 145 (47) |
| 3 | 0.862 | 24,460.418 | .0003* | .0000* | 68 (22) |
| 4 | 0.847 | 24,437.634 | .2627 | .0000* | 25 (8) |
| 5 | 0.870 | 24,428.679 | .4837 | .0000* | 17 (5) |
| 6 | 0.889 | 24,426.959 | .3527 | .0000* | 20 (7) |
Note. The model solution chosen is bolded.
NA = not applicable; BIC = Bayesian information criterion; BLRT = Bootstrap Likelihood Ratio test; LMR = Lo–Mendell–Rubin test.
p < .001.
The 3-class model revealed three distinct classes: High HRQOL, Moderate HRQOL, and Low HRQOL. See Figure 2 for a graphical representation of the classes’ means on PedsQL SCD subscales. The High HRQOL encompassed 34% of the sample (n = 105), with PedsQL SCD subscale means ranging from 78.30 on Pain Impact to 95.69 on Worry II. The Moderate HRQOL was the largest subgroup (n = 134, 44% of the sample) and PedsQL SCD subscale means ranged from 50.02 on Pain Impact to 79.88 on Worry II. The Low HRQOL was the smallest class, with 22% of the sample (n = 68), with PedsQL SCD subscale scores ranging from 30.30 on Pain Impact to 55.55 on Worry II. Of note, the Pain Impact was the lowest subscale for all classes, followed by Pain Management and Worry I. The least negatively impacted domains were Worry II, and Communication I and II. HRQOL seemed to be similarly impacted across the different HRQOL domains, with the difference between the classes being high, moderate, or low levels of all subscales.
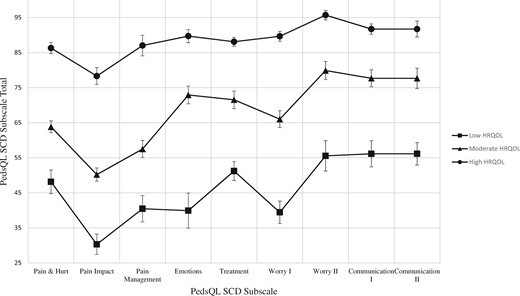
Results of latent profile analysis. This figure shows the grouping of individuals into three latent classes and each class’s mean score on each PedsQL SCD subscale with error bars representing the 95% confidence intervals.
Results of prediction analyses indicate that sex, SCD severity as measured by genotype, and use of chronic transfusion therapy were significant predictors of class membership (see Table IV). Being female was associated with an increase in the log odds of being in the Low (log odds = 0.924, p < .01) and Moderate (log odds = 0.615, p < .01) groups versus the High HRQOL group. Having more severe SCD was associated with a 1.061 increase in the log odds of being in the Low versus High class (p < .01). Utilizing chronic transfusion therapy was associated with a 1.136 increase in the log odds of being in the High versus Moderate group. Older age predicted a small increase in the log odds (0.120, p < .05) of being in the Low versus High HRQOL group. These variables did not significantly predict other class comparisons. Hydroxyurea use and acute care utilization were not significant predictors of class membership.
Comparative Demographic and Treatment Variable Predictions of Latent Class Membership
| Reference class | Comparison class | Predictor | Unstandardized estimate (log odds) | SE | OR | p value |
|---|---|---|---|---|---|---|
| High HRQOL class | Moderate HRQOL class | Age | 0.063 | 0.039 | 1.065 | .108 |
| *Sex (female) | 0.615 | 0.305 | 1.850 | .044 | ||
| Severity (more severe) | 0.243 | 0.400 | 1.275 | .543 | ||
| Hydroxyurea (yes) | –0.579 | 0.380 | 0.561 | .127 | ||
| *Transfusion (yes) | –1.136 | 0.572 | 0.321 | .047 | ||
| Acute care (yes) | 0.215 | 0.480 | 1.240 | .654 | ||
| Low HRQOL class | *Age | 0.120 | 0.047 | 1.127 | .011 | |
| *Sex (female) | 0.924 | 0.357 | 2.521 | .010 | ||
| *Severity (more severe) | 1.061 | 0.498 | 2.889 | .033 | ||
| Hydroxyurea (yes) | –0.605 | 0.439 | 0.546 | .167 | ||
| Transfusion (yes) | –1.071 | 0.637 | 0.343 | .093 | ||
| Acute care (yes) | 0.336 | 0.616 | 1.528 | .585 | ||
| Moderate HRQOL class | Low HRQOL class | Age | 0.056 | 0.047 | 1.058 | .233 |
| Sex (female) | 0.309 | 0.348 | 1.362 | .374 | ||
| Severity (more severe) | 0.818 | 0.500 | 2.265 | .102 | ||
| Hydroxyurea (yes) | –0.027 | 0.435 | 0.974 | .951 | ||
| Transfusion (yes) | 0.065 | 0.668 | 1.067 | .922 | ||
| Acute care (yes) | 0.209 | 0.630 | 1.232 | .741 |
Note. A one unit increase in the predictor variable results in the estimated log odds/OR of being in the comparison class versus the reference class. Redundant comparisons were excluded from the table.
HRQOL = health-related quality of life; NS = not significant, p >.05; Transfusion, use of chronic red blood cell transfusion; and Acute Care, utilization of acute care.
p < .05.
Discussion
The purpose of the present study was to derive subgroups of HRQOL in youth and young adults with SCD and determine if and/or how demographic and treatment variables might predict membership into subgroups. This is the first study to utilize person-centered analyses to explore HRQOL in a sample of youth and young adults living with SCD. The present study showed the grouping of individuals into three distinct latent classes distributed along the severity continuum (High, Moderate, and Low HRQOL). Based on these results, SCD appears to affect HRQOL in similar patterns across latent classes (at low, medium, and high amounts). Within classes, Pain Impact is the most negatively affected area by living with SCD, and Worry II (worry regarding SCD complications) is least negatively affected. Being female was associated with increased odds of being in the Low or Moderate HRQOL classes compared to the High HRQOL class. Having more severe SCD (based on genotype) and older age were associated with increased odds of being in the Low versus High class. The use of hydroxyurea and acute care utilization in the year prior to PedsQL SCD completion did not significantly predict membership into latent classes. Our results indicate that having a biologic female sex assigned at birth, being older, and living with more severe SCD are associated with membership into lower HRQOL groups and utilizing chronic transfusion therapy is associated with membership into the highest HRQOL group.
Results of the present study are comparable to Kim et al.’s (2014) findings of HRQOL in children with chronic health conditions including cerebral palsy and spina bifida. Kim et al. found 3 latent classes of HRQOL, with low, moderate, and high amounts of HRQOL. Our findings also support the Beverung et al. (2015) study identifying clinical cut-offs for two subscales of the Pediatric Quality of Life InventoryTM Sickle Cell Disease Module, the Pain and Hurt and the Pain Impact subscales, which also found a three-group classification (High, Intermediate, and Low functioning HRQOL) and associations with disease severity. Based on their results, scores of 60 or below are considered impaired HRQOL and scores of 81 or higher are considered good HRQOL. We found that scores on the Pain and Hurt and Pain Impact scales yielded a lower distribution of scores in our study compared to Beverung et al. (2015)’s findings. Our Low HRQOL group mean of Pain Impact was 30.30 and the Moderate HRQOL group mean of Pain Impact was 50.02, compared to Beverung et al. (2015)’s Low Functioning group with scores under 60. Our results also indicated that the Low HRQOL group had consistently low scores across all subscales, and the High HRQOL group had consistently high scores across subscales except for Pain Impact (78.30). The Moderate HRQOL group demonstrated impaired HRQOL on Pain Impact and Pain Management subscales and intermediate levels of HRQOL functioning on the other subscales, suggesting that clinicians may need to gather more information from individuals in the Moderate HRQOL group to determine the level of functioning and best ways to intervene. Comparing the patterns of HRQOL of the present study to the validation study of the PedsQL SCD (Panepinto et al., 2013), both found Communication I and Worry II to be among the least negatively imacted by living with SCD. Contrary to patterns of impairment in that study, in which Communication I was on average higher than Communication II [means in 70 s and 50 s, respectively across mild and severe groups; (Panepinto et al., 2013)] the present study’s empirically derived HRQOL groups evidenced similarly high HRQOL on both communication subscales compared to the other subscales.
The present study’s results are also consistent with research demonstrating an association between female sex differences related to poorer HRQOL (Amr et al., 2011a; Palermo et al., 2002). Our finding that female sex was associated with membership into poorer HRQOL groups could be explained by increased pain in females with SCD, though mechanisms behind this difference have yet to be fully explored. Similar to research suggesting that older age is associated with decreased HRQOL (Amr et al., 2011a), the present study found that age significantly predicted group membership such that older individuals were more likely to be in the lowest HRQOL group. This is similar to findings that older children have lower HRQOL than younger youth (Dampier et al., 2010), in addition to findings that adults have lower-rated HRQOL than young adults and adolescents (McClish et al., 2017). Likely mechanisms explaining this include increased pain and a higher risk of physical complications with increasing age.
Consistent with previous research on HRQOL in those utilizing and not utilizing chronic transfusion therapy, this treatment was associated with membership into a higher HRQOL subgroup in the present study, likely due to the decreased risk of stroke and physical complications such as acute chest syndrome (Beverung et al., 2014; Miller et al., 2001). Moreover, while research has evidenced a significant association between taking hydroxyurea regularly and higher HRQOL (Badawy et al., 2017), the present study did not find that the use of hydroxyurea was a significant predictor of latent class membership.
Although acute care utilization has been related to decreased HRQOL in past research, acute care utilization was not a significant predictor in the present study. This may be because previous studies define and measure acute care utilization differently, such as Dampier et al. (2010)’s use of caregiver/patient report, and Thomas and Taylor (2002)’s qualitative analysis of focus group themes. Further, unplanned acute care visits and hospitalizations for complications may have a different impact on HRQOL compared to planned hospitalizations such as preparation for a surgical procedure. Lastly, the statistical analyses in the present study take into account all predictor variables at once; past research finding a significant relationship between acute care utilization and HRQOL may not have found an effect if they included additional covariates, and/or the present study’s sample may be somehow unique. Further research is needed to better explore this.
These results have important implications for our understanding of this population and ways to improve clinical interventions. Across classes, the impact that pain has on an individual’s functioning, difficulty managing/controlling the pain, and worry about pain and hospitalizations were the most negatively affected domains. Worry regarding stroke and acute chest syndrome in addition to difficulty communicating with medical team members and others were the least negatively affected across classes. Of note, medical treatments and advances in the past decades have reduced the risk and severity of stroke and acute chest syndrome which is likely being reflected in these latent profiles. Conversely, pain affecting one’s life, difficulty managing it, and related worry about hospitalization and pain can have detrimental effects on social, emotional, and psychological wellbeing that are salient day to day and contribute to life impairment. Providers should continue to ask about how pain is impacting individuals’ lives since it is the most affected HRQOL domain in addition to how they are managing it. Providing psychological interventions to reduce the deleterious impact that pain can have on an individual’s life is important to improving HRQOL in this population in addition to treating worries about pain and hospitalizations. A recent review of psychological interventions for youth with chronic and recurrent pain suggests further research is needed to develop efficacious treatments that have lasting effects with more trials for youth with other chronic pain conditions such as SCD (Fisher et al., 2018). Lastly, utilizing a strength-based approach, given youth across groups rated communication with medical teams and others in their lives as the highest subdomains of HRQOL, psychological interventions for youth living with SCD could explore the potential therapeutic benefits of social support.
The results of the present study should be interpreted in the context of some limitations that can direct us towards meaningful future research. Firstly, the results of the current study might not be indicative of the true number of subgroups within the larger population of youth living with SCD in the United States. Future research is needed to replicate these findings in other samples to determine the actual number of classes in the broader SCD population. Furthermore, the present study utilizes cross-sectional observational data, so no claims on the causal or directional relations between predictor variables and latent classes can be made. Additionally, the use of hydroxyurea was assumed based on the prescription of the medication. Individuals might be prescribed hydroxyurea and not take the medication regularly, and adherence to the medication might be a more accurate predictor than the proxy medical record report of hydroxyurea prescription. Future research could also utilize the duration of chronic transfusion and hydroxyurea therapy, which could be more informative than binary (yes/no) predictors. Moreover, the PedsQL SCD was used in the longitudinal SCCRIP study to measure potential changes over time in HRQOL in children as they age into young adulthood. The benefit of using the same measure repeatedly for comparison can also serve as a limitation since the PedsQL SCD was normed in a sample of youth <18 years of age. However, internal consistency indicated overall favorable reliability of this measure in the present study. Further studies on HRQOL profiles in this population should also explore modifiable predictors of subgroup membership to inform psychosocial intervention development in addition to environmental factors that might contribute to HRQOL.
The present study examined empirically derived latent classes of HRQOL in youth living with SCD. Study strengths include the large sample size and a novel person-centered analytic approach to exploring the multidimensional construct of HRQOL in SCD literature. Three empirically derived subgroups within the sample were found, with individuals clustering into groups along the HRQOL continuum (High, Moderate, and Low). SCD affected HRQOL in similar patterns across latent classes (at low, medium, and high amounts). Female sex, older age, and severe SCD genotypes were associated with membership in poorer HRQOL groups. Chronic transfusion therapy was associated with membership in the highest HRQOL group. Identification of demographic and treatment factors that predict membership into those groups within a large sample of youth and young adults can assist in targeting the development and tailoring of psychosocial interventions for youth with SCD.
Funding
This work was supported by the American Lebanese Syrian Associated Charities (ALSAC). In addition, Dr. Porter (K01 HL125495) and Dr. Hankins (U01 HL133996) were supported by National Heart, Lung, and Blood Institute of the National Institutes of Health during the conduct of this study. The content is solely the responsibility of the authors and does not necessarily represent the official views of the National Institutes of Health.
Conflicts of interest: None declared.
References
National Heart Lung and Blood Institute (
Author notes
Megan Loew is now at the Minnesota Department of Human Services.
