


Abstract
Following the Journal of Pediatric Psychology’s special edition on health disparities, calling for Phase 2 research exploring mechanisms of racial groups in health disparities, this study aims to explore social information processing predictors of longitudinal hemoglobin A1c (HbA1c) trajectories in a racially diverse group of adolescents. The social information processing model of glycemic control in type 1 diabetes (T1D) posits that adolescents who make negative attributions about reactions of friends are likely to find adherence difficult in social situations, have increased stress, and have suboptimal glycemic control.
One hundred eighty-four youth with T1D completed self-report measures and HbA1c at three time points within 1 year was extracted from medical records. Growth mixture modeling empirically derived classes of HbA1c trajectories and explored predictive relationships of social information processing variables, demographics, and diabetes characteristics.
Three classes emerged: High Decelerating, Mid-High Accelerating, and Near-Optimal Accelerating. Black/African American participants were highly likely to be in the High and Mid-High groups. Higher anticipated adherence difficulties in social situations predicted increased odds of being in the Mid-High versus Near-Optimal HbA1c group. Increased diabetes stress predicted increased odds of being in the High versus Near-Optimal and Mid-High groups.
Continuing research on mechanisms behind this health disparity is necessary with more representation from varied racial and ethnic groups. Equal access to diabetes technology and psychosocial treatments are recommended and implications for clinical intervention development are discussed.
Predictors of HbA1c Trajectories in Predominantly Black Adolescents With Type 1 Diabetes
Type 1 diabetes (T1D) is a common chronic illness, affecting over 190,000 youths under 19 years old in the United States (Mayer-Davis et al., 2017). Research has demonstrated that racial and ethnic minorities experience significant disparities in achieving the American Diabetes Association-recommended hemoglobin A1c (HbA1c) levels and have higher rates of health complications compared with non-Hispanic whites (Petitti et al., 2009) in addition to higher risk of negatively impacted psychological functioning (Borschuk & Everhart, 2015). During adolescence, HbA1c is at its highest throughout the lifespan (Miller et al., 2015), with 75% of youth across racial groups under 18 not meeting glycemic control targets (Pinhas-Hamiel et al., 2014). This is due in part to psychosocial factors including diabetes-related stress and peer relations (Hains et al., 2006a). Exploring modifiable predictors of HbA1c, specifically in a majority Black/African American sample, can contribute meaningfully to the health disparity literature.
A modifiable factor of interest for this study is peer relations. A meta-analysis on interventions aimed to improve diabetes care and HbA1c in youth with T1D concluded that psychosocial factors, including peer relations, are so central that interventions which discount these processes are likely to have no effect on diabetes care or HbA1c (Hood et al., 2010). Although research often highlights the beneficial effects of peer relations (La Greca et al., 2002), a review by Palladino and Helgeson (2012) found peer conflict to be more detrimental than peer support is helpful in youth with T1D. For example, a study assessing peer interactions’ effects on youth’s psychosocial and disease outcomes found that greater conflict predicts worse self-care, depressive symptoms, and higher HbA1c, but peer support was not significantly related to these outcomes (Helgeson et al., 2009).
A developmental perspective elucidates the impact of peer relations on diabetes care in adolescence. Peer interactions become increasingly important during this period, when autonomy increases (Holmbeck et al., 2010). Adolescence is a time when perceptions of a given social interaction become progressively more important and may reflect a fear of noninclusion in a social group or disapproval from peers (Di Battista et al., 2009). Though adolescents with TID have greater problem-solving skills and diabetes knowledge than younger youth (Thomas et al., 1997), some youth may forego diabetes care in public to avoid perceived negative judgments from peers (Hains et al., 2009).
These processes have been explored in a series of cross-sectional studies using an adapted version of Crick and Dodge’s social information processing (SIP) model (Hains et al., 2006a,b, 2009; Sato et al., 2008). The SIP model posits a cyclical relation by which social cognitions lead to social behaviors, which are themselves bases of social evaluations by others, taking into account the role of memories of past experiences (Crick & Dodge, 1994). Hains et al.’s (2006a,b) diabetes-specific SIP model of glycemic control explains that cognitive appraisals involved with diabetes care efforts around peers include focusing on specific aspects of the situation, appraising others’ intentions incorrectly, or assessing ambiguous situations as negative in terms of potential consequences. Hains et al. (2006a,b) reported associations between higher negative attributions of friend reactions (NAFRs; expecting negative evaluations from friends when performing diabetes care in social situations), higher anticipated diabetes care difficulties in social situations, higher diabetes-related stress, and higher HbA1c. Thus, adolescents with T1D who are facing greater amounts of peer conflict compared with healthy peers, during a time in their development when fear of noninclusion becomes increasingly important to social functioning (Di Battista et al., 2009), are likely to behave in ways that promote perceived social inclusion, even if this is at the expense of diabetes care and outcomes.
However, this research on peer interactions and their impact on glycemic control has been cross-sectional and carried out in predominantly White samples with near-optimal average HbA1c. We have yet to understand if these SIP variables predict HbA1c similarly in diverse samples and if these relationships exist longitudinally. A systematic review of research in longitudinal HbA1c trajectories found that research in this area has focused on the following predictors of trajectory: demographic variables, disease-related variables (such as longer diabetes duration), and some psychosocial predictors (family climate, negative emotions, and peer conflict; Luo et al., 2018). However, none have explored social information processing variables as predictors of HbA1c trajectory groups in a majority Black/African American sample of adolescents. Distinct experiences of this sample, including institutional and individual instances of racism, have been noted to impact both same and cross-race peer relations, perpetuating inequality and racial disparities in health (Brondolo et al., 2012). Furthermore, evidenced race/ethnicity differences in adolescents’ level of social engagement, choice of peer group, perceptions of peers’ pro- and anti-social behaviors, and culturally accepted social norms (Cherng et al., 2014; Rubin et al., 2011) may influence adolescents’ glycemic control. Finally, one cannot overlook prevalent racism that exists within our society, further implicating the need to gain a better understanding of racial differences in peer interactions that may negatively affect diabetes self-care and ultimately perpetuate health disparities in this population.
The Journal of Pediatric Psychology’s recent special issue on addressing health disparities (Valrie et al., 2020) highlighted the need for advancing research toward understanding disparity determinants. This understanding of mechanisms that result in health disparities represents Phase 2 of Kilbourne et al.’s (2006) three-part model, which can drive intervention development and inform policy change (Phase 3, reduction/elimination of disparities). Research on racial health disparities in T1D has posited several mechanisms including lower SES, inequitable access to insulin pumps and other diabetes technology, and related barriers to equitable healthcare (Borschuk & Everhart, 2015; Willi et al., 2015). However, these differences alone do not fully capture the differences in glycemic control between the groups. Further research of Phase 2 factors that impact health disparities, including the exploration of HbA1c in adolescence for this study, are thus warranted and necessary.
Therefore, this study is a response to this call to action for increased research with diverse samples to better understand and eliminate health disparities. This paper aims to confirm findings from previous Phase 1 research confirming health disparities in glycemic control within Black adolescents, and explore differences in peer interactions between racial groups (Phase 2) that may potentially impact HbA1c trajectories. Importantly, this study utilizes a developmental framework to better understand glycemic control during adolescence, during which it is least optimally controlled for most individuals regardless of racial identity. In line with previous research, we hypothesize that SIP variables will significantly predict trajectory of glycemic control such that more NAFRs to diabetes care and anticipated adherence difficulties (AADs) will predict suboptimal glycemic control over time (Hains et al., 2006a,b). Additionally, given robust evidence for health disparities between racial groups, we expect Black/African American adolescents to enter the study with higher HbA1c values than White adolescents, and show slower rates of improvement than White participants (Semenkovich et al., 2019). Finally, it is hypothesized that increased diabetes-related stress, longer illness duration and lower income will predict less optimal glycemic trajectories, while insulin pump use will improve such trajectories (Petitti et al., 2009). By replicating and extending past research on modifiable predictors of glycemic control in a diverse sample of youth, this study aims to contribute to the growing literature base and inform future interventions aimed at reduction and elimination of health disparities.
Methods
Procedure
Youth and their caregivers participated in the Predicting Resiliency in Youth with T1D (PRYDE) study, a longitudinal examination of predictors of diabetes care, HbA1c, and quality of life in youth with T1D and their families (Klages et al., 2019; Rybak et al., 2017; Semenkovich et al., 2019). Institutional Review Boards at the University of Memphis and Le Bonheur Children’s Hospital approved study procedures before data collection began. Participants were eligible for the study if they were (a) aged 12–18 years old, (b) had been diagnosed with T1D at least 6 months prior to consent, (c) spoke English, and (d) planned to continue living in Memphis/receiving treatment at Le Bonheur Children’s Hospital for the next year. Eligible youth and their caregivers were approached to participate while at Le Bonheur Children Hospital’s endocrinology outpatient clinic. Caregivers provided written consent. Children 14 years of age and older provided additional written assent. Youth and caregivers completed questionnaire packets at baseline and approximately 6 and 12 months afterwards. A $10 gift card was provided as compensation for packet completion at each time point, allowing youth and caregivers to earn up to $30 each. Youth’s questionnaires from baseline and HbA1c from three time points are utilized in this study.
Participants
Of the 220 youth approached to participate in the study, 196 consented to participate. 184 individuals had HbA1c available for at least 1 time point and thus were included in this study (refer to analytic plan below for details on missing data handling). Sample descriptives are presented in Table I. Median annual household income range was $20,000–$24,999. Only 23% of participants used an insulin pump. Black/African American participants were significantly less likely than White participants to use an insulin pump, X2(1, 182) = 22.901, p < .001, w = .35, d = 0.76. Information was not obtained regarding participants’ use of continuous glucose monitors. Mean HbA1c level at the baseline study visit was 10.35% ± 2.48%. Eighty-seven percent of the sample had an HbA1c above 7.5%. Black/African American youth had significantly higher HbA1c at baseline than White participants, t (171) = 2.741, p = .007, d = 0.42. Of particular note, 28 youth (15% of the sample) had HbA1c values at or above 14%, the highest reportable value on the clinic’s point of care HbA1c instrument. Nineteen of these youth with HbA1c at or above 14%, 70% of this subset, identified as Black/African American (d = 0.93; odds ratio [OR] = 4.46, 95% CI: 1.45–13.68, z = 2.611, p = .009).
Sample Characteristics (N = 184)
| Variable | Statistic | N |
|---|---|---|
| Demographics | ||
| Race, % | 184 | |
| Black/African American | 57% | 105 |
| Non-Hispanic White | 43% | 79 |
| Household income, median | $20,000–$25,000 | 152 |
| Age (years), M (SD) | 14.64 (1.70) | 181 |
| Gender | 184 | |
| Female | 50% | 92 |
| Male | 50% | 92 |
| Diabetes characteristics | ||
| T1D duration (years), M (SD) | 4.69 (3.58) | 175 |
| Insulin pump users | 23% | 184 |
| HbA1c at baseline/ T1 | 10.35 (2.48) | 180 |
| HbA1c at baseline + 6 months/T2 | 10.39 (1.42) | 151 |
| HbA1c at baseline + 12 months/T3 | 10.61 (2.48) | 158 |
| SIP variables | ||
| Negative attributions of peer reactions | 1.78 (0.740) | 179 |
| AADs | 2.10 (0.731) | 179 |
| Diabetes stress | 1.22 (0.574) | 180 |
Measures
Demographics and HbA1c
Participants self-reported demographic information, including race, age, and sex, and illness duration. Their caregivers reported annual household income. Insulin pump use at baseline and HbA1c values was obtained from electronic medical records from the date closest to completion of questionnaires (within 1 month). All HbA1c values were measured in the outpatient endocrinology clinic using the DCA Vantage Analyzer, a point-of-care analyzer with an HbA1c range of 2.5–14% (Szymezak et al., 2008). On average, the second HbA1c time point was 6.54 months (± 2.15 months) after the baseline visit, and the final time point was 11.15 months (± 2.34 months) after the baseline visit.
NAFRs and AADs
The Attributions of Peer Reactions Scale-Short Form (APR-SF) provides a description of three situations in which children with T1D would need to practice diabetes care, such as taking insulin, while with friends. The APR-SF was adapted from the original scale (Hains et al., 2006a,b) to include the three friend vignettes that had the highest internal consistency and correlations with HbA1c. Examples of these vignettes include:
It’s Friday night and you and 3 or 4 friends are eating pizza at a friend’s house. You know the pizza has a lot of fat and protein. With all the noise and excitement, you get the feeling it is going to be hard to keep track of how much pizza you are eating. How do you think your friends would react if you did your diabetes care in this situation? (Hains et al., 2006a,b).
Youth are asked to what degree they agree with statements about how their friends would perceive them in this situation (e.g., “I’d think my friends would understand”) and about their anticipated diabetes care behaviors (e.g., “I think I would be likely to do my diabetes care in this situation”) on a Likert scale from 1 (strongly disagree) to 5 (strongly agree). Positively worded items are reverse scored. An average of five items regarding friend reactions is taken across vignettes to form the NAFR (Cronbach’s α = .93 for this study) subscale. Responses to five diabetes care-related responses are averaged across vignettes to form the AADs (Cronbach’s α = .88 for this study) subscale. Higher average scores indicate more negative friend reactions and more difficulty performing diabetes care. Both subscales have shown strong criterion, content, and construct validity (Hains et al., 2006a,b). Of note, this scale includes an item not used in the subscale score to serve as a validity check: “I have been in situations like this with friends.” This item was averaged across vignettes and compared across racial groups; there was not a significant difference on this item (t [171] = 0.225, p = .823, d = 0.03) when comparing Black/African American youth (M = 3.07, SD = 1.31) and White youth (M = 3.10, SD = 1.30).
Diabetes-Related Stress
Youth completed the Diabetes Stress Questionnaire (DSQ), a 65-item self-report measure with 8 subscales: distress-worry, peer stress, adverse-personal effects, parental stress, hyperglycemia, diabetes care, diet, and hypoglycemia (Delamater et al., 2013). Items ask youth to rate how stressful each situation is using a 4-point Likert scale, from 0 (not at all) to 3 (very much). Combining all subscales of the DSQ yields a total score (Cronbach’s α = .96 for this study) with higher scores indicating higher levels of stress (Delamater et al., 2013). The DSQ has evidenced measurement invariance across groups based on sex, age, and HbA1c (Kamody et al., 2014) and all subscales except hypoglycemia have been positively associated with HbA1c in past research (Klages et al., 2018).
Analytic Plan
Latent variable mixture modeling (LVMM), which includes growth mixture modeling (GMM), and latent class growth analyses (LCGM), was used to empirically derive subgroups of HbA1c growth trajectories (Berlin et al., 2014, 2018). LVMM allows for identification of relatively homogenous subgroups within a heterogeneous population. LCGM assumes no within-class variability and useful when modeling longitudinal data with smaller sample sizes or when more complex models fail (Berlin et al., 2014). LCGM was also used by the majority of studies exploring HbA1c trajectories in youth with T1D (Luo et al., 2018). Individuals were probabilistically assigned to latent classes of HbA1c trajectories based on HbA1c intercept, slope, and quadratic growth factor estimates and variances using Mplus version 8.0. The MLR estimator (maximum likelihood with robust standard errors) was used to account for nonnormal data distributions (Muthén & Muthén, 1998–2017). LVMM was used to compare one to 6 class models with intraclass variances in latent intercept, slope, and quadratic factor (a) allowed to vary freely within and between classes (GMM), and (b) constrained to be zero within class and allowed to vary between classes (LCGM). Additionally, individually varying time points were utilized, accounting for individuals’ completion of follow-up visits within a range of time, ∼6 months after the previous time point, but within a window of ± several weeks. HbA1c was modeled as a “censored” variable (e.g., a variable with either a “floor” or “ceiling” effect), since 15% of the sample had HbA1c values at the maximum that the clinic point of care instrument could measure (14%).
To determine the optimal model solution, models were compared on the Bayesian information criterion (with lower scores indicating better model fit), and the Lo–Mendell–Rubin test and Bootstrap Likelihood Ratio tests, both of which provide p-values that can be used to determine if statistically significant improvement in fit is achieved by including an additional class—for example, if a three-class solution is statistically improved over a two-class solution (Berlin et al., 2014). Parsimony was favored (e.g., if a three-class solution is not significantly improved over a two-class solution, the two-class solution would be chosen as the model of best fit). Models with small class sizes (∼n = 30) were not considered due to potentially low power.
Once the best-fitting model was determined, SIP variables (NAFR, AAD, and diabetes-related stress) were included as predictors of class membership, in addition to demographics (race, income, and age) and diabetes characteristics (T1D illness duration and insulin pump use). By including all as predictors, the unique variance of each predictor was estimated, above and beyond the variance explained by the other variables (essentially “controlling for” all other predictors) using the R3STEP procedure to avoid class shifting (Asparouhov & Muthén, 2014). Race differences were further explored to compare Black/African American and White participants on baseline characteristics including HbA1c group average, pump use, and percentage in each latent class. A significance level of .05 was utilized for all analyses.
Missing data were handled using full information maximum likelihood, which uses “observed responses to supplement the loss of information due to the missing responses” (Little et al., 2014). This approach allowed for inclusion of individuals with HbA1c available for at least one time point (n = 184). Of note, 9 participants had one HbA1c value present, 45 had two HbA1cs present, and the remaining had all three HbA1c values available for analysis. Multiple imputation was used only on baseline predictor variables (NAFR, AAD, diabetes-related stress, illness duration, insulin pump use, racial minority status, age, and household income) using 25 imputed datasets to account for missing data (which averaged 9.92% for predictor variables, refer to Table I for specific descriptives of each variable).
Results
Descriptives for all variables are available in Table I, see Supplementary Table 1 for a correlation matrix of all variables. The model fit information for 1–6 class GMM and LCGM models is available in Table II. Though the GMMs did have lower BICs than the LCGMs, for GMMs the BLRT consistently produced model errors, even after providing additional LRT start values (Asparouhov & Muthén, 2012). Previous quantitative research has identified the BLRT as the most consistent indicator of the true number of latent classes (Nylund et al., 2007), and this study’s GMM models lacked this information. Therefore, the LCGM model with the lowest BIC and a significant p value for the LMR and BLRT tests was chosen. A three-class LCGM was chosen and revealed three distinct quadratic HbA1c growth classes: High Decelerating HbA1c (n = 36, 20%), Mid-High Accelerating HbA1c (n = 70, 38%), and Near-Optimal Accelerating HbA1c classes (n = 78, 42%). This replicates previously findings presented in a review of HbA1c trajectories (Luo et al., 2018).
Model Comparison for Growth Mixture and Latent Class Growth Models
| Model type | Number of classes | Entropy | BIC | LMR (p-value) | BLRT (p-value) | Smallest class size (N, %) |
|---|---|---|---|---|---|---|
| LCGM | 1 | NA | 2,230.067 | NA | NA | 184 |
| 2 | 0.811 | 2,064.222 | <.0001* | <.0001* | 84 (46%) | |
| 3 | 0.818 | 2,015.391 | <.0001* | <.0001* | 35 (19%) | |
| 4 | 0.838 | 2,016.910 | 0.0093* | Error | 13 (7%) | |
| 5 | 0.835 | 2,005.039 | 0.1817 | Error | 15 (8%) | |
| 6 | 0.801 | 2,013.992 | 0.0718 | 1.0000 | 14 (8%) | |
| GMM | 1 | NA | 2,005.217 | NA | NA | 184 |
| 2 | 0.873 | 1,992.235 | 0.0034* | Error | 30 (16%) | |
| 3 | 0.807 | 1,985.764 | 0.1119 | Error | 18 (10%) | |
| 4 | 0.791 | 1,986.976 | 0.4153 | Error | 19 (10%) | |
| 5 | 0.709 | 2,006.403 | 0.9896 | Error | 5 (3%) | |
| 6 | Error | Error | Error | Error | – |
Note. NA = not applicable; LCGM = latent class growth model; GMM = growth mixture model; BIC = Bayesian information criterion; LMR = Lo–Mendell–Rubin test; BLRT = Bootstrap likelihood ratio test; Error = error in MPlus; could not provide result. The model solution chosen is bolded.
p < .05.
The High Decelerating HbA1c class had HbA1c of 13.92% at baseline with a significant positive slope and negative quadratic growth factor, indicating a rate of HbA1c change that was initially positive and decelerated over time (I = 13.917 [0.437], S = 3.768 (0.257), Q = −2.867 [0.262], ps all < .001). The Mid-High Accelerating HbA1c class had HbA1c of 11.29%, lower than the High Decelerating HbA1c class at baseline but still above the ADA target. A nonsignificant slope and a significant positive quadratic growth factor indicated acceleration, or increase, over time (I = 11.289 [0.226], p < .001; S = −0.285 [0.256], p = .112; Q = 0.747 [0.230], p < .001). The Near-Optimal Accelerating HbA1c class had an HbA1c of 8.15% at baseline, closer to the ADA target and lower than the other groups. This class had a significant negative slope and a significant positive quadratic growth factor, indicating that the rate of HbA1c change, though initially negative, was accelerating over time (becoming less negative; I = 8.147 [0.17], S = −0.376 (0.143), Q = .590 [0.119], all ps < .001).
See Table III for results of SIP variables and sample characteristics predicting latent class membership. Illness duration only significantly predicted membership in the Mid-High Accelerating versus High Decelerating class, the estimate is very small (.017). Increased AAD predicted increased odds of being the Mid-High Accelerating versus Near-Optimal Accelerating group. Increased diabetes-related stress predicted increased odds of being in the High Decelerating versus Near-Optimal Accelerating HbA1c group and the High Decelerating versus Mid-High Accelerating group.
Predictors of HbA1c Trajectory Class Membership
| Mid-High vs. near optimal | High vs. near-optimal | High vs. Mid-High | |||||||
|---|---|---|---|---|---|---|---|---|---|
| OR | 95% CI | p | OR | 95% CI | p | OR | 95% CI | p | |
| Demographics | |||||||||
| Race (Black/African American) | 0.96 | 0.23, 4.07 | .96 | a | a | a | a | a | a |
| Household income | 0.09 | 0.01, 1.06 | .06 | 0.33 | 0.02, 5.28 | .43 | 3.57 | .10, 131.99 | .49 |
| Age (years) | 0.82 | 0.59, 1.14 | .24 | 1.00 | 0.68, 1.47 | .98 | 1.21 | .83, 1.78 | .33 |
| Diabetes characteristics | |||||||||
| T1D duration (years) | 1.01 | 0.99, 1.03 | 0.22 | 1.00 | 0.98, 1.10 | .63 | 0.98 | 0.97, 1.00 | .03* |
| Insulin pump user | 0.39 | 0.13, 1.19 | 0.10 | 0.26 | 0.04, 2.00 | .20 | 0.68 | 0.09, 4.91 | .70 |
| SIP model | |||||||||
| NAFRs | 0.60 | 0.20, 1.81 | 0.37 | 1.10 | 0.38, 3.17 | .86 | 1.83 | 0.50, 6.67 | .36 |
| AADs | 3.35 | 1.17, 9.61 | 0.02* | 0.65 | 0.19, 2.20 | .49 | 0.19 | 0.037, 1.00 | .05 |
| Diabetes stress | 1.94 | 0.66, 5.71 | 0.23 | 8.38 | 2.09, 33.55 | <.01* | 4.32 | 1.16, 16.03 | .03* |
Note. The first class listed in each column is the reference class. A one unit increase in the continuous predictor (or being a member of the categorical group) results in the reported OR of being in the reference class versus the comparison class.
ORs were extremely large and are not presented due to lack of numerical interpretability.
p < .05.
See Figure 1 for a graphical representation of the classes’ distinct trajectories and the racial makeup of each group. Identifying as Black/African American was associated with highly increased odds of being in the High Decelerating class compared with both the Mid-High Accelerating and Near-Optimal Accelerating groups. Since only 1 youth identifying as White was in the High HbA1c class, and only 29 White youth were in the Mid-High group, the logistic regression of the latent class membership variable on the race variable was underpowered and resulted in extremely large ORs (ordinal effect sizes: d = 1.09, r = .48). This could reflect an extreme health disparity in our sample and/or may require future research with enough White youth with less than optimal HbA1c to have enough power to estimate the predictive power of the race variable itself. Within the Black/African American subset of our sample, 7.5% were in the Near-Optimal class, 21.5% were in the Mid-High class, and the majority 67.3% were in the High HbA1c trajectory class.
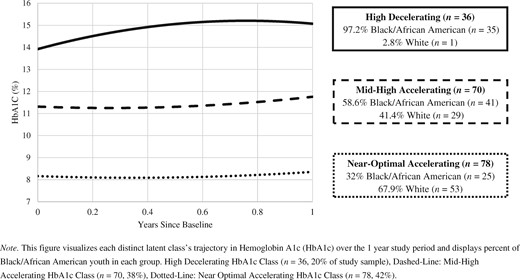
HbA1c trajectory classes and racial compositions (N = 184).
Discussion
The purpose of this study was to confirm past Phase 1 research on T1D racial health disparities in glycemic control and extend the literature base of Phase 2 research on factors that might explain these disparities, particularly SIP variables found to be salient for adolescents with T1D in past cross sectional research. This study replicated past longitudinal HbA1c trajectory research by empirically deriving three subgroups within the this study sample (High Decelerating HbA1c, Mid-High Accelerating HbA1c, and Near-Optimal Accelerating HbA1c; Luo et al., 2018). In Luo et al.’s (2018) systematic review, most studies found a group with near-optimal HbA1c (average around 7.5%) at baseline and a group with sub-optimal HbA1c (average around 9%) at baseline, and several studies found an additional group of higher HbA1c (>9%), at baseline (Luo et al., 2018). This is similar to this study, which found trajectory groups with baseline HbA1c in the near-optimal, mid-high, and high ranges, but all group means for this study are higher than the majority of studies included in the review. The majority of individuals in this study were in the accelerating/deteriorating groups with HbA1c that was increasing over time. This is likely due the majority Black/African American sample used in this study.
This article extended the literature base on the SIP model of glycemic control by discovering that higher AAD was associated with increased odds of being in the Mid-High class compared with the Near-Optimal class and that higher diabetes-related stress and identifying as Black/African American were associated with increased likelihood of being in the High class compared with the Mid-High and Near-Optimal classes. Additionally, health disparities in glycemic control were apparent in this study, with Black/African American youth less likely to use an insulin pump, having higher HbA1c on average, and composing 70% of individuals with HbA1c at 14%, the maximum of the clinic’s point of care testing machine.
Providing access to equitable diabetes technology and education, advocating for policy changes, and further research identifying modifiable mediators of these disparities is essential. Though insulin pump was not a significant predictor of HbA1c trajectories in this study, this was potentially due to the small amount of pump users (23.4% of the sample). A large-scale study utilizing data from over 10,000 youth in the T1D Exchange Clinic Registry on health disparities found similarly low rates of pump use in Black/African American children and adolescents (Willi et al., 2015). However, access to insulin pumps alone would not likely close the glycemic control gap since it did not explain all of the variability in HbA1c across groups. These findings can inform clinical care.
Clinically, youth anticipating that they will have trouble adhering to their treatment regimen in social situations (AAD in this study) is an important context to consider in terms of treatment planning. Treatments seeking to improve diabetes care in youth with T1D that take into account the psychosocial aspects of living with this disease often show greater improvements in outcomes posttreatment than those that focus solely on discrete behavior change such as increasing frequency of blood glucose monitoring (Hood et al., 2010). Working with youth to target behavior change in the context of social interaction could improve HbA1c but should be considered distinct from peer support. Greco et al.’s (2001) four-session intervention incorporating adolescents and their best friends into a structured group format focused on diabetes education, problem-solving, peer support, and stress management surprisingly found no effect on increasing social support in adolescents with T1D. Hains et al. (2009) found that a higher level of peer support, seemingly counterintuitively, is actually associated with a stronger relation between diabetes-related stress and HbA1c, perhaps because adolescents with higher diabetes stress may not make good use of coping support from friends.
Since this study suggests that increased diabetes-related stress is related to increased odds of being in a High Decelerating HbA1c trajectory group, peer support interventions might be ineffective (or even counterproductive) in lessening the effect of stress on long term HbA1c trajectory. Also, taking into account the results of Palladino and Helgeson’s (2012) review, which found that peer conflict has a greater impact on outcomes than peer support, it could be beneficial to adapt Greco et al.’s intervention to focus more on coping with anticipated peer conflict rather than on increasing peer support. A study in youth with T1D testing the effectiveness of a social learning intervention, aimed at providing training in addressing diabetes care difficulties in social situations, found significant declines in HbA1c for the intervention group compared with a matched control group that received treatment as usual (Kaplan et al., 1985). Since NAFR is related to AAD cross-sectionally, teaching youth skills to restructure their initial negative cognitions about their peer’s beliefs, in addition to addressing anticipated social barriers to treatment diabetes care, could decrease NAFR and result in lower AAD. Lower AAD would be associated with increased odds of being in the Near-Optimal versus Mid-High group, potentially decreasing HbA1c over time. Further research on this would be beneficial.
Greater diabetes-related stress has been related cross-sectionally to higher HbA1c and this study adds to this literature base by exploring the longitudinal associations. Previous stress management training conducted with adolescents has found mixed results for its effect on HbA1c, with the majority of studies finding no pre–post intervention differences (Boardway et al., 1993; Hains et al., 2001; Silverman et al., 2003). However, these interventions did not incorporate social aspects of T1D management or the role of peers explicitly. Focusing on stress in the context of social interactions is needed, and providing stress management training along with skills similar to Kaplan et al.’s (1985) social learning intervention would likely result in decreased HbA1c, but further intervention development and research is needed to confirm this hypothesis. Last, an eight-session coping skills intervention for youth with T1D with modules including stress management, communication skills, cognitive-behavioral skills training, and problem solving, showed significant improvements youth’s psychosocial functioning, though future research on its efficacy across racial groups is needed (Grey & Berry, 2004).
For Black and African American youth, exploring and addressing stressors at multiple levels of their interacting social systems could be an important avenue for future research and intervention as well, especially contextualizing within the minority stress model. Additionally, this study focuses on risk factors and learning more about protective factors that contribute to better health outcomes and psychosocial functioning within communities of color would provide a depth and richness to a story that is often one-sided or narrow in its scope. Exploring the mechanisms of differences in SIP variables, including the potential impact of factors such as experiences of racism, racial/ethnic composition of adolescents’ environments, racial attitudes, and racial/ethnic identity could highlight avenues for culturally tailored interventions to improve glycemic control over time.
Further areas of future research include replicating the results of this study in a larger sample over a longer period of time. Including a larger amount of White youth with suboptimal glycemic control to compare to a large amount of Black youth could allow for more power to test race differences in higher HbA1c trajectories and provide interpretable ORs. Of note, this study explored non-Hispanic White and Black/African American youth, it is unknown if the same latent classes would be present in different samples. Further, though the validity item on the APR used in this study did not differ significantly on average across racial groups, since the APR was developed with a majority White sample, future research should explore this measure’s psychometric properties across racial groups and further refine it. Moreover, data collected during naturalistic experiences with friends and peers or using ecological momentary assessment on NAFR, AAD, diabetes-related stress, and actual diabetes care performed could link social cognitions with actual diabetes care behavior. Finally, future research should consider the intersecting identities of youth with T1D, and the multiple sociocultural levels at which they interact with their world (e.g., individual, familial, community, and macrosystem). By broadening our scope of research to include diverse samples, enriching our research base to study the broad spectrum of psychosocial factors that impact the health and wellbeing of youth with T1D and their families, we strive to push the field of pediatric psychology forward.
In support of youth of color living with T1D and their families, we hope that by acknowledging the limitations and gaps in our current knowledge, that we can drive future vital research on diverse populations living with T1D. This article situates itself amongst past research confirming health disparities in glycemic control that show Black/African American youth are at a disproportionate risk for suboptimal glycemic control. This study also provides several potential avenues of intervention development and future research to better understand this disparity and strive to improve the health and psychological functioning of youth living with T1D.
Supplementary Data
Supplementary data can be found at: https://dbpia.nl.go.kr/jpepsy.
Acknowledgments
The authors would like to thank the families at Le Bonheur Children’s Research Hospital for their time, participation, and valuable contribution to science.
Funding
This work was supported in part by a grant from The University of Memphis Faculty Research Grant Fund to K. S. Berlin. This support does not necessarily imply endorsement by the University of Memphis of research conclusions.
Conflicts of interest: None declared.
