


Abstract
This study evaluated associations between parent–child connectedness and communication, parent feeding behaviors (restriction, pressure to eat, and monitoring), and age- and sex-standardized child body mass index (zBMI) in a sample of pre-adolescent children aged 8–12 years.
A community sample of three hundred and eight child–parent dyads completed measures of communication and connectedness. Parents completed a feeding behavior measure and children were weighed and their height was measured. We examined whether parental feeding behaviors and parent–child communication and connectedness predicted child zBMI and whether parental feeding behaviors moderated the association between parent–child communication and connectedness and child zBMI.
Feeding restriction was positively associated with zBMI, while both pressure to eat and food monitoring exhibited negative associations with zBMI. Child-reported communication was inversely associated with zBMI and parental pressure to eat moderated this association such that lower pressure to eat predicted a stronger association between communication and zBMI.
These findings are consistent with previous research suggesting that parent feeding strategies and parent–child communication are important contributors to child weight status. This study also provides preliminary evidence suggesting that adaptive parent–child communication is associated with lower body mass when parents avoid pressuring their child to eat. Our study provides an important extension of this body of research into middle childhood, a relatively understudied developmental stage.
Introduction
Research examining factors that contribute to weight status in children has proliferated over the past decade. An extensive literature suggests that parents’ influence on food availability, the structure of meals, and the modeling of eating habits impact a child’s development of lifelong dietary habits and may contribute to child weight (Koplan et al., 2004; Ventura & Birch, 2008). However, studies examining associations between parent feeding practices and children’s eating behavior and weight status have yielded mixed results. While some studies have found no significant associations between parents’ feeding behaviors and child BMI (Gregory et al., 2010), most studies identify parent feeding practices as an important contributor to child weight status (Faith et al., 2004). Specifically, high levels of parental control over eating have been linked to higher body mass in children, while encouraging children to eat healthy foods and monitoring child food intake is associated with lower weight status (Zhang & McIntosh, 2011). A closer look at findings in this area of research suggests an even more nuanced relationship between parent feeding practices and child weight. For example, while Rodgers et al. (2013) found high levels of caregiver restriction, pressure to eat, and monitoring to predict maladaptive weight outcomes in children, Steele et al. (2014) found moderate levels of restriction, pressure to eat, and monitoring predicted the best outcomes in a pediatric weight control intervention.
Parent–child relationship variables have also been shown to have important implications for child weight status and parent feeding practices. Pre-adolescent youth are acquiring important developmental skills, including increased autonomy and realigning their relationships with parents to adjust for increased independence (Hauser Kunz & Grych, 2013; Holmbeck, 2018). However, parent–child communication and connectedness remain important for child socio-emotional development during this developmental stage (Finkenauer et al., 2002; Keijsers et al., 2010; Keijsers & Poulin, 2013). While pre-adolescent youth are spending more time outside of the home and with peers (Larson et al., 1996; Steinberg & Morris, 2001), research suggests that they are more open to parental influence than their older peers (Darling et al., 2008) and that most of a pre-adolescent’s eating is under parental supervision (from ages 10 to 14 years old; Miller et al., 2012). As such, parental involvement in both the parent–child relationship and the child’s eating behavior at this age suggests that this relationship may be an important correlate of child weight outcomes.
A meta-analysis examining the parent–child relationship during childhood suggested that this relationship may have important implications for child weight and parent feeding practices; however, most studies show small effect sizes (Francis et al. 2001; Pinquart, 2014). Still, parent–child connectedness (the extent to which a child feels loved, cared for, and close to their parents; Boutelle et al., 2009) has been shown to be associated with child eating and weight. A few studies have shown that low child-reported connectedness with their mother is associated with unhealthy weight control behaviors and attitudes (Ackard et al., 2006; Goossens et al., 2012). Most studies examining the parent–child relationship and effects of this construct on parental feeding behavior and child weight are either in younger children or adolescents, which leaves much about these associations during pre-adolescence unknown.
Parent–child communication, defined as the extent to which parents perceive that they listen to their child and the extent to which the child perceives that their parent listens to them, may also be an important part of promoting optimal parental feeding behaviors and child weight outcomes. This may be especially salient in pre-adolescents, as they have not yet begun to separate from parents by limiting their communication about personal issues (Keijsers & Poulin, 2013). Lanigan (2012) found that family communication accounted for 29% of the variance in parent feeding efficacy and knowledge. The amount and quality of communication also appears to play a role. For example, Parletta et al. (2012) found that incendiary, negative parent–child communication predicted higher child BMI in youth 2–12 years old, while positive parent–child communication has been shown to contribute to healthy behavioral and social outcomes through their ability to effectively co-manage activities and routines (Giallo & Gavidia-Payne, 2006). Another study suggested that lower levels of parent–child communication were associated with higher levels of parental dietary control in 12–19 year olds (Keijsers & Poulin, 2013). Overall, findings suggest parent communication may have important implications for parent feeding practices and child weight outcomes, especially given that high levels of parental dietary control are predictive of maladaptive weight outcomes (Rodgers et al., 2013).
Taken together, parent–child relationship variables appear to play a significant role in both parental feeding practices and child weight status. However, the direction and degree of these specific associations have not yet been examined. If parent–child relationship variables are associated with parent feeding practices and child weight outcomes in pre-adolescents, these findings would provide preliminary evidence that interventions aimed at enhancing the quality of the parent–child relationship may be helpful in promoting healthy child weight outcomes.
Therefore, this study aimed to assess the associations between parent–child communication and connectedness, parental feeding practices, and child body mass. We hypothesized that (a) parent–child connectedness and parent–child communication would be inversely associated with age- and sex-standardized body mass index (zBMI), (b) parent feeding practices would moderate the association between parent–child connectedness and child zBMI such that this association would be more stronger at lower levels of restriction, pressure to eat, monitoring, and (c) parent feeding practices would moderate the association between parent–child communication and child zBMI such that this association would be more stronger at lower levels of restriction, pressure to eat, monitoring.
Methods
Participants
Three hundred and eight child–parent dyads were recruited from five elementary schools within a western public-school district. Inclusion criteria required that (a) the child was between the ages of 8–12 years old, (b) the child had no serious health-related concerns that would preclude participation in physically rigorous activity, (c) one parent/guardian participated in the study and provided consent, (d) the child provided written assent, and (e) the parent/guardian and child spoke English (see Table I for demographic and anthropometric data). Parent/child dyads were recruited as a part of larger study through a brief announcement and a flyer provided to children during physical education classes. Only those parent–child dyads who signed and returned consent/assents form were enrolled in the study. The number of parents and children who passively declined or did not return a consent form is unknown. Of the children whose parents provided informed consent, 14 children declined to participate. Children at participating schools received a visit from a local university mascot and parents/guardians received modest monetary compensation (i.e., $5.00 Amazon gift card) for participating.
Summary of Demographic and Anthropometric Data
| Characteristic | All participants |
|---|---|
| N | 308 (144 males) |
| Mean age (SD) | 9.73 (0.91) |
| Mean zBMI (SD) | 0.106 (1.043) |
| BMI category (%)* | |
| Underweight | 7 (2.3%) |
| Normal weight | 247 (80.2%) |
| Overweight | 32 (10.4%) |
| Obese | 20 (6.5%) |
| Race/ethnicity (%) | |
| Caucasian | 254 (82.50%) |
| Hispanic | 24 (7.80%) |
| Pacific Islander | 5 (1.62%) |
| Black | 1 (0.32%) |
| Asian | 1 (0.32%) |
| Multiracial and other | 23 (7.47%) |
| Grade (% in each) | |
| 3rd grade | 109 (35.40%) |
| 4th grade | 92 (29.90%) |
| 5th grade | 105 (34.10%) |
| 6th grade | 2 (0.60%) |
| Monthly gross income (SD) | 6.23 (3.15) |
Note. Monthly gross income was measured in $1,000 increments. BMI data were not collected for two participants. BMI = body mass index; zBMI = age- and sex-standardized body mass index.
Measures
Weight Status
zBMI has been shown to be a moderately reliable indicator of body fat percentage in children and adolescents (Mei et al., 2002) and risk for numerous health-impairing conditions (Daniels, 2009; Ingelsson et al., 2007). Because zBMI is an accurate estimate of body fat percentage in children when measuring at a single time point (Cole et al., 2005), zBMI for age and sex was used as child weight status in this study. To calculate zBMI, participant’s weight (measured to the 10th of a pound) and height (measured to the 8th of the inch) were measured by research assistants, who were trained for assessment accuracy by the principal investigator using a digital scale (Seca 869) and a portable stadiometer (Seca 217). Participants were assessed in light clothing and with no shoes. Measured height, weight, age, and sex were then used to derive zBMI using the Center for Disease Control and Prevention’s SAS Program and the 2000 CDC growth charts for children and teens (Centers for Disease Control and Prevention, 2010).
Parent–Child Communication
Forehand et al. (1997) adapted Barnes and Olson’s (1985) Communication Scale for children and their parents. The Communication Scale—Revised consists of 10 child-response questions and 10 parent-response questions, which are scored on a 4-point Likert-type scale and summed to form one composite score. The child-response questions assess the degree to which the child perceives their parent listens to them (e.g., “My parents and I can talk about almost anything”), while the parent-response questions assess the degree to which parents listen to their child (e.g., “I sometimes don’t listen to my child”). In the original validation of this measure, parent and child reports correlated significantly (r = .39, p < .01) with an alpha coefficient of .85. This scale has demonstrated construct validity in various adolescent populations (Xia et al., 2004). For the current study, the correlation between parent and child responses on this measure was r = .13, p < .05 and the internal consistency was α = .68 for parent report and α = .64 for child report.
Parent–Child Connectedness
The parent–child connectedness measure (Boutelle et al., 2009) consists of four statements rated on a 5-point Likert-type scale which assess the degree to which children feel connected to their father and mother (e.g., “How much do you feel that your mother cares about you?”; “How much do you feel you can talk to your father about your problems?”). A total score comprising the mean of the four items represents aggregate parent–child connectedness, with higher scores indicating greater connection to parents. Cronbach's α in the initial validation study was .69 and internal consistency in the present study was α = .66. Although this measure has been used in similar studies and is high in face validity, evidence for other types of validity is limited.
Child Feeding Questionnaire
The child feeding questionnaire is a well-validated measure that consists of 31 items that load onto seven factors (Birch et al., 2001; Camci et al., 2014). Only three scales from the child feeding questionnaire were used in this study (restriction, pressure to eat, and monitoring). The restriction scale measures the extent to which parents restrict their child’s access to foods (i.e., “I intentionally keep some foods out of my child’s reach”). The monitoring scale measures the extent to which parents oversee their child’s eating (i.e., “How much do you keep track of the high-fat foods that your child eats?”). The pressure to eat scale assesses the parent’s tendency to pressure their child to eat more food (i.e., “My child should always eat all the food on her plate”). Each scale is measured using a 5-point Likert-type scale with higher ratings indicating more parental use of restriction, pressure, or monitoring. Internal consistency for subscales ranged from acceptable to excellent in the validation study (restriction α = .73, monitoring α = .92, and pressure to eat α = .70) and in the current sample (restriction α = .87, monitoring α = .94, and pressure to eat α = .79).
Procedures
The Brigham Young University Institutional Review Board, School District, and principals from participating elementary school approved the study procedures. A parent or legal guardian provided consent and completed all study questionnaires through an online survey. After parents had completed the online survey, height and weight were measured and children completed questionnaires during a physical education class.
Statistical Analysis
Study variables were inspected for normality and missing values prior to analyses. Missingness was below 1.6% for all primary study variables so missingness was addressed using listwise deletion. Hierarchical regression analyses using SPSS (version 26) were used to evaluate the relationship between parent–child relationship factors, parent feeding practices, and child zBMI. All predictor variables were standardized for ease of interpretation, and alpha was set at 0.05 for all significance tests.
Each parent–child relationship variable (i.e., parent-reported communication, child-reported communication, and parent–child connectedness) was evaluated in a separate set of hierarchical analyses (see Tables II–IV). In the first step of each analyses, parent feeding variables (restriction, pressure to eat, and monitoring) were included in the model because of their well-established association with zBMI. During the second step, a single parent–child relationship factor was added to the model to assess for improvements in the prediction of zBMI (as assessed by changes in R2). Finally, at each of the subsequent three steps, an interaction term between the pertinent parent–child relationship factor and a parent feeding practice was added to assess for moderation effects and improvements in amount of variance accounted for by the model. When moderation effects were found, the interaction was further evaluated using ordinary least squares regression through the PROCESS macro (version 3.4) in SPSS (Hayes, 2013). As a part of this analysis, variables were mean-centered to reduce the adverse impact of multicollinearity and to facilitate interpretation. As a part of this approach, levels of interaction were evaluated at 1 SD above the mean, at the mean, and at 1 SD below the mean. A range of significance for the moderation effect was then calculated using the Johnson–Neyman method (Miller et al., 2013).
Hierarchical Regression Analyses Predicting Child zBMI from Parent Feeding Practices, Communication (Parent Report), and Interaction Terms
| Predictor | β | SE β |
|---|---|---|
| Step 1 | ||
| A. Restriction | 0.36*** | 0.06 |
| B. Pressure to eat | −0.15* | 0.06 |
| C. Monitoring | −0.13* | 0.07 |
| Model summary: R2 = 0.11***; ΔR2 = 0.10*** | ||
| Step 2 | ||
| A. Restriction | 0.37*** | 0.07 |
| B. Pressure to eat | −0.15* | 0.06 |
| C. Monitoring | −0.13* | 0.07 |
| D. Communication (parent report) | 0.02 | 0.06 |
| Model summary: R2 = 0.11***; ΔR2 = 0.000 | ||
| Step 3 | ||
| A. Restriction | 0.37*** | 0.06 |
| B. Pressure to eat | −0.15* | 0.06 |
| C. Monitoring | −0.13* | 0.06 |
| D. Communication (parent report) | 0.01 | 0.06 |
| A × D | −0.03 | 0.06 |
| Model summary: R2 = 0.11***; ΔR2 = 0.001 | ||
| Step 4 | ||
| A. Restriction | 0.37*** | 0.07 |
| B. Pressure to eat | −0.15* | 0.06 |
| C. Monitoring | −0.13* | 0.07 |
| D. Communication (parent report) | 0.01 | 0.06 |
| A × D | −0.03 | 0.06 |
| B × D | 0.02 | 0.06 |
| Model summary: R2 = 0.11***; ΔR2 = 0.000 | ||
| Step 5 | ||
| A. Restriction | 0.37*** | 0.07 |
| B. Pressure to eat | −0.16** | 0.06 |
| C. Monitoring | −0.14* | 0.07 |
| D. Communication (parent report) | 0.01 | 0.06 |
| A × D | −0.07 | 0.06 |
| B × D | 0.00 | 0.06 |
| C × D | 0.11 | 0.06 |
| Model summary: R2 = 0.12***; ΔR2 = 0.001 | ||
Note. zBMI = age- and sex-standardized body mass index.
p ≤ .05,
p ≤ .01,
p ≤ .001.
Hierarchical Regression Analyses Predicting Child zBMI from Parent Feeding Practices, Communication (Child Report), and Interaction Terms
| Predictor | β | SE β |
|---|---|---|
| Step 1 | ||
| A. Restriction | 0.33*** | 0.06 |
| B. Pressure to eat | −0.18** | 0.06 |
| C. Monitoring | −0.18** | 0.06 |
| Model summary: R2 = 0.10***; ΔR2 = 0.10*** | ||
| Step 2 | ||
| A. Restriction | 0.33*** | 0.06 |
| B. Pressure to eat | −0.18** | 0.06 |
| C. Monitoring | −0.19** | 0.06 |
| E. Communication (child report) | −0.12* | 0.06 |
| Model summary: R2 = 0.11***; ΔR2 = 0.014* | ||
| Step 3 | ||
| A. Restriction | 0.33*** | 0.06 |
| B. Pressure to eat | −0.18** | 0.06 |
| C. Monitoring | −0.19** | 0.06 |
| E. Communication (child report) | −0.12* | 0.06 |
| A × E | −0.01 | 0.05 |
| Model summary: R2 = 0.11***; ΔR2 = 0.000 | ||
| Step 4 | ||
| A. Restriction | 0.32*** | 0.06 |
| B. Pressure to eat | −0.18** | 0.06 |
| C. Monitoring | −0.17** | 0.06 |
| E. Communication (child report) | −0.11 | 0.06 |
| A × E | −0.06 | 0.06 |
| B × E | 0.14* | 0.06 |
| Model summary: R2 = 0.13***; ΔR2 = 0.015* | ||
| Step 5 | ||
| A. Restriction | 0.32*** | 0.06 |
| B. Pressure to eat | −0.18** | 0.06 |
| C. Monitoring | −0.17** | 0.06 |
| E. Communication (child report) | −0.11 | 0.06 |
| A × E | −0.06 | 0.06 |
| B × E | 0.14* | 0.06 |
| C × E | 0.01 | 0.06 |
| Model summary: R2 = 0.13***; ΔR2 = 0.000 | ||
Note. zBMI = age- and sex-standardized body mass index.
p ≤ .05,
p ≤ .01,
p ≤ .001.
Hierarchical Regression Analyses Predicting Child zBMI from Parent Feeding Practices, Connectedness, and Interaction Terms
| Predictor | β | SE β |
|---|---|---|
| Step 1 | ||
| A. Restriction | 0.33*** | 0.06 |
| B. Pressure to eat | −0.18** | 0.06 |
| C. Monitoring | −0.18** | 0.06 |
| Model summary: R2 = 0.10***; ΔR2 = 0.10*** | ||
| Step 2 | ||
| A. Restriction | 0.33*** | 0.06 |
| B. Pressure to eat | −0.19*** | 0.06 |
| C. Monitoring | −0.18** | 0.06 |
| F. Connectedness | −0.07 | 0.06 |
| Model summary: R2 = 0.10***; ΔR2 = 0.004 | ||
| Step 3 | ||
| A. Restriction | 0.33*** | 0.06 |
| B. Pressure to eat | −0.19** | 0.06 |
| C. Monitoring | −0.19** | 0.07 |
| F. Connectedness | −0.06 | 0.06 |
| A × F | 0.05 | 0.05 |
| Model summary: R2 = 0.11***; ΔR2 = 0.003 | ||
| Step 4 | ||
| A. Restriction | 0.32*** | 0.06 |
| B. Pressure to eat | −0.18** | 0.06 |
| C. Monitoring | −0.17* | 0.07 |
| F. Connectedness | −0.07 | 0.06 |
| A × F | 0.02 | 0.06 |
| B × F | 0.08 | 0.06 |
| Model summary: R2 = 0.12***; ΔR2 = 0.006 | ||
| Step 5 | ||
| A. Restriction | 0.34*** | 0.07 |
| B. Pressure to eat | −0.18** | 0.06 |
| C. Monitoring | −0.17** | 0.07 |
| F. Connectedness | −0.07 | 0.06 |
| A × F | 0.01 | 0.06 |
| B × F | 0.08 | 0.06 |
| C × F | 0.03 | 0.07 |
| Model summary: R2 = 0.12***; ΔR2 = 0.001 | ||
Note. zBMI = age- and sex-standardized body mass index.
p ≤ .05,
p ≤ .01,
p ≤ .001.
Results
Hierarchical Regression Analyses
Consistent with past research, all hierarchical regression models showed stable small to moderate associations between parent feeding practices (restriction, pressure to eat, and monitoring) and child zBMI. Specifically, restriction was moderately associated with zBMI (p ≤ .001), such that more restriction was related to higher child zBMI. In contrast, pressure to eat and monitoring consistently showed small negative associations with zBMI (p < .05), such that lower pressure to eat and lower monitoring were related to higher child zBMI. See Tables II–V for standardized coefficient estimates across each model.
Results From the Ordinary Least Squares Regression Analysis Predicting Child zBMI from Child-Reported Parent–Child Communication, Parent Feeding Practices, and a Communication-Pressure to Eat Interaction
| 95% confidence interval | ||||
|---|---|---|---|---|
| Predictors | β | SE β | Lower | Upper |
| A. Restriction | 0.327*** | 0.064 | 0.202 | 0.453 |
| B. Pressure to Eat | −0.179** | 0.059 | −0.294 | −0.064 |
| C. Monitoring | −0.171** | 0.064 | −0.297 | −0.045 |
| E. Communication (child report) | 0.103 | 0.057 | −0.216 | 0.009 |
| B × E interaction | 0.117* | 0.057 | 0.005 | 0.229 |
| Model summary: F5,300 = 8.68; R2 = 0.13***; R2 change = 0.012* | ||||
Note. All variables were standardized and centered prior to analysis; R2 change is based on including the interaction effect between parent–child communication and pressure to eat. zBMI = age- and sex-standardized body mass index.
p ≤ .05,
p ≤ .01,
p ≤ .001.
Results varied when adding individual parent–child relationship factors to the model. Only child-reported communication showed a significant negative association with child zBMI (β = −0.12; p = .03) with improvements in the amount of variance accounted for by the model (R2 = 0.11; ΔR2 = 0.014, p = .03). However, this association became non-significant (p = .06) with the addition of an interaction between communication (per child report) and pressure to eat, suggesting a moderation effect (β = −0.14; p = .02). Importantly, the addition of this interaction between child-reported communication and pressure to eat improved the amount of variance explained by the model (R2 = 0.13, p < .001; ΔR2 = 0.015, p = .02). In contrast, neither parent–child communication (per parent report) nor parent–child connectedness showed any association with child zBMI; nor did any associated interaction terms show an association.
Moderation Analysis
To further assess the interaction between parent–child communication (per child report) and pressure to eat, all significant predictors were evaluated in a single model (i.e., all parent feeding practices, child-reported communication, and the communication-pressure to eat interaction) while removing all non-significant interaction terms. Results from Hayes’ (2013) PROCESS output are shown in Table V. Results from this analysis again showed a small, but significant moderation effect between child-reported communication and pressure to eat on child zBMI (β = 0.12; p = .04) with improvements in the variance accounted for by the model (R2 = 0.13, p < .001; ΔR2 = 0.012, p = .04) when including this interaction term. A closer look at the results, by assessing this interaction at different levels of pressure to eat (at 1 SD below the mean, at the mean, and 1 SD above the mean) and Johnson–Neyman significance regions, showed that the interaction between child-reported communication and pressure to eat on child zBMI only remained significant at lower levels of pressure to eat (z-score ≤ −0.07). As shown in Figure 1, parent–child communication (per child report) was predictive of child zBMI only when scores on the pressure to eat scale fell below the mean in our sample. In other words, parent–child communication was related to child zBMI only under the condition of lower pressure to eat by parent. Importantly, this moderation effect increased and remained significant as pressure to eat declined below the mean (β = −0.11, −0.37).
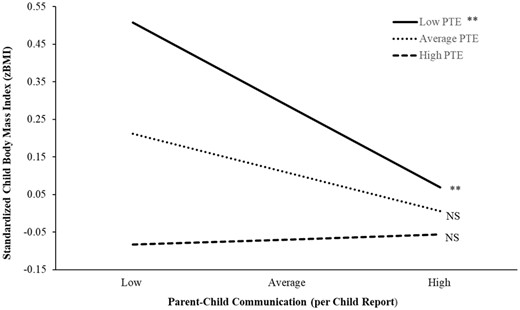
Interaction between parent–child communication and pressure to eat predicting zBMI.
Note. NS = not significant; PTE = pressure to eat; zBMI = age- and sex-standardized body mass index. Low = 1 SD below the mean, Average = mean, and High = 1 SD above the mean; All variables were standardized (z-score) and mean centered to facilitate interpretation and avoid multicollinearity; **p ≤ .01.
Discussion
This study examined direct and indirect associations between parent–child connectedness and communication, parent feeding practices, and child zBMI.
Regarding our initial hypothesis, that parent–child communication and connectedness would be inversely associated with zBMI, we found that only child-reported communication was inversely associated with zBMI. This result is consistent with previous research suggesting that child ratings of parent–child communication have been associated with eating habits and weight outcomes and the small effect sizes we noted are consistent with previous research (Ackard et al., 2006; Parletta et al., 2012). This finding provides additional evidence for the importance of parent–child communication as a predictor of child body mass in pre-adolescent children. However, it is somewhat surprising that we found no association between parent-reported communication and zBMI given that parent-reported relationship quality has often been shown to be associated with eating and weight outcomes (Ackard et al., 2006). Previous findings have indicated that parent’s perceptions of communication can influence their child feeding practices (Payne et al., 2011) and that poorer parent–child communication, as perceived by both the parent and child, predicts higher BMI when examined in populations where the majority of participants are overweight or obese (Parletta et al., 2012). Because our study was conducted with a community sample with a wide range of zBMI, it is possible that our null finding in this regard is attributable to study sample differences.
Relatedly, our hypothesis that parent–child connectedness would be associated with zBMI was not supported. It is possible that study sample differences influenced our null findings regarding associations between parent–child connectedness and child weight. Our sample was younger than Ackard et al.’s (2006), who found an association between lower parent–child connectedness and higher risk of unhealthy weight control strategies. It is also possible that this association may be more salient in adolescents, who are in greater control of their own eating and weight outcomes relative to pre-adolescents who are still under their parents influence for most of their eating (Miller et al., 2012).
When examining the influence of feeding practices on zBMI, our findings were mixed restriction demonstrated a positive, moderately sized association with zBMI. Food restriction has been well-documented as a maladaptive feeding practice because children whose food access is restricted tend to demonstrate dysregulation toward foods when they do have access (Birch et al., 2003; Farrow et al., 2015; Ogden et al., 2013), which in turn contributes to higher child weight. However, it is important to note that some research has shown that parents may alter their feeding strategies based on their perceptions of their child’s weight (Payne et al., 2011), and thus may use higher levels of restriction if they perceive their child as overweight. Conversely, parental pressure to eat and food monitoring were negatively associated with child zBMI, although these effects were relatively small. These findings suggest that, at lower levels of parental pressure to eat and monitoring, children are more likely to have higher zBMI. Both findings are somewhat counterintuitive and contradict other studies that show no relationship or a small positive association with higher zBMI. However, this finding is consistent with previous research by Brown and Perrin (2020), who found an inverse association between parental pressure to eat and child weight. One potential explanation for these equivocal findings is that both high and low pressure to eat and monitoring may be maladaptive. Steele, Jensen, Gayes, & Liebold's (2014) research found that moderate use of restriction, pressure, and monitoring were associated with superior outcomes in a weight loss trial, suggesting that there is likely a healthy middle ground for use of these strategies.
Taken together, our findings are congruent with previous research indicating an association between parental feeding practices and child weight outcomes and the magnitude of our small to moderate effects was commensurate with previous research on this topic, although the direction of main effects in our study differed from the majority of previous research for both pressure to eat and monitoring (Faith et al., 2004). In addition, our findings suggest that parental feeding practices are an important contributor to child weight in pre-adolescents, who are more directly under the influence of their parents than adolescents but are developing greater eating autonomy relative to children. One possible explanation for mixed findings regarding the effects of parent feeding on child weight is the developmental stage, especially given that studies in young children found feeding practices to be associated with maternal concern about child weight but not child body mass (Gregory et al., 2010).
Analysis of our second hypothesis, examining whether parental feeding practices moderated the association between parent–child connectedness, yielded no significant findings. This is unsurprising given the lack of direct association between parent–child connectedness and child weight. However, this null finding diverges from previous studies indicating that the parent–child relationship as an important predictor of child eating and weight in younger children (Ackard et al., 2006; Goossens et al., 2012). It is possible that this association differs by age, but it also could be a byproduct of our sample and as such should continue to be examined.
Finally, examining our third hypothesis revealed that child-reported parent–child communication was inversely associated with child zBMI only when parental pressure to eat was low. This result implies that only when parents minimize the pressure they exert on their child to eat (e.g., “clean your plate,” encouraging eating beyond satiety) does communication emerge as a predictor of child zBMI. This finding may imply that high parental pressure to eat negates the beneficial effects of positive communication on child eating behaviors and weight. Conversely, our findings may suggest that children who perceive lower parent–child communication who also have parents who minimally pressure them to eat healthy foods are more likely to have a higher zBMI. It is also possible that parents who communicate with their children effectively feel less need to control their child’s eating through pressure to eat and this, in turn, contributes to healthier zBMI. Improving parent–child communication, with particular focus on the child’s perspective, may be helpful in indirectly promoting weight-related health. Several child obesity interventions designed to strengthen parenting skills have been developed and these programs provide helpful models for how general- and feeding-specific parent–child communication could be addressed in family-oriented interventions (Boutelle et al., 2017; Ek et al., 2019). Specifically, our findings may be helpful in improving the efficacy of multi-dimensional intervention approaches, which include family teamwork and collaboration as central intervention components (Coppock et al., 2014). Our findings provide helpful insights for clinicians and families working to manage child weight. Specifically, encouraging positive communication, with emphasis on parent–child communication quality, as well as encouraging parents to reduce use of maladaptive feeding strategies may improve treatment outcomes (Henry et al., 2018). Our finding that too little pressure from parents to eat healthy foods is not optimal for youth is also consistent with the American Heart Association guidelines that suggest families engage in feedings practices that increase consumption of healthy foods (Gidding et al., 2006). Furthermore, our findings may be especially helpful in designing treatments for pre-adolescents given that parent–child communication is rapidly changing in this important developmental stage.
Several study limitations deserve discussion. Although the internal consistency reliability for the parent–child connectedness and communication measures were considered “acceptable” (Spector, 1992), these reliability estimates (particularly for the communication scale) underperformed estimates obtained from the study developers and validation studies have not been conducted with these measures. Inconsistencies in coefficient alphas may exist because our study sample was younger than the validation samples. Other well-validated measures of the parent–child relationship variables we aimed to measure have not been developed, precluding selection of measures with better psychometric properties. It is possible that these findings may differ by ethnicity, age, or weight classification (i.e., underweight, overweight), but our study was unable to detect such effects due to its fairly homogenous ethnic sample (predominantly Caucasian = 81.65%), restricted age range, and predominantly healthy BMI. Results were derived from a sample of convenience in which both parents and children self-selected whether to participate or not. Because children and parents were informed that an aerobic fitness test was included in the study procedure, children with overweigh/obesity or their parents may have been less likely to agree to participate in the study. This may be the reason for the lower number of children number of children with overweight/obesity in our study (16.9%) compared to national averages (33.6%; Ogden et al., 2016). Finally, our cross-sectional study design does not allow for causal or directional inference and other parent variables may influence parent feeding behaviors and child weight (e.g., parent’s perceptions of their child’s weight; Ek et al., 2016; Gregory et al., 2010).
In conclusion, this study provides evidence that parent–child communication (assessed via child-report) is inversely associated with child zBMI and that this association is moderated by parent pressure to eat such that the association between communication and zBMI is only significant for children whose parents who engage in lower pressure to eat. These findings imply that improving parent–child communication may have salutary effects on child BMI and that intervening to lower parental pressure on their child to eat may be important in maximizing the benefit of improved parent–child communication. Overall, our findings are consistent with previous literature suggesting that feeding practices (i.e., restriction, monitoring) are associated with weight outcomes, and thus an important area for continued study and intervention. Furthermore, our study extends this area of research to pre-adolescent children, a relatively understudied developmental group in the existing literature.
Conflicts of interest: None declared.
References
Centers for Disease Control and Prevention (
Holmbeck, G. N. (2016). Transformations during the transition to adolescence: parent–adolescent conflict and adaptation. In Graber, J. A., Brooks-Gunn, J., & Petersen, A. C. (Eds.) Transitions through adolescence: interpersonal domains and context (pp. 167-199). Routledge.
Xia, Y. R., Xie, X., Zhou, Z., Defrain, J., Defrain, J., & Combs, R. (2004). Chinese adolescents' decision-making, parent-adolescent communication and relationships. Marriage & Family Review, 36(1-2), 119-145.
