


Abstract
Objective To examine the trajectories of caregiver psychological responses in the year following their child’s hematopoetic stem cell transplant (HSCT), and whether cognitive and social processing strategies differentiated between trajectories. Method One hundred and eight caregivers randomized to the control condition of a cognitive-behavioral intervention study completed measures of distress, coping, and social support at baseline, 1 month, 6 months, and 1 year post HSCT of their child. Results The majority reported moderate or low anxiety, depression, or distress that decreased over time, but a small group demonstrated high anxiety, depression, or distress that persisted or increased over time. Maladaptive coping was highest among caregivers in the high-persistent distress subgroup compared with the moderate-decreasing and low-stable groups. Adaptive coping was minimally associated with trajectory subgroups. Conclusions Screening HSCT caregivers for distress and maladaptive coping may be useful in identifying caregivers likely to experience persistently high distress who may benefit from psychological intervention.
Parents providing care to children undergoing hematopoetic stem cell transplant (HSCT) experience extreme stress. In addition to the emotional toll of having one's child diagnosed with a potentially life-threatening disease, watching one’s child endure the grueling HSCT process is in itself stressful (Heinze et al., 2015). Pediatric HSCT is associated with short-term side effects such as mouth sores and infection, as well as long-term risks including failed engraftment, graft-versus-host disease (GvHD), systemic infection, and cardiopulmonary, endocrine, and neurological issues (Bresters et al., 2009; Han et al., 2009). Over the course of the next several decades of the child’s life, even children who have a successful HSCT remain at increased risk for disease recurrence, second cancers, and/or mortality (Mehta et al., 2015). Each of these issues place parent caregivers at significant risk for psychological distress. Distress is particularly high during the pretransplant and acute hospitalization phases. Studies have shown elevated levels of psychological distress among 47% of fathers and 60% of mothers during preadmission (Dermatis & Lesko, 1990; Streisand, Rodrigue, Houck, Graham-Pole, & Berlant, 2000). At the time of HSCT, prior work found that 22% of mothers met criteria for major depressive, generalized anxiety, and/or panic disorder (Manne et al, 2002; Virtue et al., 2014), and an additional 16% to 21% reported clinically significant anxiety and depression (Manne et al., 2004; Virtue et al., 2014). It is important to note that these levels of emotional distress are elevated compared with the incidence level reported in the general population, where the depression prevalence is 6.7% among U.S. adults (Pratt & Brody, 2008), while the prevalence rate of anxiety among U.S. adults is >10% annually (Kessler et al., 2009).
Longitudinal research suggests that distress declines steadily post-HSCT for the majority of parents (Manne et al., 2004; Phipps, Long, Hudson, & Rai, 2005; Streisand et al., 2000), but remains elevated for a subset of parent caregivers up until 18 months after HSCT (Manne et al., 1996; Sloper, 2000). Few studies have characterized the patterns of distress among parent caregivers over time. The most common approach to examining change over time is to summarize averages at serial time points using repeated measures designs (Phipps et al., 2012) or use average growth curves and individual variations around the mean scores. However, analyses that assume that caregivers' responses are homogenous over time can be misleading when the population contains distinct subgroups, as this sample may. Trajectory analysis, or group-based trajectory modeling, simultaneously estimates patterns over time and identifies unobserved subpopulations. These analyses can also examine trajectory shapes (nonlinear changes) and can elucidate a number of subgroups. Although group-based trajectory modeling is increasing in its usage, to our knowledge it has not been used to characterize distress among caregivers of children undergoing HSCT. Toward this end, the primary goal of this study was to determine whether there are distinct patterns of parent caregiver distress over the year after HSCT. We proposed that the majority of parent caregivers would exhibit a pattern of high anxiety, depression, and traumatic distress that declined steadily over the 1 year post-HSCT period and that most caregivers’ well-being would increase over that time. However, we proposed that there would also be a group of parent caregivers who would exhibit persistently high distress and low well-being over the 1 year post-HSCT period and a group of parents who would have low, stable levels of distress.
The second goal was to evaluate the demographic, medical, and psychological factors that may be associated with distress trajectories subgroups. The guiding framework was cognitive-social processing theory of adjustment to traumatic events (Creamer, Burgess, & Pattison, 1992; Tait & Silver, 1989), which has been supported in this population. This theory posits that traumatic experiences cause people to question core beliefs about themselves, their relationships, and their world (Janoff-Bulman, 1992). Cognitive-processing, which involves confronting, contemplating, and reevaluating the traumatic event and its meaning, may help people integrate the meaning of the traumatic event into their mental model and reduce distress (Lepore, 2001; McCann & Pearlman, 1990). In the context of HSCT, cognitive processing involves approaching one’s fears, finding meaning in the child’s HSCT, or integrating the threatening aspects of the HSCT into a coherent conceptual framework. Social processing, which involves talking with supportive family or friends (Lepore, 2001), facilitates cognitive processing (Albrecht, Burleson, & Goldsmith, 1994; Rime, 1995), and experiencing unsupportive responses from family and friends hinders adaptive cognitive processing (Manne & Glassman, 2000; Tait & Silver, 1989).
Research has provided evidence for the role of cognitive and social processing for caregivers of children undergoing HSCT. With regard to cognitive processing, fewer bone marrow transplant (BMT)-related fears (Manne et al., 2002, 2003) and greater use of cognitive reappraisal such as acceptance, positive reappraisal, and humor is associated with decreases in depressive symptoms post-HSCT (Manne et al., 2003; Nelson, Miles, & Belyea, 1997). Emotional disengagement coping such as self-blame and avoidance is associated with higher distress post-HSCT (DuHamel et al., 2004; Kronenberger et al., 1998), whereas use of active engagement through problem-solving is associated with lower distress (Nelson & Gleaves, 2003). In terms of social processing, sharing feelings with supportive family and friends (Manne et al., 2003), receiving social support (Manne et al., 2003; Phipps et al., 2005), and lower levels of unsupportive responses (Manne et al., 2002; Phipps et al., 2005) are associated with less caregiver distress post-HSCT. Thus, we expected that self-blame, holding back, worry frequency, and unsupportive responses would be associated with higher anxiety, depression, and distress, but humor, distraction, positive reappraisal, acceptance, problem solving, and enacted support would be associated with lower anxiety, depression, and distress. In terms of demographic and medical factors, we proposed that younger caregivers (Manne et al., 2004) and caregivers whose children have more medical complications (Terrin et al., 2013) and caregivers whose children do not survive would be more likely to be in the persistently elevated distress trajectory subgroup.
The current study was an analysis of participants from the usual care condition, called Best-Practice Psychosocial Care (BPC), of a randomized clinical trial evaluating the efficacy of a brief cognitive-behavioral intervention, called the parent social-cognitive intervention program (P-SCIP; Manne et al., 2016). P-SCIP was delivered to parent caregivers during HSCT. P-SCIP reduced caregiver’s distress significantly more than BPC between the pretransplant assessment and the 1 month follow-up assessment. However, at the 1-year follow-up, significant differences between P-SCIP and BPC were only seen among caregivers who reported higher anxiety pretransplant and whose children had GvHD at the HSCT discharge. Because P-SCIP did not show long-term effects for the majority of the sample, the current study represents an opportunity to understand patterns of change in distress over time as well as predictors of these changes.
Methods
Participants
The sample consisted of the participants in the control condition of a randomized clinical trial evaluating a cognitive-behavioral intervention for primary caregivers of children undergoing HSCT (Manne et al., 2016). Parents were randomized to the one of two study conditions after informed consent and baseline assessment were completed. Details about the larger randomized clinical trial are contained in the parent intervention publication (Manne et al., 2016).
The control condition was labeled “Best-Practice Psychosocial Care” (BPC). BPC was administered in a brief meeting held immediately after the HSCT infusion day in in the inpatient unit. BPC was delivered by the study research assistant and consisted of: (1) a DVD developed by the National Marrow Donor Program (NMDP) titled, “Discovery to Recovery: A Child's Guide to Bone Marrow Transplant,” which is a 62-min video that covers medical information about the HSCT procedure, common emotional reactions children have during the HSCT, advice from parents about coping with the hospitalization, and family testimonials about psychological reactions during the HSCT; (2) a pamphlet covering caregiver issues during HSCT created by the National Bone Marrow Transplant Link titled, “Top Tips for Parent Caregivers during the BMT Process,” which was eight pages in length; (3) the offer of 5 hr of respite care (e.g., watching the child while the caregiver left the room); and (4) the provision of a walkie-talkie to communicate with the child while not in the room.
P-SCIP was an individually delivered intervention that consisted of five 60-min sessions where stress management, coping, and support skills were taught over a span of 2–3 weeks after HSCT. Participants also received an interactive CD-ROM that reviewed these skills.
Participants were recruited from four HSCT centers across the United States. Participating centers offered similar treatment regimen, participate in the American Society of Blood and Bone Marrow Transplantation, and collaborate with the NMDP. Participating centers also offer similar psychosocial care. Eligible participants were primary caregivers (biological or foster parents) of children <19 years of age who were scheduled for HSCT within the next month. When both parents provided primary care, they decided which one would participate. Additional eligibility criteria were: (a) child could not have a diagnosis of medulloblastoma or other cancer of the brain; (b) caregiver must have phone service; and (c) caregiver had to speak, read, and write in English or Spanish (two of the four HSCT centers were equipped to enroll Spanish-speakers). All scales that did not have a valid Spanish version were translated and back-translated by an agency specializing in translation. Parents of children who had undergone one or more prior HSCTs were eligible for the study.
Procedure
Eligible caregivers were identified by the transplant teams and were approached in the week before the child’s scheduled transplant. After the study was described, interested caregivers signed the site-specific institutional review board-approved consent and survey. Caregivers completed four assessments: one at baseline (before randomization for the larger study) and three follow-ups at 1, 6, and 12 months postbaseline. Baseline surveys were completed in hospital and follow-ups completed at home. Caregivers were paid $25 each for the first two assessments and $50 each for the third and fourth assessments. Recruitment began in October 2008 and ended in December 2013. Of the 381 caregivers approached, 218 consented and completed the Time 1 survey (57.2%), 151 caregivers refused (39.6%), and 12 caregivers consented but dropped out after consenting and did not complete the Time 1 survey (3.1%). The most common reasons participants refused were “study would take too much time” (20%), “not interested” (23%) and “too overwhelmed/stressed” (20%). Of the 13 caregivers who dropped after consenting, the reasons were: caregiver was too tired (n = 5), the caregiver did not have time (n = 1), the HSCT occurred before the Time 1 survey was completed (n = 3), the HSCT was canceled (n = 1), the survey was upsetting (n = 2), and the caregiver was not proficient in English (n = 1). Comparisons between study participants and refusers with available data indicated that there were no significant differences with regard to caregiver or child demographics. The acceptance rate was lower at one site (Memorial Sloan Kettering Cancer Center (MSKCC); 50%) versus the other sites (62–68%) (Chi-square = 8.5, p < .05).
Of the 218 participants, 108 were randomly assigned to the BPC arm. Of these, 99 (91.6%) completed the 1-month follow-up, 78 (72.2%) completed the 6-month follow-up, and 72 (66.7%) completed the 1-year follow-up. It is important to note that by the 1-year follow-up assessment, 25 participants’ children of BPC participants (23.1%) had passed away and were no longer included in the study. Excluding drop out owing to the child’s death, completion rates were 98% at the 1-month, 88.4% at the 6-month, and 88.9% at the 1-year follow-up.
Outcome Measures (All Time Points)
Depressive Symptoms. The Beck Depression Inventory (BDI; Beck, Steer, & Brown, 1996) was used. The BDI contains 21 items rated on a 4-point Likert scale (0–3). Cronbach’s alphas ranged from .89 to .94 across the time points.
Anxiety. The Beck Anxiety Inventory (BAI; Beck, Epstein, Brown, & Steer, 1988) was used. The BAI contains 21 items rated on a 4-point Likert scale (0 = not at all, 4 = severely, I could barely stand it). Cronbach’s alphas ranged from .82 to .94 across the time points.
Traumatic Distress. The Impact of Events Scale-Revised (IES-R; Weiss & Marmar, 1997) was used. The IES-R is a 22-item self-report measure that assesses subjective distress caused by traumatic events. Caregivers were asked to rate symptoms associated with the child’s transplant on a 5-point Likert scale (0 = Not at all, 5 = often). Cronbach’s alphas ranged from .91 to .94 across the time points.
Positive Well-Being. The positive well-being scale from the Mental Health Inventory was used (Veit & Ware, 1983). This 14-item scale assessed satisfaction with life and positive affect. Items were rated on a 6-point Likert scale (1 = none of the time, 6 = all of the time). Cronbach’s alphas ranged from .90 to .94 across the time points.
Demographic, Medical, and Psychosocial Variables
Demographic and Medical Variables
Caregivers reported ethnicity, relationship to child, marital status, education level, and age. Child variables included child age, child sex, time since diagnosis. The medical risk factors were selected by the transplant physicians involved in this study to reflect the key risk factors for an unsuccessful medical outcome. These included time since diagnosis, whether the child was diagnosed with GvHD by the hospital discharge, whether the child remained hospitalized at Time 2, GvHD status, and whether the child died over the course of the study. At baseline, parents completed a measure of psychiatric history (ever seen a mental health professional for emotional issues, participated in substance treatment, hospitalized for psychiatric care, psychotropic medication) and psychosocial care in the past month (psychologist, psychiatrist, social worker, group therapy, psychotropic medication). Two dichotomous variables were created for the analyses (yes/no).
Initial Adaptive and Maladaptive Coping Strategies (Baseline Only)
Coping
Five adaptive coping subscales of the Brief COPE (Carver, 1997) were used: Adaptive coping includes humor, distraction, positive reappraisal/growth, acceptance, and problem solving. The maladaptive coping scale of self-blame was included. Each scale consisted of two items, and caregivers were asked to rate the extent to which they used each coping strategy in dealing with the child’s HSCT on a 4-point Likert scale. Cronbach’s alphas ranged from .62 (distraction) to .73 (humor).
Fear Appraisals
Two components of fear appraisals were included (DuHamel et al., 2004). First, one item assessed caregivers’ perception of their own potential for future suffering (“How scared are you that you’ll never be able to put the transplant experience behind you?”) rated on a scale from 0 to 8. Second, caregivers listed the number of worries for the child’s future in six life domains (e.g., social life) and then rated the frequency of the caregiver’s worry on a scale from 1 to 7. Cronbach’s alpha for the worry frequency scale was .90.
Perceived Unsupportive Behavior of Family and Friends
The family and friends version of the Perceived Negative Behaviors Scale (Manne & Glassman, 2000; Norton et al., 2005) was adapted for the HSCT context to assess unsupportive behaviors of family and friends. Items (e.g., “Criticized the way you handle your child’s transplant and/or treatment”) were rated on a 4-point scale (1 = never responded this way to 4 = often responded this way). Scores ranged from 19 to 76, with higher scores indicating more unsupportive behavior. Cronbach’s alpha was .89.
Holding Back Sharing With Family and Friends
Holding back was assessed using a previously developed measure (Porter et al., 2005) that we adapted for this study. The measure consisted of nine areas of concern related to the child’s transplant (e.g., child’s physical symptoms). Caregivers rated the degree to which they hold back from sharing concern in each domain on a 6-point scale (0 = not at all to 5 = a lot). Scores ranged from 0 to 45, with higher scores indicating greater holding back from family and friends. Cronbach’s alpha was .91.
Family/Friend Support
Using an adapted version of the Cancer Support Inventory (Manne & Schnoll, 2001), caregivers rated the degree to which family and friends responded in supportive ways in the past week on a 4-point scale (1 = never to 4 = often). Scores ranged from 13 to 52, with higher scores indicating more support. Cronbach’s alpha was .92.
Analytic Approach
Analyses were conducted using a group-based trajectory modeling approach, which is a specialized application of finite mixture modeling. The PROC TRAJ (name of statistical procedure on the statistical package) procedure in SAS Version 9.4 was used for the primary analyses (Jones, Nagin, & Roeder, 2001). In a nontechnical sense, this approach is a combination of multilevel growth modeling and cluster analysis in that it is designed to identify subgroups of individuals who show similar trajectories on an outcome over time. Time was coded such that a 1 unit change corresponded to a 1 month increase, and took on values of 0, 1, 6, and 12 for the four waves of data collection. Thus the intercept refers to the initial assessment. Models were developed by sequentially testing 1, 2, 3, and 4 group models, allowing for both linear and quadratic fixed effects for time. A common random intercept variance was specified across the groups, and the Bayesian information criterion (BIC) and an evaluation of the parameter estimates as suggested by Ram and Grimm (2009) were used for model selection. Nonsignificant terms were dropped from the model and maximum likelihood was used as the estimation method. The PROC TRAJ procedure generates subgroup membership classification for each participant in the study, and we used that information to examine the extent to which there were differences between the groups. Because 24 of the 108 children died during the study, we reran the trajectory models to evaluate whether the subgroups differed if caregivers of children who died were eliminated from the analysis. No major differences emerged (i.e., similar estimates, same statistically significant effects, similar membership in subgroups). Therefore, we present the results based on the full data set.
We used SPSS Version 22 to evaluate group differences on a variety of variables including demographics (caregiver race—non-Hispanic White/other race, married/not married, after high school/before high school, caregiver age, child age, child sex), medical risk variables (whether the child remained hospitalized at Time 2, whether the child died, GvHD status, and time since diagnosis), psychiatric care variables (dichotomous variable for prior and current care), study site, and Time 1 coping, fear appraisals, and perceived support. For the categorical variables we tested trajectory subgroup differences using Fisher Exact tests to correct for the relatively small sample size, which resulted in some cells with expected cell frequencies lower than 5. Between-subjects analysis of variance (ANOVA) were used to test for subgroup differences on the continuous variables, and significant ANOVAs were followed up using post hoc Fisher’s least significant difference (LSD) tests to correct for family-wise error.
Results
Descriptive Information
The majority of caregivers were the mother (88.9%), married (68.8%), had completed at least some college (75.9%), with the racial breakdown composed of 49% White, non-Hispanic, 24% African American, 15% Hispanic/Latino and 12% other. The mean caregiver age was 38 years. Approximately half the children undergoing HSCT were male (56.5%) and the average child age was about 8 years. For most children, this was the first HSCT, and the most common HSCT type was allogeneic (68.5%). Detailed information is presented in Table I.
Demographic, Medical, and Psychosocial Data for Study Participants (N = 108)
| Variable | |||
|---|---|---|---|
| Quantitative variables | M | SD | Range |
| Caregiver age | 37.8 | 8.5 | 18–62 |
| Child age | 8.1 | 5.3 | <1–19 |
| Qualitative variables | N | % | |
| Household income | |||
| 0–$19,999 | 17 | 15.9 | |
| $20,000–$49,000 | 41 | 19.7 | |
| $50,000–$79,000 | 14 | 13.0 | |
| Above $80,000 | 35 | 32.4 | |
| Missing | 1 | .9 | |
| Relationship to patient | |||
| Mother | 96 | 88.9 | |
| Father | 7 | 6.5 | |
| Other | 5 | 4.6 | |
| Caregiver race | |||
| Non-Hispanic White | 50 | 45.5 | |
| Non-Hispanic Black | 31 | 28.2 | |
| Hispanic/Latino | 24 | 21.8 | |
| Other | 5 | 4.5 | |
| Caregiver education level | |||
| <High School | 8 | 7.4 | |
| High school graduate/GED | 18 | 16.7 | |
| Greater than High School | 82 | 75.9 | |
| Caregiver marital status | |||
| Married | 74 | 68.5 | |
| Never married | 19 | 17.6 | |
| Widowed/divorced/separated | 15 | 13.8 | |
| Child gender | |||
| Male | 61 | 56.5 | |
| Female | 47 | 43.5 | |
| Child-type of SCT | |||
| Autologous | 21 | 19.4 | |
| Allogeneic-sibling donor | 34 | 31.5 | |
| Allogeneic-other donor | 53 | 49.1 | |
| Child-Diagnosis Group | |||
| Acute lymphoblastic leukemia | 22 | 20.4 | |
| Acute myelogenous leukemia | 26 | 24.1 | |
| Hodgkin’s disease/non-Hodgkin’s lymphoma | 5 | 4.6 | |
| Solid tumor | 17 | 15.7 | |
| Non-malignancy | 38 | 35.2 | |
| Child-graft vs. host disease at discharge (yes) | 17 | 17.3 | |
| Child-number of relapses | |||
| 0 | 71 | 65.7 | |
| 1 | 19 | 17.6 | |
| 2 | 4 | 3.7 | |
| Prior psychiatric care (yes) | 55 | 50.9 | |
| Current psychiatric care (yes) | 46 | 42.6 | |
Trajectory Analysis Results
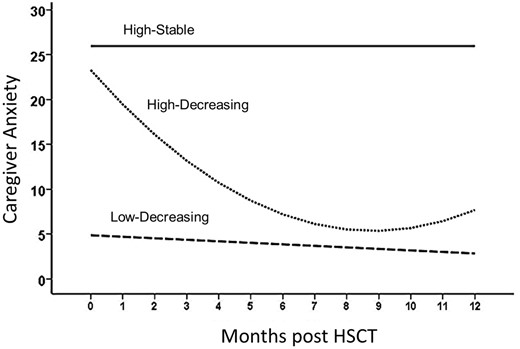
Trajectories of caregiver anxiety after child has HSCT. Coefficients for the trajectory equations as a function of time are in Table II.
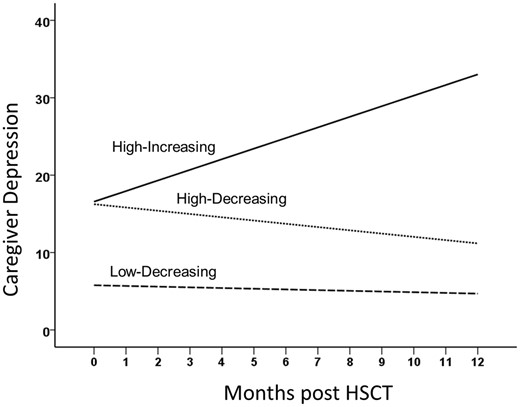
Trajectories of caregiver depression after child has HSCT. Coefficients for the trajectory equations as a function of time are in Table II.
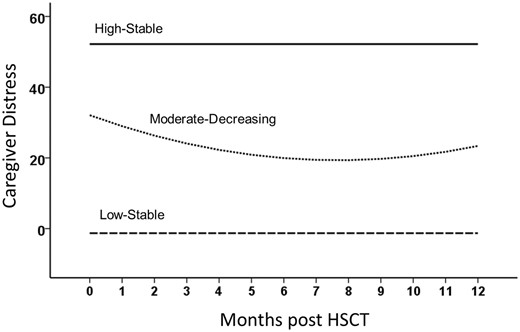
Trajectories of caregiver distress after child has HSCT. Coefficients for the trajectory equations as a function of time are in Table II.
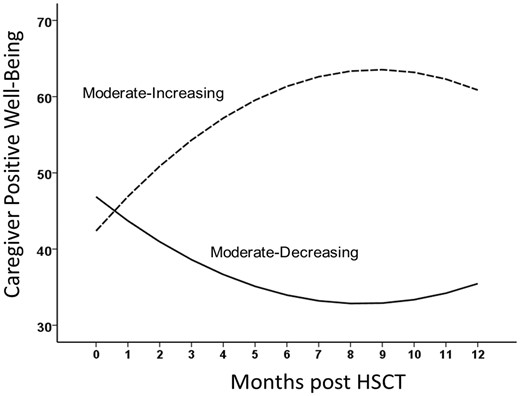
Trajectories of caregiver positive well-being after child has HSCT. Coefficients for the trajectory equations as a function of time are in Table II.
Regression Equations for the Trajectories of Anxiety, Depression, Distress, and Positive Well-Being Over Time
| Variable | Subgroup | Intercept | Linear slope | Quadratic slope | % of sample | |||
|---|---|---|---|---|---|---|---|---|
| B | t | B | T | b | t | |||
| Anxiety | (1) Low-decreasing | 4.87 | 6.91** | −0.17 | 2.16* | 0a | – | 75.57 |
| (2) High-decreasing | 23.29 | 13.69** | −4.06 | 6.25** | 0.23 | 4.39** | 17.1 | |
| (3) High-stable | 25.96 | 11.48** | 0a | – | 0a | – | 7.3 | |
| Depression | (1) Low-decreasing | 5.77 | 7.00** | −0.31 | 3.03** | 0a | – | 60.5 |
| (2) High-decreasing | 16.25 | 9.84** | −0.42 | 2.24* | 0a | – | 31.2 | |
| (3) High-increasing | 16.58 | 9.04** | 1.34 | 5.66* | 0a | – | 8.3 | |
| Distress | (1) Low-stable | −1.28 | 0.23 | 0a | – | 0a | – | 19.2 |
| (2) Moderate-decreasing | 32.07 | 10.51** | −3.32 | 3.08** | 0.22 | 2.52* | 65.9 | |
| (3) High-stable | 52.19 | 8.87** | 0a | – | 0a | – | 14.9 | |
| Positive Well-being | (1) Moderate-increasing | 42.39 | 33.13** | 4.78 | 5.82** | −0.27 | 4.20** | 65.7 |
| (2) Moderate-decreasing | 46.86 | 25.68** | −3.35 | 3.10** | 0.20 | 2.29* | 34.3 | |
p < .05, **p < .01.
aIndicates that this parameter was fixed to zero because it was not statistically significant and nested model testing indicated that dropping it did not worsen model fit.
For depression, the three subgroups each had significant linear effects (see Figure 2). The first subgroup (Low-decreasing), comprising 60.5% of the sample, started the study relatively low in depression and decreased in depression over time. The second subgroup (High-decreasing), comprising 31.2% of the sample, started relatively high in depression but decreased over time. The third subgroup (High-increasing), comprising 8.3% of the sample, started high in depression, but depression increased significantly over time. For traumatic distress the three subgroups were distinct across time (see Figure 3). The first subgroup (19.2%; Low-stable) started and stayed low in traumatic distress. The second subgroup (65.9%) started at moderate distress, had linear decreases in distress (i.e., Moderate-decreasing), but the quadratic component suggests that the linear decrease moderated over time. The final group (14.9%; High-stable) started and stayed relatively high in distress. Finally, analyses of positive well-being resulted in two subgroups (see Figure 4): 66% began with moderate well-being and then increased significantly over time, and 34% began with similarly moderate well-being but decreased significantly over time.
Demographic, Medical, and Psychiatric Care Variables Related to Trajectory Subgroup Membership
As noted, we examined whether the trajectory subgroups differed on a number of caregiver and child demographic, medical, and psychiatric care variables (see Table III). Positive well-being subgroup membership was not associated with any of these variables, and there were no differences in anxiety, depression, or distress subgroups for caregiver ethnicity, age, psychiatric history, psychosocial care, child age, or time since diagnosis.
Demographic and Medical Variables Associated With Anxiety, Depression, Distress, and Positive Well-Being Trajectory Subgroups
| Variable | Subgroup | Caregiver mother | Caregiver married | Caregiver post High-School Education | Child gender | GvHD | Child died | |||||||
|---|---|---|---|---|---|---|---|---|---|---|---|---|---|---|
| No | Yes | No | Yes | No | Yes | Female | Male | No | Yes | No | Yes | |||
| Anxiety | (1) Low-decreasing | N | 8 | 73 | 25 | 56 | 20 | 47 | 28 | 53 | 61 | 11 | 60 | 20 |
| (%) | (67) | (76) | (73) | (76) | (59) | (83) | (60) | (87) | (75) | (65) | (72) | (83) | ||
| (2) High-decreasing | N | 1 | 19 | 4 | 16 | 12 | 8 | 14 | 6 | 17 | 2 | 16 | 4 | |
| (%) | (8) | (20) | (12) | (22) | (35) | (14) | (30) | (10) | (21) | (12) | (19) | (17) | ||
| (3) High-stable | N | 3 | 4 | 5 | 2 | 2 | 2 | 5 | 2 | 3 | 4 | 7 | 0 | |
| (%) | (25) | (4) | (15) | (3) | (6) | (3) | (11) | (3) | (4) | (24) | (8) | (0) | ||
| Fisher’s exact test | 5.94* | 5.81* | 6.26* | 10.34** | 6.69* | 1.87 | ||||||||
| Depression | (1) Low-decreasing | N | 8 | 58 | 22 | 44 | 17 | 37 | 29 | 37 | 54 | 5 | 48 | 17 |
| (%) | (67) | (60) | (65) | (59) | (50) | (65) | (62) | (61) | (67) | (29) | (58) | (71) | ||
| (2) High-decreasing | N | 3 | 32 | 7 | 28 | 17 | 16 | 14 | 21 | 23 | 9 | 28 | 7 | |
| (%) | (25) | (33) | (21) | (38) | (50) | (28) | (30) | (34) | (28) | (53) | (34) | (29) | ||
| (3) High-increasing | N | 1 | 6 | 5 | 2 | 0 | 4 | 4 | 3 | 4 | 3 | 7 | 0 | |
| (%) | (8) | (6) | (15) | (3) | (0) | (7) | (8) | (5) | (5) | (18) | (8) | (0) | ||
| Fisher’s exact test | 0.67 | 6.92* | 5.52 | 0.77 | 8.98** | 2.10 | ||||||||
| Distress | (1) Low-stable | N | 1 | 18 | 10 | 9 | 7 | 9 | 8 | 11 | 13 | 2 | 10 | 9 |
| (%) | (8) | (19) | (29) | (12) | (21) | (16) | (17) | (18) | (16) | (12) | (12) | (38) | ||
| (2) Moderate decreasing | N | 9 | 68 | 19 | 58 | 23 | 42 | 34 | 43 | 60 | 11 | 61 | 15 | |
| (%) | (75) | (71) | (56) | (78) | (68) | (74) | (72) | (70) | (74) | (65) | (74) | (62) | ||
| (3) High-stable | N | 2 | 10 | 5 | 7 | 4 | 6 | 5 | 7 (12) | 8 | 4 | 12 | 0 | |
| (%) | (16) | (10) | (15) | (10) | (12) | (10) | (11) | (10) | (24) | (14) | (0) | |||
| Fisher’s exact test | 1.11 | 6.10* | 0.55 | 0.10 | 2.41 | 9.92** | ||||||||
Note. GvHD = graft versus host disease.
p < .05, **p < .01. Fisher Exact tests have df = 2.
Anxiety
Fisher’s exact tests indicated that nonmaternal caregivers (fathers, grandparents, foster parents) were relatively more likely to fall into the high-stable anxiety subgroup than maternal caregivers, and maternal caregivers were more likely to be in either the low-decreasing or high-decreasing subgroups. A similar pattern emerged for caregiver marital status such that unmarried caregivers were more likely to be in the high-stable anxiety subgroup. The caregiver’s education was also associated with anxiety subgroups such that caregivers with after high-school education were most likely to be in the low-decreasing group, but caregivers with a high-school degree or lower education were more likely to be in the high-decreasing or high-stable groups. Child gender and GvHD status were also associated with anxiety subgroups. Caregivers of boys were most likely to fall into the low-decreasing subgroup, but caregivers of girls were somewhat more likely to fall into the high-decreasing subgroup. Caregivers of children with GvHD were more likely to show the high-stable anxiety trajectory than caregivers of children who did not have GvHD.
Depression
Caregiver depression trajectory subgroups were associated with caregiver marital status and child’s GvHD status. Specifically, unmarried caregivers were more likely to show high-increasing depression compared with married caregivers, and married caregivers were more likely to show high-decreasing depression compared with unmarried caregivers. In terms of GvHD status, caregivers of children who had GvHD were more likely to be in the high-decreasing or high-increasing subgroups, and caregivers of children who did not have GvHD were most likely to be in the low-decreasing subgroup.
Distress
Membership in the traumatic distress subgroups was associated with both caregiver marital status and whether the child died during treatment. Married caregivers were most likely to show moderate distress that decreased over time but unmarried caregivers were somewhat more likely to either show low-stable distress or high-stable distress. Caregivers of children who died were primarily in the low-stable or moderate but decreasing subgroups. There were no caregivers of children who died who fell into the high-stable distress subgroup. Caregivers of children who did not die were primarily in the moderate-decreasing subgroup.
Maladaptive and Adaptive Coping Strategies Associated With Trajectory Subgroups
Table IV presents the means, standard deviations, and F-tests assessing the extent to which there were mean-level differences in initial coping in the different subgroups. No significant differences between the subgroups were found for humor, distraction, positive reappraisal, acceptance, or the number of worries. Results for these variables are not included in the Table.
Initial Coping Strategies Associated With Anxiety, Depression, Distress, and Positive Well-Being Trajectory Subgroups
| Variable | Subgroup | Self- blame | Potential for suffering | Holding back concerns | Worry frequency | Family criticism | Planful problem solving | Family support |
|---|---|---|---|---|---|---|---|---|
| M | M | M | M | M | M | M | ||
| (SD) | (SD) | (SD) | (SD) | (SD) | (SD) | (SD) | ||
| Anxiety | (1) Low-decreasing | 2.57a | 9.94a | 1.75a | 4.10a | 26.55a | 5.21a | 42.99 |
| (1.14) | (2.88) | (1.51) | (1.14) | (10.35) | (1.88) | (8.75) | ||
| (2) High-decreasing | 3.85b | 11.60b | 2.58b | 5.15b | 36.54b | 6.40b | 40.55 | |
| (2.11) | (3.50) | (1.17) | (0.89) | (15.42) | (1.70) | (9.34) | ||
| (3) High-stable | 3.29ab | 11.71ab | 2.55b | 4.65ab | 32.14ab | 5.71ab | 39.86 | |
| (2.21) | (2.69) | (1.52) | (1.26) | (14.38) | (1.60) | (5.98) | ||
| F | 6.69** | 3.20* | 3.29* | 7.11** | 6.18** | 3.44* | 0.93 | |
| Depression | (1) Low-decreasing | 2.45a | 9.43a | 1.37a | 3.98a | 26.98 | 5.50 | 44.05a |
| (1.03) | (2.68) | (1.36) | (1.14) | (12.85) | (1.93) | (7.94) | ||
| (2) High-decreasing | 3.66b | 11.70b | 2.86b | 4.84b | 30.51 | 5.54 | 40.37b | |
| (2.01) | (3.12) | (1.19) | (1.05) | (9.60) | (1.79) | (9.22) | ||
| (3) High-increasing | 2.57ab | 12.86b | 2.88b | 4.82ab | 36.82 | 4.71 | 36.00b | |
| (0.98) | (2.73) | (1.28) | (1.05) | (15.15) | (1.89) | (9.56) | ||
| F | 8.34** | 9.92** | 16.84** | 7.54** | 2.67 | 0.60 | 4.26* | |
| Distress | (1) Low-stable | 2.05a | 8.63a | 1.14a | 3.82a | 23.61 | 5.05 | 41.58 |
| (0.23) | (2.39) | (1.46) | (1.34) | (6.69) | (2.22) | (9.30) | ||
| (2) Moderate decreasing | 2.82b | 10.44b | 2.01b | 4.31a | 29.18 | 5.49 | 42.85 | |
| (1.37) | (2.99) | (1.43) | (1.06) | (12.98) | (1.78) | (8.28) | ||
| (3) High-stable | 4.33c | 12.91c | 2.93c | 5.16b | 34.23 | 5.92 | 40.25 | |
| (2.39) | (2.88) | (1.26) | (1.23) | (11.79) | (1.93) | (10.82) | ||
| F | 9.78** | 7.76** | 5.95** | 4.94** | 3.04 | 0.81 | 0.54 | |
| PWB | (1) Moderate increasing | 2.76 | 9.93 | 1.71 | 4.18 | 27.58 | 5.56 | 44.09 |
| (1.38) | (3.16) | (1.47) | (1.21) | (12.20) | (1.93) | (7.78) | ||
| (2) Moderate decreasing | 3.67 | 11.52 | 2.59 | 4.70 | 31.83 | 5.20 | 37.78 | |
| (1.63) | (2.50) | (1.33) | (0.99) | (11.98) | (1.73) | (9.51) | ||
| F | 8.53** | 5.88** | 8.15** | 4.19* | 2.64 | 0.81 | 12.54** |
Note. PWB = Positive well-being. For Anxiety, Depression, and Distress means within outcome variable subgroups with subscripts in common did not differ significantly using a Fisher’s LSD post hoc test. Degrees of freedom for the F-tests for Anxiety, Depression, and Distress were dfnumerator = 2, and dfdenominator ranged between 100 and 105, and for positive well-being, the degrees of freedom were dfnumerator = 1, and dfdenominator ranged between 101 and 106.
p < .05, **p < .01.
Anxiety
Results indicated a consistent pattern across initial self-blame, potential for suffering, holding back sharing concerns, worry frequency, and perceived unsupportive responses from family and friends. Across all of these variables, caregivers who showed a pattern of anxiety that started relatively low and decreased over time were significantly lower in each of these maladaptive coping strategies than caregivers in the high-decreasing subgroup for anxiety. A similar difference emerged for problem solving such that caregivers in the low-decreasing anxiety subgroup reported lower levels of problem solving than caregivers in the high-decreasing subgroup. Notably, caregivers in the high-stable anxiety subgroup did not differ significantly from those in the high-decreasing subgroup on any of the initial coping variables, and they differed from those in the low-decreasing subgroup only on holding back concerns.
Depression
Caregivers who began the study low in depression and continued to decrease over time were significantly lower than caregivers who started high in depression but then decreased over time in self-blame, potential for suffering, holding back concerns, and worry frequency. There was also evidence that caregivers in the low-decreasing depression subgroup received greater family support than those in the high-decreasing subgroup. Similar to results for anxiety, caregivers in the high-increasing subgroup did not differ from those in the high-decreasing subgroup for any of the variables. However, the high-increasing depression subgroup was significantly higher than the low-decreasing subgroup on potential for suffering, holding back sharing concerns, and family support.
Distress
There were significant mean differences between caregivers in each of the three distress trajectory subgroups on self-blame, potential for suffering, and holding back sharing concerns. Caregivers in the low-stable group were lowest on these maladaptive coping strategies, caregivers in the moderate-decreasing group were significantly higher, and caregivers in the high-stable distress group were highest. Worry frequency also showed mean-level differences; the low-stable group was significantly lower in worry frequency than the other two groups.
Positive Well-Being
Caregivers who started at moderate well-being and increased were significantly lower in self-blame, potential for suffering, holding back sharing concerns, and worry frequency than caregivers who started at moderate well-being but decreased over time. In parallel, those who were moderate but increasing reported significantly higher family support than those who were moderate but decreasing in well-being.
Discussion
This study extends the literature by describing the natural trajectory of the emotional functioning of parents, who were randomized to the nonintervention arm of a cognitve-behavioral study, from the time immediately before their child’s HSCT through 1 year after the HSCT. Three distinct subgroups emerged consistently across the anxiety, depression, and distress outcomes. For anxiety and depression, the majority of caregivers had low-decreasing or low-stable symptoms, while a moderate percentage of caregivers began with high anxiety or depression that decreased over time, and a small group of caregives began with high symptoms that persisted or incrased over time. For distress, the majority of caregivers had moderate distress that decreased over time, with a moderate percentage of caregivers showing low-stable distress, and a small percentage of caregivers showing high-stable distress. These findings closely resemble the trajectories of previously reported emotional functioning of parents of children newly diagnosed with cancer—high-declining, moderate-stable, and low-stable (Dolgin et al., 2007) or high, moderate, declining, and low (Steele, Dreyer & Phipps, 2004). Moreover, the distribution of primary caregivers in each subcateory is consistent with the Pediatric Psychosocial Preventative Health Model (Kazak et al., 2006) and screening using the Psychosocial Assessment Tool–2, which has found that most caregivers fall into a univeral risk category, with a moderate percentage demonstrating acute distress that may benefit from intervention, and a small percentage demonstrating persistent and/or escalating distress that warrant proactive clinical intervention (Pai et al., 2008).
There were only a few demographic and medical factors significantly associated with trajectory subgroup membership. Consistent with some previous work (Dolgin et al., 2007), there were more unmarriered caregivers in the high-stable or high-increasing anxiety, depression, and distress subgroups, and cargivers with lower education were more likely to be in the high-stable or high-decreasing anxiety subgroups. Further, caregivers of children with GvHD were more likely to be in the high-stable anxiety subgroup and high-increasing or high-descreasing depression subgroups. These results are in contrast with a study by Terrin and colleagues (2013), who found GvHD was associated with decreased parental emotional functioning acutely but not longitudinally at 12 months post-HSCT.
This study advances previous work by evaluating the relationship between social and cognitive processing factors and trajectories of emotional functioning. Our hypotheses were paritally supported in that maladaptive coping strategies (self-blame, potential for suffering, holding back concerns, and worry frequency) were consistenly associated with the high-stable or high-increasing subgroup compared with the low-stable group. However, for anxiety and depression, these strategies did not differentiate between those who started high and either persisted or decreased in anxiety or depression. Thus, scores on the maladaptive coping strategies can identify those who will not be in the low-stable group but does not appear to be able to distinguish between those who start high and then decrease in anxiety or depression from those who will start high and either remain elevated or get worse in functioning. Therefore, only in the distress trajectories did we see a clear pattern of higher levels of maladaptive coping between each trajectory. These results are consistent with previous work linking avoidant and disengagement coping with depression (Kroenenberger, 1998) and family criticism with posttrauamatic stress (Manne et al., 2002). Our hypotheses regarding adaptive coping strategies and distress trajectories were only minimally supported. Problem-solving was higher among caregivers in the high-decreasing versus low-decreasing anxiety subgroups, suggesting that these caregivers may have had more problems to solve and used the skill effectively. Family support was higher among caregivers in the low-decreasing versus high-increasing depression and among caregivers who showed an increase in positive well-being over time. However, none of the other adaptive coping strategies were significantly associated with outcomes for this nonintervention group.
Taken together, these results suggest that the majority of caregivers will adjust well without intervention; however, a discrete subgroup will experience persistent or increased distress following their child’s HSCT. Furthermore, the three distinct trajectories may be interpreted within a conceptual framework of caregiver repsonse to stressful events. The low-stable trajectores may be interpreted as caregiver resilience with consistently low symptoms over time. The moderate-decreasing trajectories may be framed as the development of resilience or stress-related growth with the dimunition of symptoms over time. The high-stable or high-increasing trajectories represent the group at greatest risk of clinically significant distress.
This study had some limitations. First, this study was a secondary analysis of a clinical trial examining caregivers in a control condition of a larger clinical trial. Thus, the sample may have differed from an observational study in terms of distress and well-being, both at the time of recruitment and over time. Second, the 20% of the participants who were approached for this trial and refused the study owing to being stressed or overloaded may have been more distressed caregivers. Thus, the current sample may underrepresent the percentage of parents in the persistently high distress trajectory. A third limitation is the small sample size (N = 108) for trajectory analyses, and, accordingly, the small number of parents who demonstrated high and persistent negative emotional responses. Given the small sample size, it was difficult to identify factors that distinguished between those who started with high distress that declined over time from those who started with high distress that remained high or worsened. Replication in larger samples is needed. Fourth, because only type of maladaptive coping was assessed (self-blame), future studies should assess other types of maladaptive coping. Fifth, our study focused only on caregiver functioning. Future studies would benefit from examining the interrelationship between caregiver and child functioning over time.
Clinically, these results support the use of screening of caregivers of children undergoing HSCT. Screening for maladaptive coping strategies such as self-blame, potential for suffering, holding back concerns, and worry frequency may be particularly useful for identifying caregivers likely to experience high-stable distress who may benefit from intervention. Screening on these coping strategies may also help distinguish between caregivers likely to display low-decreasing anxiety and depression versus those who will start high and persist, increase, or decrease, but these measures do not seem sensitive enough to identify those at highest risk from those who start high and go on to improve. Other screening tools, such as the PAT 2.0 (Pai et al., 2008), may also be useful for this population and warrant further integrated research. Early intervention for at-risk caregivers could lead to improvements in both caregiver and child functioning. Examples of currently available parent interventions include the Parent Social-Cognitive Processing Intervention Program (Manne et al., 2016), the Bright IDEAS Problem-Solving Skills Training (Sahler et al., 2013), and Surviving Cancer Competently Intervention Program (Kazak et al., 2005).
In conclusion, this study found three distinct trajectories for caregiver anxiety, depression, and distress in the year following their child’s HSCT. Although the majority of parents will experience low-stable or moderate-decreasing negative emotions, a small subgroup will experience significant persistent symptoms and may benefit from screening and intervention before the HSCT.
Acknowledgments
The authors acknowledge Tara Bohn, Caraline Craig, Ayxa Calero-Breckeimer, Sara Frederick, Tina Gajda, Laura Goorin, Merav Ben Horin, Bonnie Maxson, Julia Randomski, Mirko Savone, Kristen Sorice, Kate Volipicelli, and Octavio Zavala. They thank the caregivers who participated, the pediatric HSCT teams at all sites, and the P-SCIP interventionists. Ernie Katz participated in this study for the first year.
Funding
This work was supported by grant CA127488 awarded by the National Cancer Institute to Sharon Manne.
Conflicts of interest: None declared.
References
