


Abstract
In this study, we examine two common invasion biology hypotheses—biotic resistance and fluctuating resource availability—to explain the patterns of invasion of an invasive grass, Microstegium vimineum.
We used 13-year-old deer exclosures in Great Smoky Mountains National Park, USA, to examine how chronic disturbance by deer browsing affects available resources, plant diversity, and invasion in an understory plant community. Using two replicate 1 m2 plots in each deer browsed and unbrowsed area, we recorded each plant species present, the abundance per species, and the fractional percent cover of vegetation by the cover classes: herbaceous, woody, and graminoid. For each sample plot, we also estimated overstory canopy cover, soil moisture, total soil carbon and nitrogen, and soil pH as a measure of abiotic differences between plots.
We found that plant community composition between chronically browsed and unbrowsed plots differed markedly. Plant diversity was 40% lower in browsed than in unbrowsed plots. At our sites, diversity explained 48% and woody plant cover 35% of the variation in M. vimineum abundance. In addition, we found 3.3 times less M. vimineum in the unbrowsed plots due to higher woody plant cover and plant diversity than in the browsed plots. A parsimonious explanation of these results indicate that disturbances such as herbivory may elicit multiple conditions, namely releasing available resources such as open space, light, and decreasing plant diversity, which may facilitate the proliferation of an invasive species. Finally, by testing two different hypotheses, this study addresses more recent calls to incorporate multiple hypotheses into research attempting to explain plant invasion.
INTRODUCTION
Two hypotheses that are commonly invoked to explain patterns of plant invasion are biotic resistance (Elton 1958) and fluctuating resource availability (Davis et al. 2000). Since Elton (1958), high diversity within native communities has frequently been suggested as an important barrier to ecological invasion (Case 1990; Levine 2000; Kennedy et al. 2002). More diverse communities might provide biotic resistance to invasion by occupying more space, generating more biomass, and using more resources (Tilman 1999; Kennedy et al. 2002). However, while the biotic resistance hypothesis has been supported through manipulative studies at small scales, this hypothesis seems not to hold at larger scales (Kennedy et al. 2002; Levine and D’Antonio 1999; Stohlgren et al. 2003). Another common explanation for species invasion is the hypothesis of fluctuating resource availability, which predicts that a plant community will become more vulnerable to invasion when there is an increase in quantity of unexploited resources (Davis et al. 2000). The availability of resources may fluctuate when the use of resources by the resident plant community declines or if the resource supply increases at a rate faster than the resident plant community can utilize. Both the biotic resistance and fluctuating resource hypotheses predict that disturbances can increase the likelihood of an exotic species invasion. However, the biotic resistance hypothesis predicts a decrease in plant diversity, that is the loss of species, should make a community more susceptible to invasion (Levine and D’Antonio 1999). Conversely, the fluctuating resource availability hypothesis predicts a decrease in plant abundance or an increase in resources, regardless of plant diversity, will decrease competition for resources between the invader and the resident plant community, which in turn will increase community invasibility (Davis et al. 2000).
A well-known and chronic disturbance that may influence community invasibility is browsing by deer. The proliferation of white-tailed deer (Odocoileus virginianus Zimm.) has raised many questions about the impacts of this species on plant community structure (Côté et al. 2004; Horsley et al. 2003). Browsing reduces understory plant abundance, as well as sapling survival and performance (Griggs et al. 2006; Horsley et al. 2003; Lessard et al. 2012; Rooney and Waller 2003; Webster et al. 2005, 2008), and the latter impact in turn decreases the size and the number of seedlings. This decrease may eventually lead to a complete failure of regeneration of woody species (Rooney and Waller 2003). In addition, preferential browsing by deer can change competitive relationships among species and shift overall cover, diversity, and structure of the plant community (Côté et al. 2004 and references within) and associated litter and soil invertebrate communities (Lessard et al. 2012). Finally, the disturbance caused by excessive browsing often leaves understory plant communities with unfilled spaces and under-used resources, such as soil nutrients or light, that may allow invasive species to establish (Eschtruth and Battles 2008; Webster et al. 2008).
Microstegium vimineum (Trin.) A. Camus (Japanese stiltgrass) is an invasive annual grass that was first documented in North America in Knoxville, TN, in 1919 (Fairbrothers and Gray 1972). Since 1919, M. vimineum populations have spread across the east coast, including the Great Smoky Mountains National Park, USA (Cole and Weltzin 2004). Like many other invasive plants, M. vimineum is linked to sites with low native plant diversity (Adams and Engelhardt 2009; Flory et al. 2007; Oswalt et al. 2007) and to sites prone to chronic disturbance (Cole and Weltzin 2004). Specifically, disturbances such as seasonal streambank flooding (Barden 1987), overhead canopy disturbance (Oswalt et al. 2007), and increased white-tailed deer herbivory (Eschtruth and Battles 2008) have all been associated with M. vimineum invasion. Although empirical studies have shown that the direct impact of deer herbivory increases the likelihood of invasion by M. vimineum (Baiser et al. 2008; Eschtruth and Battles 2008), studies comparing the roles of diversity and disturbance in plant invasion are rare. This is an important consideration as it is increasingly recognized that multiple interacting hypotheses may be needed to explain patterns of plant invasion (Catford et al. 2009; Mitchell et al. 2006). If white-tailed deer browse selectively on woody species, then this disturbance may cause two nonmutually exclusive outcomes. First, as woody species are removed from the community, a decrease in plant diversity may follow. Second, a loss of individuals may increase available resources, such as space, accessible light, or soil nutrients.
Using long-term deer exclosures in the Cades Cove region of Great Smoky Mountains National Park, USA, we examined the effects of deer browsing on invasive M. vimineum and native understory plant communities. We tested the hypothesis that deer browsing would decrease woody plant abundance and cover, a measure of available space within plots, and that this would reduce resource uptake by the resident plant community, which in turn will increase the likelihood of invasion by M. vimineum. To test whether fluctuating resources or diversity moderated plant invasion, we predict the following: If an increase in available resources is driving grass invasion, we would expect to see an increase in M. vimineum abundance and a decrease in woody plant abundance and cover (i.e. our proxy measures for open space) or available resources (i.e. soil nutrients; fluctuating resource availability hypothesis). Alternatively, if the loss of diversity is driving the invasion, we would expect to see a negative relationship between plant diversity and M. vimineum abundance (biotic resistance hypothesis). By comparing measures of availability of resources and diversity to the abundance of other grass species present at the sites, we can separate the effects of deer browsing on graminoid species in general and on the exotic invasive M. vimineum.
MATERIALS AND METHODS
Study site
In 1996, 15 deer exclosures were built at three sites along a moisture gradient, John Oliver Cabin, Hyatt Lane, and Abrams Creek, within Cades Cove in the Great Smoky Mountains National Park, USA (site details described in Webster et al. 2005). The Cades Cove area consists of a matrix of interconnected early-successional forest and open-field agricultural patches. The canopy of the John Oliver and Hyatt Lane sites consists of Quercus alba L., Liriodendron tulipifera L., Carya spp., and Tsuga canadensis L., whereas the understory is predominantly Acer rubrum L. and Ilex opaca Ait. with a primary herbaceous layer of M. vimineum. The presence of Pinus strobus L. within the Hyatt Lane site is the only overstory difference between the two sites. The canopy of the Abrams Creek site is dominated by A. rubrum, Liquidambar styraciflua L., L. tulipifera and P. strobus, whereas patches of Sphagnum spp., M. vimineum, and saplings of overstory species dominate the understory. At each site, five areas were randomly selected to contain a single paired 12×12 m deer exclosure (hereafter “unbrowsed”) plots and 12×12 m deer accessible (hereafter “browsed”) plots. A 2.4 m tall, heavy gauge woven-wire fence bordered each exclosure. Within each unbrowsed plot, a 10×10 m plot was centrally located and surrounded by 1 m buffers. Replicated browsed plots were paired outside of each exclosure with 1 m buffers along each exclosure fence.
Study species
Microstegium vimineum is a shade-tolerant C4 grass (Cole 2003). Winter et al. (1982) found that M. vimineum can persist at ambient light levels as low as 5% (100 µE m−2 s−1 or approximately 95 µM m−2 s−1) of full sunlight (Winter et al. 1982), but Cole and Weltzin (2005) found that M. vimineum biomass and fecundity decreased significantly at light levels lower than 16% ambient light. The ability of M. vimineum to survive at such low light levels has been attributed to its ability to open and close its stomata rapidly in response to momentary sunflecks (Cole 2003). M. vimineum is an annual grass that sets prolific seeds each fall (Winter et al. 1982), and the species readily invades eastern deciduous forests (Gibson et al. 2002).
Study design
At the height of the growing season in 2009, we randomly placed four 1×1 m square sample quadrats, two in each browsed and two in each unbrowsed plot, to assess plant understory community dynamics at each of the three sites. For each quadrat, we recorded each plant species (or morphospecies when taxonomically diagnostic characters were absent), the abundance (counted as number of aboveground stems) per species, and the fractional percent cover of vegetation by the cover classes: herbaceous, woody, and graminoid. Many of the graminoid species lacked fruit or flowers, and thus, we were unable to identify them further than to family. Because of this, we grouped all other grass species, whether native or nonnative, as “noninvasive.” Although we do not know their native origin, there are no other grass species reported to invade closed-canopy forests in our study area, and thus, we are confident that none of these species are invasive (Tennessee Exotic Pest and Plant Council 2009, online www.tneppc.org/invasive_plants). We used plant abundance and plant cover as proxies for assessing resource availability of space and light. For each sample plot, we estimated mature overhead canopy cover with a hand-held spherical densiometer.
To assess plot conditions that may affect plant community composition or signify changes in resource use, we quantified differences in soil moisture, soil pH, and total soil nitrogen (N) and carbon (C) at all three sites. We assessed soil moisture and pH for each browsed and unbrowsed plot in the fall of 2009 by collecting three soil samples, comprising the top ~12cm of mineral soil. These soils were pooled for each browsed and unbrowsed plot to give a total of 30 soil composites for soil analysis. Soil moisture content was calculated as the difference in weight after samples were placed in a drying oven at 105°C for 48h. Soil pH was calculated from 10g slurries of sample soil and 20ml of deionized water using a Denver Instruments Model 220 pH conductivity meter (Denver Instrument, Bohemia, NY). We quantified total soil C and N on 5–10 randomly collected mineral soil samples from each browsed and unbrowsed plot at each site (collected from 0–15cm depth). Samples were air-dried and ground with a pestle and mortar to a fine powder. The samples were then run on a Thermo, Flash EA 1112 Series CHN analyzer (Thermo Electron S.P.A., Italy), using an Elantech soil reference as a reference standard and l-Aspartic acid as a standard.
Statistical analysis
To assess the effects of deer herbivory on the understory plant community, we first quantified plant diversity, using the Simpson’s diversity index. Here, we report the inverse of Simpson’s diversity index to represent the probability that two randomly selected specimens in the study area belong to different species; values near 1 represent high diversity and values near 0 represent low diversity. Data were transformed, when necessary, to achieve normality and reduce heteroscedasticity.
We performed paired t-tests to assess the differences between biotic and abiotic features of deer browsed and unbrowsed plots among sites, including mature overhead canopy cover, soil moisture, soil pH, total soil C and N, as well as total plant cover, abundance, richness, and diversity. We also compared total cover, richness, and abundance by cover class (woody, herbaceous, and graminoid). Finally, we divided grass abundance into two groups—M. vimineum and noninvasive grasses—to compare abundances of each group in browsed and unbrowsed plots. We used linear regression analysis to compare the effects of significant plot traits on M. vimineum and noninvasive grass abundance. Plot traits found to affect M. vimineum or noninvasive grass abundance significantly were then assessed as potential variables for multiple regression analysis across plots. We used adjusted Akaike Information Criteria (AICc) scores to select the best model. To insure site variability was not affecting variables of interest, we ran separate analysis of variance (ANOVA) using each variable selected in the best AICc model (including M. vimineum abundance) as our predictor variable and the fixed factors of site (three sites), paired replicate plots nested within site (five replicates per site), exclosure treatment (deer exclosure or access plots), and the interaction between site and exclosure as our independent variables. To separate space and diversity variables further by browsed and unbrowsed plots and to deal with potential colinearity between predictor variables, we included partial regression models on the variables included in the multiple regression model. Partial correlation allows us to measure the relationship of each variable to M. vimineum abundance while holding other variables constant and thus separating the variances between independent variables. We used JMP statistical software to complete all analysis (JMP, Version 9. SAS Institute Inc., Cary NC, 1989–2012).
RESULTS
A total of 7155 plants, representing 67 species, were surveyed, including the invasive grass M. vimineum (Supplementary material, Appendix 1). Only one other invasive plant, Rosa multiflora Thunb. (multiflora rose), was found within the study sites. There were no differences between deer browsed and unbrowsed plots among the site variables of mature overhead canopy cover, soil moisture, soil pH, or total soil C and N (Table 1).
a suite of biotic and abiotic traits were measured and compared using paired t-tests (df = 14) between deer browsed and unbrowsed plots in Great Smoky Mountains National Park, USA
| Variables | Unbrowsed plots mean ± SD | Browsed plots mean ± SD | t-value | P-value |
|---|---|---|---|---|
| Site variables | ||||
| Soil gravimetric water content | 0.31±0.12 | 0.31±0.14 | −0.27 | 0.791 |
| Soil pH | 4.70±0.86 | 4.80±0.79 | 0.56 | 0.585 |
| Overhead canopy cover (%) | 87.73±10.94 | 82.97±5.66 | −1.167 | 0.117 |
| Total soil nitrogen (%) | 0.42±0.19 | 0.38±0.18 | −1.76 | 0.100 |
| Total soil carbon (%) | 5.63±2.31 | 4.95±2.50 | −1.47 | 0.165 |
| Woody species | ||||
| Abundance | 17.27±20.59 | 5.53±5.97 | −2.88 | 0.012 |
| Richness | 4.2±1.93 | 3.07±1.75 | −2.54 | 0.023 |
| Cover (%) | 46.4±29.68 | 2.37±2.39 | −5.81 | <0.0001 |
| Graminoid species | ||||
| Abundance | 48.87±120.66 | 153.5±103.06 | 6.95 | <0.0001 |
| Richness | 1.47±0.64 | 2.87±1.60 | 4.37 | 0.0006 |
| Cover (%) | 13.84±25.35 | 48.14±23.86 | 6.22 | <0.0001 |
| Herbaceous species | ||||
| Abundance | 7.93±11.30 | 4.5±5.86 | −1.173 | 0.261 |
| Richness | 2.47±2.3 | 2.6±2.35 | 0.2864 | 0.779 |
| Cover (%) | 3.09±4.58 | 2.51±5.68 | −1.023 | 0.323 |
| Total species | ||||
| Abundance | 80.53±117.53 | 164.43±101.92 | 5.96 | <0.0001 |
| Richness | 8.13±3.48 | 8.67±4.20 | 0.586 | 0.567 |
| Cover (%) | 62.5±30.13 | 54.07±25.08 | −1.023 | 0.323 |
| Diversity (Inverse Simpson’s) | 0.59±0.24 | 0.35±0.18 | −3.57 | 0.003 |
There were significant differences between browsed and unbrowsed plots in measures of space, plant abundance, and understory plant cover. Although total understory plant cover did not differ between browsed and unbrowsed plots, total plant abundance was two times higher in browsed plots (Table 1). When M. vimineum individuals were excluded from analysis, we found no difference in plant abundance between browsed and unbrowsed plots (t(14) = −1.06, P = 0.3065). When we separated understory plant species by cover class, we found woody plant species were three times more abundant and nearly 20 times higher in cover (Table 1 and Fig. 1A) in unbrowsed plots. Conversely, graminoid abundance and cover were both three times higher in deer browsed plots (Table 1). The abundance of M. vimineum was almost 3.5 times higher (Table 1 and Fig. 1B), whereas noninvasive grasses were twice as abundant in browsed plots (Table 1). A multiple linear regression analysis showed that total graminoid abundance in the browsed plots was primarily explained by M. vimineum abundance (R = 0.94) rather than noninvasive grass abundance (R = 0.39; F2,12 = 12.68, P = 0.0011). Herbaceous species showed no difference in abundance or cover (Table 1) between browsed and unbrowsed plots.
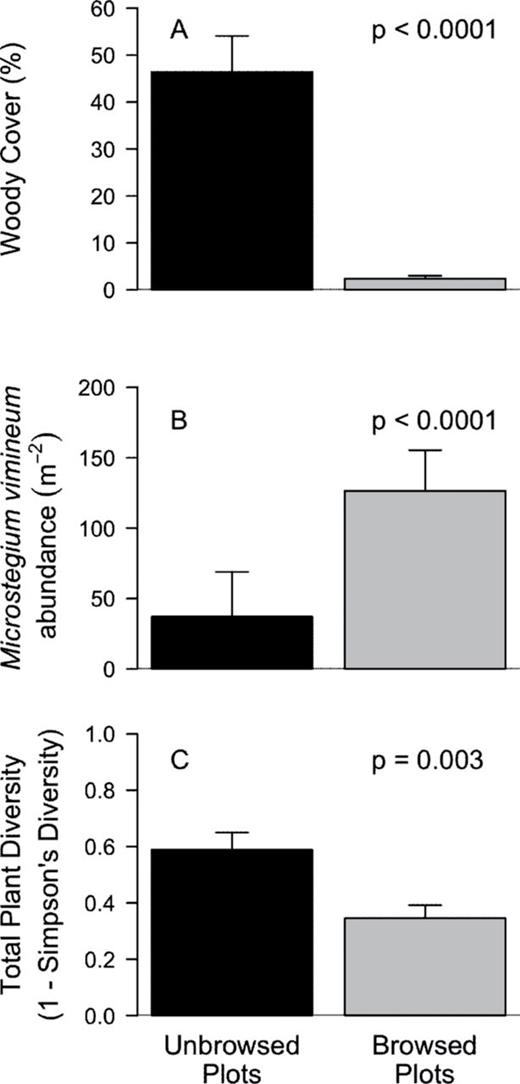
deer browsed and unbrowsed plots varied in M. vimineum abundance, total plant species diversity, and woody plant cover. Within unbrowsed plots, woody species cover was 20 times higher (A), M. vimineum was three times less abundant (B), and plant diversity was 33% higher (C) than in deer browsed plots.
Plant diversity was one-third higher in unbrowsed plots (Table 1 and Fig. 1C) and remained significantly higher when M. vimineum was excluded from the analysis (t(14) = 3.77, P = 0.002). Total plant richness was not significantly different (Table 1) between browsed and unbrowsed plots, suggesting that only differences in abundance of plant species were driving the differences in plant diversity. However, woody plant species had 25% higher richness in unbrowsed plots, whereas graminoid species had almost two times higher richness in browsed plots (Table 1). Herbaceous species showed no difference in richness between browsed and unbrowsed plots (Table 1).
Our measures of resource availability and diversity both correlated with the abundance of the invasive grass. Microstegium vimineum abundance was negatively correlated with woody plant cover (Fig. 2A), woody species richness (Fig. 2B), and total plant diversity (Fig. 2C). Moreover, there was no relationship between woody plant abundance and M. vimineum abundance (P = 0.133). As expected, woody plant cover was positively correlated with total plant diversity (P < 0.0001) and woody plant richness (P = 0.002) due to the release of woody plant species from deer browsing. In addition, we found that when the percentage of woody cover reached 10%, M. vimineum abundance was reduced from over 126±29 individuals m−2 (mean ± SE) to under 10 individuals m−2 (5.51±1.89, Fig. 2A).

woody plant species were negatively related to M. vimineum but showed no relationship to noninvasive grass species. The abundance of M. vimineum was negatively correlated with woody plant cover (A), woody species richness (B), and total plant diversity (C). The abundance of noninvasive grasses was not correlated to any of these variables (D–F).
Across all variables, the multiple regression model with the independent variables of woody plant cover and total plant diversity was found to be the best model. In this model, total plant diversity explained 48% of the variation in M. vimineum abundance and woody cover explained 35% of the variation (Table 2). Separate ANOVA analyses showed that only exclosure treatment (deer browsed or unbrowsed), but not site or its associated variables (i.e. block nested within site and site by exclosure interaction), was significantly related to M. vimineum abundance, total plant diversity, and woody plant cover (Table 3).
across all biotic and abiotic traits measured in deer browsed and unbrowsed plots, woody plant cover (%) and plant species diversity (Inverse Simpson’s Diversity Index) provided the best overall model for accounting for Microstegium vimineum abundance
| Variables | Coefficient | Standard error | t-value | P-value |
|---|---|---|---|---|
| All plots | ||||
| Intercept | 0 | 34.65 | 68.9 | <0.001 |
| Plant diversity | −0.479 | 85.21 | −2.91 | 0.007 |
| Woody plant cover | −0.351 | 10.23 | −2.13 | 0.042 |
| Browsed plots | ||||
| Intercept | 0 | 51.51 | 5.12 | <0.001 |
| Plant diversity | −0.59 | 141.12 | −2.67 | 0.02 |
| Woody plant cover | −0.21 | 19.56 | −0.95 | 0.36 |
| Unbrowsed plots | ||||
| Intercept | 0 | 56.82 | 5.92 | <0.0001 |
| Plant diversity | −0.30 | 90.77 | −1.70 | 0.12 |
| Woody plant cover | −0.66 | 16.40 | −3.73 | 0.003 |
Although both had a negative effect on M. vimineum abundance, plant species diversity had a stronger impact, explaining 48% of the variation in the multiple regression analysis. When browsed and unbrowsed plots were assessed separately, single-variable models were more appropriate for explaining M. vimineum abundance. Plant species diversity had a stronger negative impact on M. vimineum abundance in the deer browsed plots while woody plant cover had a stronger negative impact in unbrowsed plots.
impact of deer browsing on the abundance of an invasive plant species was examined across three sites within the Cades Cove region of Great Smoky Mountains National Park, USA
| Microstegium | ||||
|---|---|---|---|---|
| Microstegium | ||||
| vimineum | Plant | Woody plant | ||
| df | abundance | diversity | cover | |
| Full model | ||||
| Model | 17 | 3.482 7* | 3.51* | 10.34*** |
| Source effects | ||||
| Site | 2 | 1.79 | 2.75 | 0.96 |
| Block (site) | 12 | 1.10 | -- | 5.07** |
| Exclosure | 1 | 38.09*** | 10.94** | 111.60*** |
| Site × | 2 | 2.17 | 0.56 | 0.72 |
| Exclosure | ||||
| Microstegium | ||||
|---|---|---|---|---|
| Microstegium | ||||
| vimineum | Plant | Woody plant | ||
| df | abundance | diversity | cover | |
| Full model | ||||
| Model | 17 | 3.482 7* | 3.51* | 10.34*** |
| Source effects | ||||
| Site | 2 | 1.79 | 2.75 | 0.96 |
| Block (site) | 12 | 1.10 | -- | 5.07** |
| Exclosure | 1 | 38.09*** | 10.94** | 111.60*** |
| Site × | 2 | 2.17 | 0.56 | 0.72 |
| Exclosure | ||||
To insure site variability was not affecting Microstegium vimineum abundance (m−2), total plant diversity (Inverse Simpson’s Index), and woody plant cover (%), we ran separate two-way ANOVA analyses using the fixed factors of site (three sites), paired replicate plots nested within site (five replicate blocks per site), exclosure treatment (browsed or unbrowsed plots), and the interaction between site and exclosure treatment as our independent variables. Here, we report the F-ratios where asterisks (*) indicate P-value: ***P < 0.0001, **P < 0.01, *P < 0.05.
When regression models were broken down by exclosure treatment, a different pattern emerged. The best model to explain the abundance of M. vimineum in unbrowsed plots was woody cover, whereas the best model to explain the abundance of M. vimineum in browsed plots was plant diversity (Table 2). Because colinearity between predictor variables can inflate type II error and influence regression coefficients, we also used partial least-square regression models that are more robust to colinearity issues (Carrascal et al. 2009). Partial correlation analysis between the independent variables woody cover and total plant diversity supported previous regression models. In deer browsed plots, M. vimineum abundance decreased with increasing total plant diversity (r2 = 0.34, P = 0.027), when woody cover was held constant. In contrast, when total plant diversity was accounted for, woody plant cover was insignificant (r2 = 0.002, P = 0.88). In unbrowsed plots, M. vimineum abundance decreased with increasing woody plant cover, holding total plant diversity constant, but this relationship was only marginally significant (r2 = 0.26, P = 0.062). Microstegium vimineum abundance was not related to total plant diversity (r2 = 0.059, P = 0.40) in unbrowsed plots.
However, while measures of resource availability and diversity correlated with the abundance of M. vimineum, there was no relationship between noninvasive grass abundance and woody plant cover (Fig. 2D), woody species richness (Fig. 2E), woody plant abundance (P = 0.16), total plant diversity (Fig. 2F), or M. vimineum abundance (P = 0.98). Instead, the greatest determinant of noninvasive grass abundance was site (F29 = 13.93, P < 0.0001); Hyatt Lane had significantly less native grass than the Abrams Creek or John Oliver Cabin sites.
DISCUSSION
The most parsimonious interpretation of our results suggests that both the biotic resistance and the fluctuating resource availability hypothesis could explain the invasion of M. vimineum. Overall, we found two main patterns: (i) deer browsing influenced measures of plant diversity and resource availability (primarily plant abundance and cover, our proxy measures of space) and (ii) M. vimineum abundance increased with reductions in woody plant cover and total plant species diversity, whereas the abundance of noninvasive graminoid species did not.
Our study suggests that the disturbance caused by selective deer browsing plays an important role in invasion by M. vimineum. White-tailed deer preferentially browse woody plant species (Horsley et al. 2003; Russell et al. 2001), and we found that deer browsed plots had significantly lower woody plant species abundance and cover than unbrowsed plots (Table 1). A shift in community composition is common in heavily browsed areas (Côté et al. 2004 and reference within). For example, Horsley et al. (2003) found woodland communities shifting to primarily grassland-type habitats in the presence of deer herbivory. Moreover, Webster et al. (2008) have reported that browsing by white-tailed deer and other disturbances promoted the persistence of M. vimineum in the forest understory but have not defined how disturbance specifically promotes invasion.
Two lines of evidence support the biotic-resistance hypothesis for M. vimineum invasion in the forest understory community. First, when deer browsing was prevented, the abundance, cover, and richness of woody species increased as did total plant diversity. We did not find a significant difference in total plant richness between browsed and unbrowsed plots because woody richness was higher in unbrowsed plots, and graminoid richness was higher in the browsed plots. However, diversity—a measure of both species richness and evenness—changed significantly between browsed and unbrowsed plots. This is attributed to the inequity of abundances between M. vimineum and noninvasive grasses where M. vimineum numbers overwhelmed noninvasive grass numbers. Second, our partial regression analysis showed that in unbrowsed plots, only diversity was correlated with the variation in M. vimineum abundance. A loss of native plant diversity to deer herbivory may lead to the degradation of a community’s resistance to a plant invasion. For example, Barden (1987) found that M. vimineum was unable to invade areas with existing vegetation, even in treatment plots where fertilizer was added to the soils. However, he attributed the inability of M. vimineum to invade these areas to a suite of environmental conditions that included higher pH, a variable we did not find differed significantly in our analysis. Because plant diversity explained more variation across all plots and between deer browsed and unbrowsed plots, it appears that the diversity of the plant community, and thus the biotic resistance hypothesis, could play a role in preventing invasion by M. vimineum.
Our data show significant correlations between plant diversity and M. vimineum abundance. Because we did not directly manipulate plant species diversity, we cannot evaluate the role of deer browsing disturbance on diversity and M. vimineum abundance. However, two lines of evidence suggest deer browsing directly decreased plant diversity, allowing M. vimineum to invade. First, most studies of M. vimineum invasion support that M. vimineum primarily invades only disturbed sites that have lost plant diversity prior to invasion (Barden 1987; Cole and Weltzin 2004; Marshall and Buckley 2008; Mortensen et al. 2009; Oswalt et al. 2007). Second, previous studies contrasting herbivore impacts between the Cades Cove area with high deer densities and nearby reference sites with significantly lower deer densities show that intense deer browsing decreased plant community diversity, evenness, and species richness (Webster et al. 2005).
However, heavy and selective herbivory within the resident plant community would remove plant individuals from an area and may consequently reduce resource use, which could take the form of increased available space, light, or soil nutrients, thus increasing the chance of invasion (Davis et al. 2000). We found that M. vimineum abundance was correlated with woody plant cover, our proxy for available space and light, but not with soil nutrient availability, measured as total soil N and C.
This apparent discrepancy between resources might be caused because M. vimineum is known to modify soil microbial community structure and function (Ehrenfeld et al. 2001; Kourtev et al. 2002). Recently, Bauer (2012) proposed M. vimineum is neither a true “passenger” nor a true “driver’ of change (MacDougall and Turkington 2005), but instead fits a third model, that of the “backseat driver.” In this model, backseat drivers enter a community as a passenger to disturbance but consequently modify community composition driving further community change. We detected a change in the available resources of space and light, using a measure of woody plants that would remain, post invasion. If M. vimineum invasion modifies soil nutrients through shifts in soil community structure and function, then our post invasion measures of soil nutrient availability might not reflect available resources at the time of invasion.
As deer browsing decreased woody plant cover and abundance, the loss of individuals may have made more resources available to M. vimineum, allowing it to invade and persist. When deer browsing depresses native woody species in deer browsed plots, it also may release graminoid species to fill in the open spaces. Although we recorded an increase in the abundance of both M. vimineum and noninvasive grass species in deer browsed plots, the open space caused by disturbance was primarily filled by M. vimineum (Table 2).
Experimental studies have shown that a primary deterrent to community invasion by M. vimineum is lack of light (Cole and Weltzin 2005; Flory et al. 2007; Schramm and Ehrenfeld 2010; Warren et al. 2011; Winter 1982). Thus, our finding that woody cover was the best explanation for M. vimineum abundance in unbrowsed plots (Table 2) is in line with these previous findings because denser woody cover would prevent more light from reaching the forest floor. In particular, the finding of Schramm and Ehrenfield (2010) showed M. vimineum seedling survival was significantly lower under a dense layer of the subcanopy shrub Lindera benzoin (L.) Blume. The authors attribute this relationship to the significantly lower light levels under the shrubs and not the identity of the species itself. The presence of newly emerging tree saplings and shrubs, which form a dense cover and measured by total woody cover, is probably preventing the survival of M. vimineum within unbrowsed plots and may explain why M. vimineum is not re-invading these unbrowsed plots.
Although the lack of woody cover outside the exclosure is undoubtedly affecting the success of M. vimineum, our multiple regression analysis showed that diversity explained more variation in M. vimineum abundance than woody plant cover, our proxy for resource availability (Table 2). This is additionally supported by the fact that noninvasive grass species’ abundances was not attributed to the increase in available resources or diversity, indicating that M. vimineum reacts differently to disturbance than other, noninvasive grass species.
In conclusion, a cautious interpretation of our results indicates that browsing by deer is significantly related to changes in understory plant community structure (reduced woody plant cover) and decreasing plant diversity. Moreover, our analysis shows that if woody species cover is allowed to reach a minimum of 10%, then the abundance of M. vimineum will drop drastically. These data in total suggest that both the fluctuating-resource hypothesis and the biotic-resistance hypothesis might explain the invasion of M. vimineum. Finally, our findings address more recent calls to incorporate multiple hypotheses into research attempting to explain plant invasion (Catford et al. 2009, Mitchell et al. 2006). Because many single hypotheses have empirical support in certain cases but not others, looking at multiple hypotheses might provide a better understanding of why invasions differ across communities (Catford et al. 2009). Ultimately, if more community invasion studies can determine which factors, such as fluctuating resources and diversity, may co-vary with invasion, then management recommendations for plant invasions could shift their focus from managing the invasive species directly to managing for those community components that provide the best resistance to invasion.
FUNDING
Department of Ecology and Evolutionary Biology at the University of Tennessee, Knoxville.
SUPPLEMENTARY MATERIAL
Supplementary material is available at Journal of Plant Ecology online.
ACKNOWLEDGMENT
We thank Chris Webster, Janet Rock, and the Great Smoky Mountains National Park for kindly providing access to the study sites and B. Eugene Wofford for helping with plant identification. Thanks to Logan Elmore and Stacey Martinez for assistance with the soil analysis. We also thank Dan Simberloff, Martin Nuñez, Nate Sanders, and two anonymous reviewers for helpful comments on this manuscript.
REFERENCES


