


Abstract
Pan evaporation (Epan) is a critical measure of the atmospheric evaporation demand. Analyzing meteorological data from the Tropical Rainforest Comprehensive Meteorological Observation Field in the Xishuangbanna Tropical Botanical Garden (XTBG Meteorological Observing Station) based on physical models is helpful to improve our understanding of the state of the hydrological cycle in the Xishuangbanna tropical rainforest region. In this study, we investigated the long-term trend in Epan using the observation data from 1959 to 2021. Moreover, correlation analyses of Epan were performed, such as trend test, assessment of periodic properties and abrupt change analysis. Then, D20 Epan data and related meteorological data from 1979 to 2008 were used to drive Penman‒Monteith and PenPan models for simulating Epan. The partial derivative attribution method was used to analyze the dominant factors affecting Epan. The results showed that Epan exhibits obvious periodic changes, the 19a is the first primary period. In addition, there was a clear ‘evaporation paradox’ phenomenon in Xishuangbanna. Epan showed a decreasing trend during both 1959–2008 and 2009–2018, and the decreasing trend reached a significant level with a rate of −3.404 mm·a−2 during 1959–2008. Through comparative analysis, the PenPan model was considered more suitable for simulating Epan in Xishuangbanna. In order to identify the main meteorological factors influencing Epan, complete data from the D20 pan monitoring period, namely, 1979–2008, were selected for attribution calculations. The variations in the net radiation and saturated vapor pressure deficit are the main triggers that explain the ‘evaporation paradox’ phenomenon in Xishuangbanna.
摘要
蒸发皿蒸发量(Epan)是衡量大气蒸发需求的重要指标。基于物理模型对西双版纳热带植物园中热带雨林综合气象观测场(XTBG气象站)的气象资料进行分析,有助于提高我们对西双版纳热带雨林区域水文循环状况的认识。本文利用1959–2021年的观测资料,研究了Epan的长期变化趋势,并进行了趋势检验、周期性评价和突变分析等相关分析。基于1979–2008年D20 Epan数据和相关气象资料,利用Penman–Monteith和PenPan模型对Epan进行模拟,采用偏微分归因法分析了影响Epan的主导因素。研究结果表明,Epan具有明显的周期变化,19 a为第一主周期。而且,西双版纳地区存在明显的‘蒸发悖论’现象。Epan在1959–2008年和2009–2018年均呈下降趋势,其中1959–2008年下降幅度达到显著水平,为−3.404 mm a−2。通过对比分析,认为PenPan模型更适合用于模拟西双版纳地区的Epan。为了确定影响Epan的主要气象因子,选取了D20蒸发皿完整监测时期的数据(1979–2008)进行归因计算。太阳净辐射和饱和蒸汽压差的减小趋势可以有效抵消气温上升对Epan的促进作用。因此,净辐射和饱和蒸汽压差的变化是西双版纳‘蒸发悖论’现象的主要触发因素。
INTRODUCTION
According to the Sixth Assessment Report released by the Intergovernmental Panel on Climate Change (IPCC), human activities have substantially contributed to global warming through the anthropic emission of greenhouse gases (IPCC 2023). The observed global surface temperature from 2011 to 2020 has increased by 1.1°C since the industrial revolution (IPCC 2023). The increase in the atmospheric CO2 concentration and temperature could also trigger hydrological anomalies, such as floods and droughts (Hu et al. 2022). It is widely accepted that evaporation plays a central role in hydrological cycling, as well as the global surface energy balance. Therefore, the interplay between hydrological cycling (here specified as evaporation) and climatic changes has notable research implications for our changing earth.
Pan evaporation (Epan) is a critical measure of the atmospheric evaporative demand, which is related to climatic conditions (Liu et al. 2010; Roderick et al. 2009a). It could be adopted as a suitable approximation of actual evaporation in humid regions. We could also use Epan variation as a comprehensive index to track the response of hydrological processes to climate change (Liu et al. 2010; Roderick et al. 2009a). Epan is usually adopted as a key parameter in drought monitoring and water resource management. Within the context of climate change, more and more attention has been paid to the change in Epan and its attribution (Yao et al. 2022).
Paradoxically, against the backdrop of rising global temperatures, terrestrial observation results around the world have shown that Epan has been steadily declining since the 1950s (Liu et al. 2011; Roderick and Farquhar 2002; Roderick et al. 2009b). This phenomenon of decreasing pan evaporation along with increasing temperature was first proposed in 1995 (Peterson et al. 1995) and formally defined as the ‘evaporation paradox’ in 2002 (Roderick and Farquhar 2002). The ‘evaporation paradox’ phenomenon has been reported in many studies on regional or global scales. For example, Peterson et al. (1995) found that the average pan evaporation decreased in the USA, the Former Soviet Union (FSU) and Eurasia from 1950 to early 1990. Liu et al. (2004) analyzed pan evaporation data, covering 85 weather stations in China between 1955 and 2000, and they found that pan evaporation decreased at an average rate of 29.3 mm per decade. Limjirakan and Limsakul (2012) studied pan evaporation data from 28 weather stations in Thailand during 1970–2007, and the results showed a steady decreasing trend in the mean annual evaporation despite the mean annual temperature was increasing. In addition, a number of studies have reported the phenomenon of continuous decline in pan evaporation (Fu et al. 2009; Sanchez-Lorenzo et al. 2017; Wang et al. 2017; Wild et al. 2007).
At first glance, these results may seem surprising, since the near-surface air temperature has been rising, and it is widely proposed that warming climate will make the air drier and promote the hydrological cycle, which will lead to increased evaporation in open water bodies, including pan evaporators. This statement holds true only if all other drivers affecting evaporation are assumed to remain constant (Roderick et al. 2009a). However, Epan is affected by various climate variables. In the case of increasing near-surface air temperature and decreasing pan evaporation, other variables are not constant. If the decreasing trend in the vapor pressure deficit, wind speed, solar radiation and other factors largely counteracts the influence of temperature rise, the Epan rate may decrease (Liu et al. 2011). A number of studies have been conducted nationally and internationally to elucidate the specific causes of this phenomenon (Limjirakan and Limsakul 2012; Verma and Jadhav 2008; Yang and Yang 2012). Dimming of solar radiation and/or stilling of wind speed are considered to be the main reasons for the decrease in Epan in different parts of the world (Roderick et al. 2009a, 2009b). However, due to the different geographical locations and environmental conditions in each study area, the driving factors of the ‘evaporation paradox’ phenomenon are different. For example, the air temperature (Ji et al. 2014), relative humidity (Willett et al. 2008) and sunshine duration (Xiong and Zhao 2020) may also contribute to the ‘evaporation paradox’ phenomenon.
Forests play a key role in shaping and regulating the Earth’s climate in the future (Cavaleri et al. 2015), especially tropical rainforests, which have great potential (Nelli et al. 2020). Located along the southwestern border of China, and near the Tropic of Cancer, Xishuangbanna encompasses tall and dense tropical rainforests (China Vegetation Editorial Committee 1980). In order to obtain a clear picture of the characteristics of climate change and evaporation changes in tropical rainforest growing areas over time, we collected monitoring data from the Meteorological Observing Station of the Xishuangbanna Tropical Botanical Garden of the Chinese Academy of Sciences over the past 60 years in this study. There are inevitable uncertainties if relying solely on reanalysis datasets or climate model simulations. Detailed, comprehensive and long-term terrestrial meteorological observation data play a particularly important role in understanding the climate change situation and predicting the future trend in this region.
A series of meteorological monitoring activities has been conducted in the Xishuangbanna Tropical Botanical Garden since 1959 and are still ongoing today. The monitoring data of the XTBG Meteorological Observing Station are different from those stations located in the surrounding urban areas, which are susceptible to interference from surrounding environmental factors, such as cities continuing to develop and expand, with air pollution and heat island effects, and buildings gradually impeding air flow, which may eventually lead to the underestimation of actual pan evaporation values (Roderick et al. 2009a). Therefore, weather stations in urban areas are not very good background weather stations. In contrast, the XTBG Meteorological Observing Station that set up in the Xishuangbanna Tropical Botanical Garden is closer to the tropical rainforest, which can better reflect the close relationship between the tropical rainforest and meteorological changes. The station has been operated under the support of the National Forest Ecosystem Research Station at Xishuangbanna. In addition, the weather station is located in the botanical garden, which is far away from the city. With limited urbanization impacts and better protection, monitoring data of the XTBG Meteorological Observing Station can better reflect background information and highlight regional characteristics.
The pan method has been used as an effective tool to estimate atmospheric evaporation demand for a long time. Regarding the reasons for the decline in pan evaporation, unless there are problems with the pan itself, it is necessary to comprehensively consider the relevant contents of the energy balance. Based on the Penman‒Monteith equation, and integrating the model continuously improved by previous researchers, Rotstayn et al. (2006) derived the PenPan model specifically for pan evaporation calculation in 2006. It is an attractive method to analyze pan evaporation based on physical model. Therefore, in this study, the Penman‒Monteith model and the modified PenPan model applicable to the D20 pan (D20 indicates the type of evaporimeter, the pan is 20 cm in diameter, so it is referred to as D20 pan) were used (Roderick et al. 2009b; Yang and Yang 2012). Epan in the study area was simulated by climate factors such as net radiation (Rn), temperature (Ta), vapor pressure deficit (VPD) and wind speed (u2), and the relationship between pan evaporation decline and the change in meteorological driving factors was analyzed combined with the observations. The analysis of abnormal evaporation changes from the perspective of physical variables could help us better understand the changes in Epan and its dominant climate factors.
MATERIALS AND METHODS
Overview of the study area
The Tropical Rainforest Comprehensive Meteorological Observation Field is located in the Xishuangbanna Tropical Botanical Garden, Menglun Town, Mengla County, Xishuangbanna, Southwest China. The botanical garden is peninsular in shape and has a gourd-like appearance, so it is also referred to as Gourd Island. The geographical coordinates of the XTBG Meteorological Observing Station are 21°55ʹ36.66″ N and 101°15ʹ52.58″ E, and it has an average altitude of 563 m. The meteorological observing station was established in the middle of the garden to carry out real-time monitoring of daily meteorological conditions. The detailed geographical location is shown in Fig. 1.
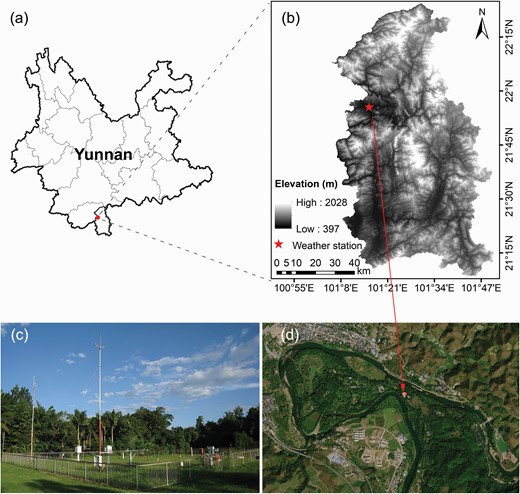
Geographical location (a), elevation information (b), image of the observation site (c) and satellite image (d) of the Tropical Rainforest Comprehensive Meteorological Observation Field in Menglun Town, Mengla County, Xishuangbanna. The image (c) is acquired from the official website of the National Field Observation and Research Station of Forest Ecosystem in Xishuangbanna, Yunnan, http://bnf.cern.ac.cn.
The climate diagram clearly reveals that the average monthly precipitation is 120.9 mm over the past 60 years, with obvious seasonal variations in precipitation throughout the year, and the seasonal distribution is extremely uneven (Fig. 2). The whole year can be divided into dry and rainy seasons, of which the dry season extends from November to April of the next year, and can be subdivided into the foggy season (11–2) and hot-dry season (3–4). The foggy season is mostly filled with dense fog, and the temperature is relatively low (17.5°C), while the hot-dry season has high temperature and little rain (the daytime maximum temperature can reach 38.0°C). The period from May to October is classified as the rainy season, with high temperature and precipitation levels (approximately 83.1% of the annual precipitation). The multiyear monthly average precipitation is almost more than 100 mm during the rainy season (except in October), and July exhibits the largest amount of precipitation at 303.6 mm.

Climate diagram of the Tropical Rainforest Comprehensive Meteorological Observation Field in the Xishuangbanna Tropical Botanical Garden from 1959 to 2021. The abscissa represents month from January to December, and the ordinate represents temperature and precipitation, respectively. The letters on the diagram indicate the following: a. station, b. altitude, c. latitude, d. longitude, e. number of years observed for temperature and precipitation, f. average annual temperature (°C), g. average annual precipitation (mm), h. average monthly maximum temperature (°C), i. average monthly minimum temperature (°C), j. periods of relative drought, when the temperatures are higher than the precipitation (dotted), k. periods of relative wetness, when precipitation is higher than temperature (vertical dotted line), l. average monthly precipitation more than 100 mm (gray filled area), m. curve of mean monthly precipitation (1 division = 20 mm), n. curve of mean monthly temperature (1 division = 10°C, i.e. 10°C = 20 mm).
The annual average temperature is 22.0°C, the temperature decreases during the foggy season, and starts to rise during the hot-dry season, and the temperature reaches the highest value during the rainy season. June is the warmest month with an average temperature of 25.8°C, and January is the coldest month with an average temperature of 16.3°C. The amplitude of annual temperature change is 9.5°C. The changes in temperature and precipitation over 60 years show that the relatively dry periods occur in January, February, March and December, especially in February, which exhibits the least precipitation, with monthly average is only 19.8 mm, and April is the transition period from the dry season to the rainy season, when precipitation begins to increase.
Materials
This dataset is derived from the XTBG Meteorological Observing Station. In this study, we collected conventional meteorological monitoring data from 1959 to 2021 (62 years in total), mainly including air temperature (Ta), precipitation (Pre), relative humidity (RH), sunshine duration (SD) and pan evaporation (Epan, D20). In addition, we downloaded missing radiation data and wind speed data.
Three aspects should be emphasized. First, the sunshine duration mainly records the duration in which the radiation values are greater than the critical value (120 W·m−2), which can partly reflect the amount of solar radiation. The second aspect is that a larger E601 pan was installed at the XTBG Meteorological Observing Station in 1998, and we only obtained E601 pan evaporation data since 2009, which differ from D20 pan evaporation data. The third aspect is that the lack of solar radiation (Rg) and wind speed (WS) data at the XTBG Meteorological Observing Station, so we extracted these data from the China meteorological forcing dataset (1979–2018) of the National Tibetan Plateau Data Center (https://data.tpdc.ac.cn). Then, the files in nc. format were converted into tif. format using Python, and we extracted raster data according to the coordinates of the meteorological stations.
Data processing and analysis
According to the climate situation in Xishuangbanna, the meteorological data are divided into the dry season and rainy season. Based on the obtained meteorological data, the Penman‒Monteith and PenPan models were used to simulate pan evaporation. The long-term variation trend meteorological elements were calculated by linear regression, and the regression coefficient represents the tendency of climate change. The significance test of the trend and the mutation test were conducted by Mann–Kendall method. The periodicity of evaporation was extracted by the wavelet analysis method. We also analyzed the contribution rate of each meteorological factor to pan evaporation, and attempted to find the main influencing factors of pan evaporation in the Xishuangbanna tropical rainforest and explained the ‘evaporation paradox’ phenomenon.
It should be emphasized that although we used the correction coefficient to convert the E601 and D20 pan data from 2009 to 2021, they may not accurately represent the actual D20 pan data, which may cause misestimation, and the existing errors may affect our later judgment on the main impact factors. Therefore, the pan evaporation data up to 2008 were selected for analysis. In addition, together with the fact that wind speed data are only available from 1979 to 2018, and the wind speed is an essential parameter for both pan evaporation estimation models. In summary, in order to investigate the reasons for the decline in pan evaporation, and to determine the main meteorological factors affecting evaporation changes, to ensure the accuracy of the analysis and to eliminate the errors arising from the conversion of D20 and E601 pan data, we only selected the actual measured D20 pan data and related meteorological data from 1979 to 2008, using these data for model simulation and attribution analysis.
Estimation of net radiation and vapor pressure deficit
Due to the lack of complete net radiation and vapor pressure deficit data throughout the monitoring process, we used the available data for extrapolation. Among them, missing monthly solar radiation and net radiation data from 1959 to 2008, which accounted for 79.4% of the total data, and while missing monthly maximum and minimum temperature data from 2009 to 2021, which accounted for 20.6% of the total data.
Because the sunshine duration can reflect the solar radiation to a certain extent, we fitted the downloaded short-term radiation data (Rg) with the measured sunshine duration data. The relationship between these quantities is Rg = 1.1693 × SD, R2 = 0.9578. The results showed a close correlation, which was used to derive the solar radiation value during the study period. However, net radiation data are really needed in the calculation process of pan evaporation, so the solar radiation value also needs to be converted. Radiation monitoring equipment was installed at the XTBG Meteorological Observing Station in 2009, so we conducted linear fitting of solar radiation value and net radiation value from 2009 to 2021, and found that there was a significant linear relationship, which can be expressed as Rn = 0.5205 × Rg, R2 = 0.9843. Therefore, we finally obtained the net radiation value under the complete time series.
It has been shown that if the average air temperature is used to calculate the saturation vapor pressure (e(Tmean)) (Formula 1), it will be underestimated. It is more reasonable to calculate the saturation vapor pressure as the average saturation vapor pressure between the mean daily maximum and minimum temperatures for the period (es) (Formula 2) (Allen et al. 1998). However, we only obtained extreme temperature data from 1959 to 2008, so we calculated the saturation vapor pressure values under two conditions during this period (es(Tmean) and es), fitting the relationship between them, and getting the following relationship: , with R2 = 0.9959. The fitting effect was favorable, and the data from 2009 to 2021 were derived with this equation.
Mann–Kendall trend test and mutation test
The Mann–Kendall nonparametric statistical test (M–K test) is a method recommended by the World Meteorological Organization (WMO) for time series trend analysis of environmental data and is a useful tool for examining trends in hydrometeorological data series (Moradi 2020; Xu 2014). The M–K method can also detect the mutation conditions of data series and quantitatively describe the mutation phenomenon. We used the pymannkendall package in Python to perform the trend test. According to the mutation test equation, assuming that the time series are random and independent, the statistics can be defined as (Ullah et al. 2018):
where E(Sk) and var(Sk) are the mean and variance of the cumulative Sk, respectively. The specific calculation procedure for each parameter and the detailed criteria for discriminating the mutation points can be found in previous studies (Wei 2007; Wu et al. 2021).
Morlet wavelet analysis
Wavelet analysis is widely used in the field of climate research to analyze time series of climate data and identify the change characteristics of climate factors on different time scales. Wavelet real part coefficient contour plots can reflect periodic variations, and the wavelet variance can represent the main oscillation period throughout the evolution process. Through wavelet analysis, we can not only better understand the periodic change in time series, but also predict the periodic change characteristics of future time series (Qi 2021). In this study, wavelet analysis was performed in MATLAB. First, the data were normalized, Morlet Complex Wavelet were selected as the basic wavelet, wavelet transforms were performed of the meteorological factors, after which the wavelet real part coefficients and variances were calculated and contour plots and variance plots were generated.
Penman‒Monteith method
The Penman‒Monteith equation can be used to derive the reference evaporation (Allen et al. 1998). The specific equation is as follows:
where ETo is the reference evaporation (mm·month−1), Rn is the net radiation at the underlying surface (MJ·m−2·month−1) and G is the soil heat flux density (MJ·m−2·month−1). The evaporation data in this study were obtained by pan monitoring, which are hardly influenced by soil heat fluxes, so we set G = 0 in this paper. T is the mean daily air temperature at the 2 m height (°C), u2 is the wind speed at the 2 m height (m·s−1), u10 is the wind speed at the 10 m height (m·s−1), es is the saturation vapor pressure (kPa), ea is the actual vapor pressure (kPa), (es − ea) is the saturation vapor pressure deficit (kPa), Δ is the slope of the saturated vapor pressure curve (kPa·°C−1) and γ is a psychrometric constant (kPa·°C−1).
PenPan model
The PenPan model is a physics-based model, which was originally used to estimate the standard US Class A pan evaporation. However, the D20 pan is widely used in China. Numerous studies have shown that the PenPan model is also a powerful tool for explaining and modeling D20 pan evaporation (Li et al. 2013; Wang et al. 2018a, 2018b). Consequently, a modified PenPan model suitable for D20 pans was chosen in this study. This model can be expressed as follows (Yang and Yang 2012):
where EPenPan, R and EPenPan, A represent the radiative component and the aerodynamic component, respectively. α is the ratio of the effective surface area of heat and vapor transfer, with α = 5 for the D20 pan, λ is the latent heat of vaporization of water (2.45 MJ·kg−1), VPD is the saturation vapor pressure deficit (kPa) and fq(u2) is defined as the water vapor transfer function (kg·m−2·s−1·kPa−1), which can be calculated by using the wind speed at the 2 m height. The remaining indicators have the same meaning as those in Penman‒Monteith method.
In this study, we used the actual Epan data from the XTBG Meteorological Observing Station to calibrate the vapor transfer function , where a and b are calibration parameters (Yang and Yang 2012; Zhao et al. 2017). The equation is as follows:
Attribution of the change in pan evaporation
The partial derivative (PD) method is a mature and effective method for attribution analysis of pan evaporation changes. In the PenPan model, the change in pan evaporation involves the combined influence of several meteorological variables, and PD method can just quantify the contributions of meteorological variables to the EPenPan trend. Since Roderick et al. (2007) used this method to conduct attribution analysis on the change trend of pan evaporation simulated by the PenPan model, this method has been widely used to analyze the mechanism of the ‘evaporation paradox’ phenomenon and to quantitatively analyze the contribution of various meteorological elements (Rn, WS, VPD and Ta) (Wang et al. 2018b; Yang and Yang 2012; Yao et al. 2022; Ye et al. 2022). Specifically, the differentiating equation of EPenPan is as follows:
where EP, R and EP, A denote the radiative and aerodynamic terms, respectively. To further clarify the influences of the meteorological factors on EPenPan, the PD equation can be refined as follows:
Since Δ and es in the VPD equation are calculated from Ta, the Ta contribution can be defined as the sum of the Ta contributions of Δ and es in the radiative and aerodynamic terms, respectively.
According to the above calculations, the variation in EPenPan can be attributed to the influence of the variation in the four meteorological factors. The reliability of the attribution results can be assessed by comparing the results of the PD method to the simulation results of the PenPan model .
RESULTS
Decreasing trend in pan evaporation
We analyzed the interannual trends in Epan for the whole year, dry and rainy seasons from 1959 to 2022 (Fig. 3). Since 2009, the XTBG Meteorological Observing Station only provided E601 pan evaporation data, which differ from the previous D20 pan evaporation data, but the change trend of the rise or fall of each pan evaporation cannot be interfered by another pan. Therefore, the change process of pan evaporation can be divided into two phases, we adopted 2009 as the boundary to obtain the interannual trends in Epan for both pans. The information in Fig. 3a displays that both D20 and E601 showed a decreasing trend at the annual scale. There was a significant decreasing trend from 1959 to 2008, the significance of the M‒K trend test was less than 0.01, and the climatic tendency rate of the D20 pan was −38.63 mm·10a−1, while the E601 pan showed no significant trend. According to the decreasing trend in pan evaporation during the dry season and the rainy season (Fig. 3b), we can see that the decreasing rate during the rainy season was greater, which was −26.29 mm·10a−1 during 1979–2008, and more than twice as much as that during the dry season. The decline rate was higher from 2009 to 2018, especially during the rainy season, and there was a significant reduction of 132.48 mm over the 10-year period. All pan evaporation data indicated that evaporation gradually decreased in the Menglun area of Xishuangbanna during 1959–2018.
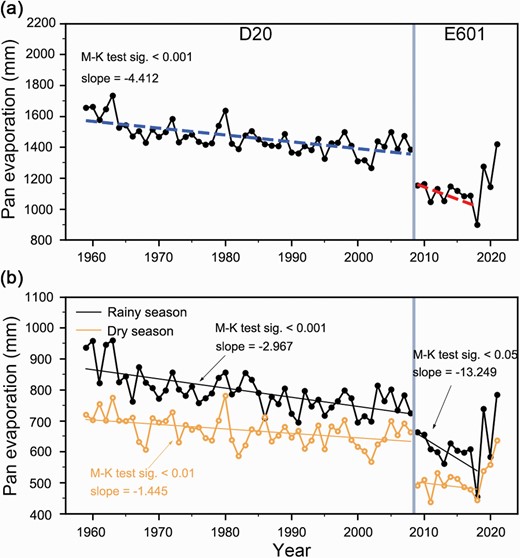
Interannual variation trend of pan evaporation monitored by the Tropical Rainforest Comprehensive Meteorological Observation Field in the Xishuangbanna Tropical Botanical Garden. D20 pan data were obtained from 1959 to 2008, and E601 pan data were obtained from 2009 to 2021, where (a) shows the interannual variation over the whole year, (b) shows the interannual trend over the rainy season and the dry season, the slope in the graph is the regression coefficient, indicating the tendency of climate change. If it is marked with the M–K test, which indicates that it passed the Mann‒Kendall trend test, otherwise, it indicates that the trend is not significant.
The above results clearly indicated that Epan exhibited an obvious downward trend in Xishuangbanna during 1959–2018. In order to observe the interdecadal dynamics of the ‘evaporation paradox’, we conducted anomaly statistical analysis of the relevant data per decade. The interdecadal anomaly variability of the temperature and evaporation on dry season, rainy season and year-round time scales are shown in Fig. 4. Fig. 4a and b clearly showed that there is an apparent opposite trend between the temperature and pan evaporation. During the early 21st century and before, pan evaporation significantly decreased with increasing temperature, and there was an obvious ‘evaporation paradox’ phenomenon in the study area. Thereafter, pan evaporation changed from decreasing to increasing, and the decadal anomaly value changed from −33.24 mm in 2010 to 129.45 mm in 2020, indicating that the ‘evaporation paradox’ phenomenon was absent. Although the change in pan evaporation in Menglun is consistent with that in most parts of the world, and rebounding occurred from 2019 to 2022, the ‘evaporation paradox’ phenomenon cannot be ignored. It remains to be explored which meteorological factors play a key role in the case of continuous temperature rise, and which meteorological factors cause the decrease in evaporation in this region.
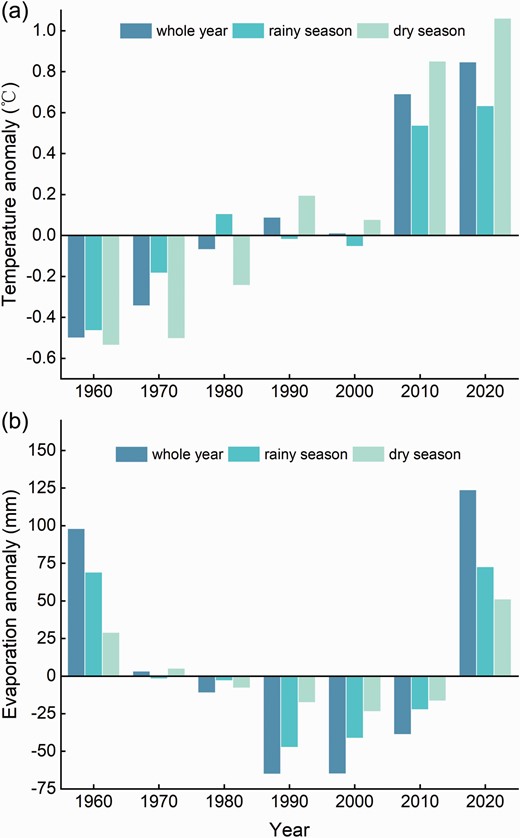
Interdecadal anomaly changes in meteorological factors: (a) temperature and (b) pan evaporation over the seasons (whole year, rainy season and dry season).
Mutation change analysis and periodic properties
The Mann–Kendall test method was applied to detect the mutation variation for the decreasing trends of continuous and complete D20 pan evaporation. The significance test value was 0.05, and the results are shown in Fig. 5. The UF results of Mann–Kendall mutation test revealed that it remained almost below 0 throughout the whole study period, except for 1960 and 1963, which indicates a steady decline in pan evaporation in this time series. The UF and UB curves intersect at a point in 1965, and this point appears in the critical threshold of the 0.05 significance level, demonstrating that it can be regarded as a mutation point, which indicates that mutation change begins to occur, and pan evaporation in Xishuangbanna shifts from increasing to decreasing. The UF curve exceeds the critical line of significance level after 1967, and evaporation significantly decreased during this period.
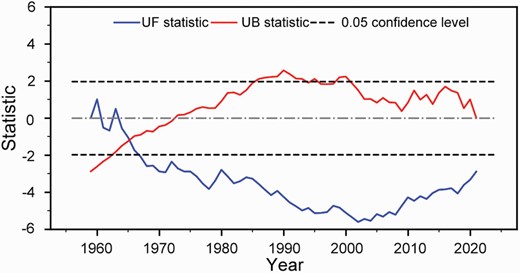
Curve of Mann–Kendall mutation test for D20 pan evaporation.
We used the Morlet wavelet method to analyze the periodicity of pan evaporation. Fig. 6a and b shows a contour map of the real part of the wavelet coefficients and a wavelet variance plot, respectively. In the contour map, if the real part of the wavelet coefficient is positive (corresponding to the red area), then the change in the meteorological factor is in an upward phase during this time period, and similarly, if the real part is negative (corresponding to the blue area), the change in the meteorological factor is in a downward phase during this time period. The wavelet variogram reflects the distribution of the periodic fluctuation energy of meteorological factors on various time scales. The peaks in the variogram represent the primary periods, and the highest crest is defined as the first primary period, followed by the second primary period and so on. The periodicity reflects the change characteristics of meteorological factors over the entire time scale.
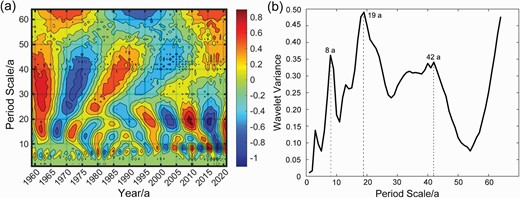
Contour map of the real part of the Morlet wavelet coefficient (a) and wavelet variance (b) of pan evaporation at the Tropical Rainforest Comprehensive Meteorological Observation Field in the Xishuangbanna Tropical Botanical Garden from 1959 to 2021.
As shown in Fig. 6, there is an obvious periodic change in pan evaporation. Overall, there are three primary fluctuation periods. The oscillation period mainly includes 42a, 19a and 8a, where 19a has the strongest oscillation and largest variance among the wavelet coefficient values. Since the maximum value of the wavelet variance determines the maximum period of the periodic oscillation of the climate factors, 19a is the first primary period. By the end of 2021, pan evaporation entered the upward phase among all periods, and the contour maps were not closed. It is expected that the replacement from decreasing to rising will be strengthened during the following period, and it is predicted that the pan evaporation in the study area will show an increasing trend in the future.
Variation trend in the simulated pan evaporation and related meteorological factors
Over the past 60 years, various climatic factors have changed constantly. In order to better understand the changes in pan evaporation driven by these meteorological factors, the Penman‒Monteith model and PenPan model were employed to simulate pan evaporation.
Fig. 7 shows the interannual variation trend of pan evaporation, including the results simulated by the two models and observed by the D20 pan. The results showed that the simulated values and the actual measured value both exhibited significant downward trend. We calculated the correlation between the monthly observed values (Epan) and simulated values (EPenman and EPenPan) (Fig. 8). It can be seen that the simulation effect of PenPan model was better than that of the Penman‒Monteith model, and the calculated values were closer to the observed values (Fig. 8b). However, the Penman‒Monteith model underestimated pan evaporation, which also indicates that the PenPan model is a more reasonable prediction method for Epan.
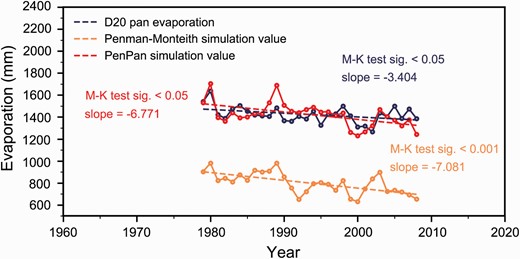
Interannual trends of pan evaporation based on the model-calculated and observed evaporation values. The blue and black circles denote the observed D20 pan evaporation; the red and orange circles denote the evaporation values calculated by the PenPan model and Penman‒Monteith model, respectively.
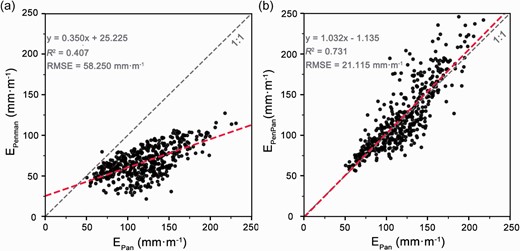
Correlation between the observed pan evaporation (Epan) and calculated evaporation using the Penman‒Monteith (EPenman) (a) and PenPan models (EPenPan) (b), where RMSE is the root mean square error, which measures the deviation between the predicted and real values, the greater the error is, the larger the value.
Evaporation is closely related to a number of meteorological factors. Energy is needed in the evaporation process and is supplied by solar radiation. The amount of evaporation is related to the vapor pressure deficit and wind speed. Changes in the temperature and precipitation can also indirectly cause changes in evaporation. Here, combined with the PenPan model, we examine the interannual fluctuations in climate factors closely related to evaporation, and further explore their influences on evaporation.
Fig. 9 shows the interannual variation trends of the net radiation, temperature, vapor pressure deficit, precipitation and wind speed, indicating that the decreasing trend in the net radiation reached significant levels. The period of 1979–2008 coincided with a downward trend, and the net radiation received by the underlying surface began to increase after 2008. The temperature significantly increased from 1979 to 1991, and reached a relatively stable period between 1991 and 2008, when the warming phenomenon was interrupted, which is consistent with the results of global surface temperature analysis (Trenberth and Fasullo 2013). The saturated vapor pressure deficit reflects the water vapor demand condition of air. During the 30 years from 1979 to 2008, the decreasing trend in the vapor pressure deficit reached a significant level, but the overall changes were little, and the climate tendency rate was only 0.02 kPa·10a−1. The wind speed significantly increases, but the overall wind speed was low, which may impose a limited effect on evaporation. Precipitation fluctuated and increased during this period, but the trend was statistically insignificant.

Historical trends in the meteorological factors closely related to evaporation based on the PenPan model: (a) solar radiation, (b) temperature, (c) vapor pressure deficit, (d) precipitation and (e) wind speed (wind speed data downloaded from the National Tibetan Plateau Scientific Data Center). The gray shaded area denotes the time period from 1979 to 2008. If it is marked with the M–K test, which indicates that it passes the Mann–Kendall trend test, otherwise, it indicates that the trend is not significant.
Attribution analysis of meteorological variables to pan evaporation changes
To illustrate the trends in EPenPan and the relationship between meteorological factor components and EPenPan. The PD attribution method was used to quantify the contribution of the meteorological factors that involved in the PenPan model to EPenPan. The PD attribution results are listed in Table 1. As shown in Table 1, the change rate calculated by the PD attribution method is dEPenPan_PD/dt = −6.565 mm·a−2, which is highly consistent with the change rate simulated by the PenPan model (Formula 8), dEPenPan/dt = −6.771 mm·a−2. This suggests that Formula 8 can accurately simulate the influence of the climate factors on EPenPan.
Attribution analysis of the changes in the annual EPenPan (mm·a−2) in the study area from 1979 to 2008
| VPD* | |||||
|---|---|---|---|---|---|
| −3.183 | 0.149 | 0.367 | −3.899 | −6.565 | −6.771 |
| VPD* | |||||
|---|---|---|---|---|---|
| −3.183 | 0.149 | 0.367 | −3.899 | −6.565 | −6.771 |
Note: Rn, Ta, u2 and VPD in the table represent the net radiation, atmospheric temperature, wind speed and vapor pressure deficit, respectively. The value corresponding to each meteorological factor is the result of PD attribution analysis, which represents the contribution of each meteorological factor to pan evaporation. dEPan_PD/dt is the trend change of pan evaporation based on the PD attribution method, and dEPan/dt is the trend change of simulated pan evaporation.
Fig. 10 shows the statistics of the contribution of Rn, Ta, u2 and VPD. According to the contribution rate of each factor, the driving mechanism of pan evaporation at the XTBG Meteorological Observation Station is different in each season. On the annual scale, the declining trend in VPD and Rn are the dominant factors controlling the declining trend in EPenPan, and their relative contribution rates are 51.31% and 41.89%, respectively. The contribution rates of Ta and u2 are relatively low, especially of Ta, at only 1.97%. The main influencing factors during the rainy and dry seasons are also VPD and Rn, but during the dry season, especially during the hot-dry seasons, there are high temperature and little rain, so the contribution of temperature rises to 14.97%.
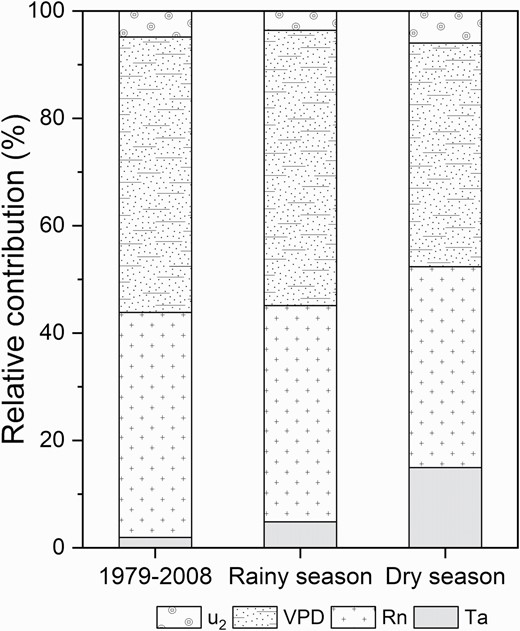
Contribution rate of each meteorological factor to pan evaporation at the Tropical Rainforest Comprehensive Meteorological Observation Field in the Xishuangbanna Tropical Botanical Garden.
DISCUSSION
In this study, pan evaporation data from the XTBG Meteorological Observation Station were used to explain the ‘evaporation paradox’ phenomenon and to predict future changes, through a widely accepted analytical method.
It is found that the simulation results of the PenPan model are closer to the observed values, indicating that this method is more suitable for pan evaporation simulation in this region. In early studies, the Penman‒Monteith method has been commonly used to estimate reference evaporation and indirectly verify the decreasing trend in pan evaporation (Allen et al. 1998; Thomas 2000). Although this method can be used as one of the methods to calculate pan evaporation, the difference in underlying surface may cause calculation errors, which one is low grass cover, and the other is pan (Roderick et al. 2009b). The pan may intercept more radiative energy and increase heat exchange (Linacre 1994), so physical models for open underlying surfaces (Penman‒Monteith) may not be suitable for simulating Epan. On the basis of the Penman‒Monteith equation, the PenPan model was obtained by coupling the radiative component and the aerodynamic component (Linacre 1994; Thom et al. 1981), and the PenPan model was originally used to estimate the US Class A pan. Due to the widespread use of the D20 pan in China, the model was revised and used to simulate D20 pan evaporation. Therefore, the PenPan model is more suitable for simulating pan evaporation in this region. Although the simulations and observations are not completely consistent at the regional scale, these results are generally reasonable and acceptable. Because the station monitoring data represent pan evaporation on a small spatial scale, whereas the model is oriented toward average evaporation on a large scale. The study results are also supported by previous research findings.
To the best of our knowledge, this is the first study to analyze changes in pan evaporation in the Xishuangbanna tropical rainforest region. Our results revealed that pan evaporation at the XTBG Meteorological Observation Station showed a fluctuating downward trend during 1959–2008 and 2009–18. By analyzing continuous observation data from 1979 to 2008, we found that the declines in VPD and Rn in this region were the main factors causing the decrease in pan evaporation.
Net solar radiation is the energy supply factor in the evaporation process, which showed a sharp downward trend during the study period (Fig. 9a). We predicted that the increase in aerosols in Xishuangbanna is the main reason for the decline in solar radiation, which is consistent with previous reports (Liu et al. 2004). Southeast Asian countries adjacent to Yunnan Province, such as Myanmar and Laos, engaging in large-scale spring burning every year. The NASA fire monitoring system shows a shocking phenomenon (https://firms.modaps.eosdis.nasa.gov/map/), with the areas outside the borders around Xishuangbanna almost entirely on fire. The whole sky exhibits a grayish haze during the dry season, which is only ameliorated as the rainy season commences. Previous studies have suggested that the maximum number of spring fires can reach as high as 20 000 in Southeast Asia (Gustafsson et al. 2009). The large amounts of pollutants in the atmosphere lead to a gradual increase in the concentration of suspended particles, which also increases the scattering intensity and reduces the solar radiation reaching the underlying surface (Teng 2020). The water vapor pressure deficit is a dynamic factor that can promote the evaporation process. During the study period, the actual water vapor pressure in air increased with increasing precipitation (Fig. 9d), and the saturation vapor pressure deficit significantly decreased (Fig. 9c). The driving force for evaporation weakened and the pan evaporation showed a decreasing trend.
The phenomenon of pan evaporation decreasing against the background of gradually increasing temperatures has been reported extensively, and various meteorological factors that can affect pan evaporation have been revealed. For example, the study on the Qinghai-Tibet Plateau found that a decreasing trend in pan evaporation from 1979 to 1993, and the wind speed was the primary controlling factor (Yao et al. 2022). A statistical analysis study of pan evaporation data in Southwest China showed that pan evaporation decreased from 1980 to 2012, and the contributions of the net radiation, wind speed, actual water vapor pressure and air temperature were −8.7, −6.4, −1.8 and +3.6 mm·a−2, respectively. It was proposed that the ‘global dimming’ was the main cause, and ‘wind stilling’ was the cause of pan evaporation reduction immediately after global dimming (Wang et al. 2015). In addition, this phenomenon has been observed in waters, where Wang et al. (2010) found that the downward trend in pan evaporation in the Yangtze River basin was caused by a decrease in the net solar radiation and wind speed. Yang and Yang (2012) proposed that the main factors affecting Epan vary greatly in different regions, and they concluded that the wind speed is the main factor in most areas of China, while solar radiation is the main factor in Southwest China. These results are similar to our results, but there are also differences. Xishuangbanna is a well-known calm zone (Jin et al. 2022), and the wind speed is relatively low overall. The average annual wind speed is only 0.59 m·s−1. Therefore, we assumed that the change in wind speed exerts a negligible effect on pan evaporation in this region. However, the dimming phenomenon coincides with global trends. According to the contribution rates of the various meteorological elements (Fig. 10), the reduction in solar radiation and saturated vapor pressure deficit successfully counteracted the positive effect of rising temperature on pan evaporation (the combined contributions of Rn and VPD are 93.20%, 91.57% and 79.05% over the whole year, rainy season and dry season, respectively).
In addition, in recent years, some studies have observed that the ‘evaporation paradox’ phenomenon is disappearing, and the recovery trend, which suggests that it did not continue to decline and even changed to an upward trend, is occurring in certain regions, including Australia, Mexico, Uruguay and other regions (Ruiz-Alvarez et al. 2019; Stephens et al. 2018; Vicente-Serrano et al. 2018). It is no exception in China. To revisit recent trends in pan evaporation in China and analyze their influencing factors, Shen et al. (2022) collected pan evaporation observations covering many Chinese regions from 1988 to 2017, and found that evaporation rebounded at a rate of 2.68 mm·a−2. They proposed that meteorological factors such as the wind speed and solar radiation have periodic properties and that the time scale of decline is not infinite. Therefore, the decline in evaporation caused by the change in meteorological factors such as solar radiation and wind speed will be suspended. This implied that the downward trend in pan evaporation is unlikely to continue.
In order to verify whether the phenomenon also exists in Menglun, a region with widely distributed tropical rainforests, and the changes in this region are consistent with those in other areas. We used the correction coefficient to homogenize the E601 pan evaporation data from 2009 to 2021, and obtained consistent D20 pan evaporation data over the whole study period. The aim of homogenization is to alleviate the effects of changes in instruments. The results showed that the signs of this change are also faintly visible in this study. Wavelet analysis of evaporation (Fig. 6a) and anomaly change (Fig. 4b) showed that evaporation entered an upward phase since 2018, and the wavelet primary periods were not closed, indicating that evaporation is likely to enter an increasing pattern for some time to come. This phenomenon is also revealed by the analysis of the main influencing factors of pan evaporation (Fig. 9). Rn and VPD changed from decreasing to increasing trends after 2008, which provided a higher impetus for the pan evaporation process, while the rise in temperature and wind speed also contributed. Therefore, it is unlikely that the evaporation paradox phenomenon will occur in the future, at least for some time, and the atmospheric evaporation demand will increase with increasing temperature.
Based on the general circulation model, relevant studies have predicted the observed recovery trend in pan evaporation, and proposed that this paradox will not exist in the future, i.e., the atmospheric evaporation demand will continue to increase with regional warming in the future (Wang et al. 2017). In a way, the results of this study are corroborated by this view.
CONCLUSIONS
In this study, we conducted periodicity, trend and mutation change analyses of the complete time series of evaporation data to identify the changes in pan evaporation. The data from the XTBG Meteorological Observation Station, which could reflect the evaporation conditions of the tropical rainforests in Xishuangbanna to a certain extent, showed that an obvious ‘evaporation paradox’ phenomenon in this region, and pan evaporation significantly decreased during 1959–2008 and 2009–2018.
By comparison, it was revealed that the PenPan model attained a higher precision in simulating pan evaporation than the Penman‒Monteith model in the study area, and the calculated results were closer to the actual observed data. Based on the PenPan model, the results of the PD attribution method are highly consistent with the simulation results of the PenPan model, indicating that this method can accurately evaluate the influences of climate factors on Epan. According to the above results, pan evaporation at the XTBG Meteorological Observation Station showed a decreasing trend of −3.404 mm·a−2 during 1979–2008 (sig. < 0.05). Net radiation and vapor pressure deficit were the dominant factors of Epan changes. The decrease in solar radiation and vapor pressure deficit successfully counteracted the effect of rising temperature on Epan. It is worth noting that while pan evaporation is changing over time, other meteorological factors are also changing, and they are interrelated. Pan evaporation exhibits high spatial–temporal dependence. Even if pan evaporation followed a downward trend, the contribution degree of meteorological factors would considerably vary on different time scales, so that the change in pan evaporation during specific time periods and in various regions should be analyzed specifically.
Funding
This study was supported by the National Natural Science Foundation of China (41861023) and Major Program for Basic Research Project of Yunnan Province (202101BC070002).
Acknowledgements
Many thanks to the Xishuangbanna Tropical Botanical Garden of the Chinese Academy of Sciences for providing us with the raw observed meteorological data for analysis, and to the National Tibetan Plateau Data Center for providing us with a downloadable dataset of China meteorological forcing dataset to complement our analysis.
Conflict of interest statement. The authors declare that they have no confict ofinterest.


