


Abstract
A better understanding the mechanisms driving plant biomass allocation in different ecosystems is an important theoretical basis for illustrating the adaptive strategies of plants. To date, the effects of habitat conditions on plant biomass allocation have been widely studied. However, it is less known how plant community traits and functions (PCTF) affect biomass allocation, particularly in alpine grassland ecosystems. In this study, community-weighted means (CWM) were calculated at the community level using five leaf functional traits, and the relationships between PCTF and biomass trade-offs were explored using correlation analysis, variation partitioning analysis and structural equation modeling. We found that the trade-off values were greater than zero in both alpine meadow (AM) and alpine steppe (AS) across the Tibetan Plateau, with different values of 0.203 and 0.088 for AM and AS, respectively. Moreover, the critical factors determining biomass allocation in AS were species richness (SR; scored at 0.69) and leaf dry matter content of CWM (CWMLDMC, scored at 0.42), while in AM, the key factors were leaf dry matter content (CWMLDMC, scored at 0.48) and leaf carbon content of CWM (CWMLC, scored at −0.45). In particular, both CWMLDMC and SR in AS, as well as CWMLDMC and CWMLC in AM were primarily regulated by precipitation. In summary, precipitation tends to drive biomass allocation in alpine grasslands through its effects on PCTF, hence highlighting the importance of PCTF in regulating plant biomass allocation strategies along precipitation gradients.
摘要
了解在不同生态系统中植物生物量分配的调控机制是阐明植物适应性策略的重要理论基础。目前,虽然生境条件对植物生物量分配的影响已被广泛研究,但对植物群落性状和功能(plant community traits and functions, PCTF)如何调控生物量分配,特别是在高寒草地生态系统中的研究却较少。本研究计算了在群落水平上的5种叶片功能性状的群落加权平均值(community-weighted means, CWM),并利用相关分析、方差分解分析和结构方程模型探讨了PCTF与生物量权衡之间的关系。研究结果发现,高寒 草甸(alpine meadow,AM)和高寒草原(alpine steppe, AS)的权衡值都大于零,但两者存在显著差异,AM的权衡值(0.203)明显高于AS (0.088)。此外,决定AS生物量分配的关键因素是物种丰富度(0.69)和叶片干物质含量(CWMLDMC, 0.42),而在AM中,关键因素是叶片干物质含量(CWMLDMC, 0.48)和叶片碳含量(CWMLC, −0.45)。值得注意的是,无论AS中的CWMLDMC和物种丰富度,还是AM中的CWMLDMC和CWMLC都主要受气候因素中的降水调节。总而言之,降水往往通过对PCTF的影响来调控高寒草地的生物量分配,因此强调了PCTF在调节降水梯度上植物生物量分配策略的重要性。
INTRODUCTION
Terrestrial ecosystems cover less than one-third of the Earth’s surface, yet the carbon in terrestrial plant biomass already accounts for around 70% of the carbon in the atmosphere (Houghton 2007). In particular, aboveground biomass (AGB) and belowground biomass (BGB) act as major inputs to the soil carbon pool (Sun et al. 2013). Understanding biomass allocation patterns allows for the assessment of biomass distribution in terrestrial ecosystems and an understanding of how vegetation growth strategies respond to environmental conditions (Martin-Guay et al. 2019; Yang et al. 2010; Yue et al. 2021). Therefore, plant biomass allocation patterns are important process of global carbon cycling and the functioning of terrestrial ecosystems (Lie et al. 2018).
The ratio of root-to-shoot (R/S) is widely accepted as a way to quantify biomass allocation, and many studies have been conducted on it (Reich et al. 2004; Zhou et al. 2012). In contrast, the trade-off between AGB and BGB reflects plants’ responses and adaptation strategies to environmental stresses directly (Roa-Fuentes et al. 2012). Two commonly used patterns for exploring biomass allocation are allometric and isometric. Many studies generally support the predictions of optimal partitioning theory, which states that plants allocate more biomass to roots when water or nutrients are limiting, and more to shoots when light is limiting (Davidson 1969; Hunt and Burnett 1973). Isometric partitioning in plants is the reliance of plants on their homeostasis to respond to their environment, resulting in AGB and BGB scaling in an isometric manner (Enquist and Niklas 2002; Niklas 2005). Several studies have found that individual-level allocation in alpine grassland ecosystems on the Tibetan Plateau (TP) follows anisotropic growth relationships (Wang et al. 2010). However, at the community level, AGB and BGB allocation follows the isometric hypothesis (McCarthy and Enquist 2007; Yang et al. 2009).
A growing number of studies have focused on the effects of various environmental factors, such as precipitation gradients (Li et al. 2019; Yang and Luo 2011; Zhou et al. 2009), temperature (Chai et al. 2021; Lin et al. 2010; Zhou et al. 2012), soil properties (Chai et al. 2021; Li et al. 2019, 2021) and others (Mao et al. 2012; Xu et al. 2020), on plant biomass allocation. However, there is a lack of research on the effects of plant community traits and functions (PCTF) on biomass allocation, especially at the community scale. Trait-based research methods and the importance of functional traits as characteristics of community ecology have received considerable attention from ecologists (Ackerly and Cornwell 2007; He et al. 2023; Jiang and Jin 2021; Lavorel and Garnier 2002). Plant traits are directly related to species adaptations and are quantitative descriptors of a species’ ecological niche, reflecting how plants vary in their ecological strategies for growth, resource use and response to the environment (Weiner 2004; Westoby and Wright 2006; Wu and Du 2007). Considerable evidence suggests that there is a covariance between functional traits and biomass allocation, and this interaction is an important mechanism for quantifying and generalizing plant trade-off strategies and their patterns in fluctuating habitats (Chen and Xu 2014; Wright et al. 2004). For example, the leaf size and specific leaf area decline along gradients of decreasing moisture and/or nutrient availability (Ackerly et al. 2002). Additionally, according to the ‘mass ratio hypothesis’ (Grime 1998), the functional characteristics of the dominant species also play a major role in determining how plant biomass allocation responds to environmental conditions (Garnier et al. 2004). Currently, community-weighted means (CWM) are widely used to study the linkages of environmental factors with plant community productivity and ecosystem stability (Díaz and Cabido 2001; Miao et al. 2022; Ricotta and Moretti 2011). Specifically, recent studies have shown that plant traits in forest ecosystems strongly affect AGB (Ali et al. 2017), and community biomass allocation patterns (De Battisti et al. 2020; Yan et al. 2016). Furthermore, plant traits regulate roots versus shoots allocation of a shrub than soil and climate factors (Chai et al. 2021). Consequently, community functional traits might explain biomass trade-offs deeply (Májeková et al. 2016; Polley et al. 2013).
Grasslands are one of the most widely distributed ecosystem types on land, covering approximately 40% of the Earth’s land area (Scurlock et al. 2002; Sun et al. 2022). It is important to understand their biomass allocation patterns and how they relate to environmental factors in order to assess their carbon sink function and predict how grassland ecosystems will respond to climate dynamics (Garnett et al. 2001). The TP, known as the ‘third pole’ of the Earth, has unique physical geography, and is sensitive to climate change (Klein et al. 2004). The alpine meadow (AM) is mainly located in the eastern TP with wetter and relatively warm environments, while the alpine steppe (AS) is primarily situated in the central and northern TP and is dominated by drought and colder habitat (Wang et al. 2022b). Under these harsh and fickle habitats where soil water and nutrient availability are limited (Sun et al. 2013), plants have to alter the proportions of biomass allocated to roots and shoots in order to interpret stressful environments (Song et al. 2006). As mentioned above, plant functional traits, such as leaf carbon content, leaf nitrogen content, leaf phosphorus content and leaf dry matter content, which vary with habitat for completing their life cycles. Thus, revealing the underlying plant physiological and ecological processes behind biomass allocation in alpine grasslands is important for illustrating the survival strategies of alpine plants.
Here, we measured leaf functional traits at 111 sample sites in two alpine grassland types (AM and AS) across the TP alpine grasslands, and quantified trade-offs between AGB and BGB. Our objectives of this study are as follows: (i) to analyze the difference of trade-off in biomass allocation between AS and AM; (ii) to explore the PCTF factors associated with trade-offs between AGB and BGB and (iii) to identify the driving mechanisms of trade-offs in alpine grassland types.
MATERIALS AND METHODS
Study area
Our sampling sites were located on the TP (26°00ʹ–39°47ʹ N, 73°19ʹ–104°47ʹ E) (Fig. 1a). The annual mean precipitation (AMP) decreased from the southeast (~1000 mm) to the northwest (~100 mm), and the annual mean temperature (AMT) ranged from −5 to 20 °C (Sun et al. 2019). We collected samples from July to September along an approximately 5000 km transect covering the main grassland types over the plateau, with 3030–5000 m a.s.l. (Zhou et al. 2021). AM and AS are the main grassland ecosystem types with the harsh and fragile environments across the TP (Sun et al. 2013), and the dominant species of AM are Kobresia humilis, Poa crymophila Keng and Polygonum vivipurum, and the main associated species are Elymus nutans, Leontopodium leontopodioides and Medicago ruthenica. In AS, the main dominant species are Stipa purpurea and Carex moorcroftii, and the main associated species are L. leontopodioides, Oxytropis alpina and Artemisia spp.
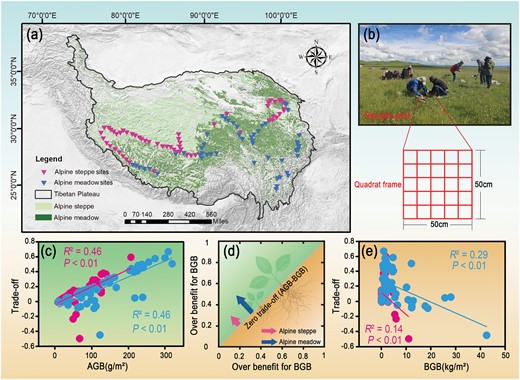
The grassland types (a) and sampling information (b) in the study area. The illustration of the trade-off between AGB and BGB in AM and AS (d). Relationships between AGB and trade-off (c), BGB and trade-off (e) in alpine grasslands.
Plant measurement
We collected 111 samples sites in 2015 (58 in AS and 53 in AM; Fig. 1). We harvested all standing plants in three quadrats (50 cm × 50 cm) to measure AGB. In addition, we collected 999 soil samples (0–10, 10–20 and 20–30 cm; 3 samples per site), and the sum of the root biomass at each depth was treated as BGB. During sampling, we counted the number and height (H) of each species. Species richness (SR) was defined as the number of species (Wang et al. 2021b). The biomass samples were dried at 65 °C to a constant mass and weighed to the nearest 0.01 g in the laboratory. Plant leaves were ground and sieved with a 0.25 mm mesh sieve to obtain dried leaf material. The total carbon content (LC) and total leaf nitrogen content (LN) of plant leaves were determined using a Vario MICRO Cube elemental analyzer (Elementar, Hanau, Germany) (Wang et al. 2021a). The molybdenum antimony anti-colorimetric method was used to determine the phosphorus content of leaves (LP) (Zhou et al. 2020). Leaf dry matter content (LDMC) was calculated using the ratio of leaf dry weight to saturated fresh weight (Ren et al. 2015).
Then, we quantified the functional diversity of the study community using CWM (He et al. 2019; Sun et al. 2023; Xu et al. 2018), which was calculated for each of the five plant functional traits as follows:
where pi is the relative abundance of species i in the community and traiti represents the trait value of species i (Lavorel et al. 2007).
Climate data
We downloaded the daily precipitation and temperature data for 2015 from the China Meteorological Data Network (http://data.cma.cn/), and used Anusplin 4.2 software (Centre for Resource and 220 Environmental Studies, Australian National University, Canberra) to spatially interpolate the AMP and AMT with a resolution of 1 km. Then, the climate data of 111 sample sites in the study area were extracted from the database using ArcGIS 10.6 software (ESRI, Redlands, USA).
Data analysis
Data were counted and compared using Excel 2019, and Pearson correlation and one-way ANOVA tests were performed using SPSS (IBM SPSS Statistics 25) to test the data, P value of less than 0.05 is considered to be statistically significant. ArcGIS (ESR10.6) was used to create a schematic map of the study area, and SigmaPlot 10.0 (Systat Software, Inc., Chicago, IL, USA) was used for correlation analysis. Variation partitioning analysis was performed via the ‘vegan’ package (R Core Development Team, R Foundation for Statistical Computing, Vienna, Austria). Structural equation modeling (SEM) was performed using Amos Graphics (IBM SPSS Amos 24.0) to explore the driving mechanisms of biomass allocation and the factors influencing trade-offs.
To determine the trade-off between AGB and BGB for the alpine grasslands (AS and AM), we used the root mean square error (Sun et al. 2018). Given observations of an individual object A, the magnitude of benefit for object A (BA) is calculated as (Bradford and D’Amato 2012):
where Ai, AMin and AMax are the observed, lowest and highest values of either AGB or BGB, respectively. In addition to this, individual benefits range from 0 to 1 and can be conceptualized as the proportion of possible benefits in objective A that are realized in a given management scenario (Sun et al. 2018). This calculation quantifies the magnitude of the trade-off between AGB and BGB.
SEM is a commonly used multivariate analysis technique that assumes there are direct and indirect causal effects. The standard estimate results express the effects of factors on trade-offs, which were generated using Amos software (24, Amos Development Corporation, Crawfordville, FL, USA).
RESULTS
The size of biomass trade-offs in AM and AS
The trade-off between AGB and BGB in AS (0.088) was lower than in AM (0.203, Fig. 1d; Table 1). There were also significant positive relationships between AGB and the trade-off in both AM (R2 = 0.46, P < 0.01) and AS (R2 = 0.46, P < 0.01, Fig. 1c). In contrast, significant negative correlations were observed between BGB and the trade-off in both AM (R2 = 0.29, P < 0.01) and AS (R2 = 0.14, P < 0.01, Fig. 1e).
The variables (AMP, AMT, AGB, BGB, SR, community-weighted mean value of leaf carbon content [CWMLC], community-weighted mean value of leaf nitrogen content [CWMLN], community-weighted mean value of leaf phosphorus content [CWMLP], community-weighted mean value of leaf dry matter content [CWMLDMC] and community-weighted mean value of leaf height [CWMH]) in AS and AM
| Grassland type | Values | AMP (mm) | AMT (°C) | AGB (g/m2) | BGB (kg/m2) | Trade-off | SR | CWMLC | CWMLN | CWMLP | CWMLDMC | CWMH |
|---|---|---|---|---|---|---|---|---|---|---|---|---|
| AS | Min | 153.75 | −2.37 | 7.56 | 0.01 | −0.50 | 2.00 | 9.33 | 3.58 | 0.22 | 3.56 | 1.82 |
| Mean | 238.20 | 3.10 | 52.13 | 1.11 | 0.09 | 6.91 | 24.53 | 11.28 | 1.13 | 26.90 | 6.64 | |
| Max | 386.85 | 5.29 | 206.39 | 11.03 | 0.59 | 26.00 | 42.27 | 20.42 | 3.94 | 71.13 | 17.20 | |
| Std | 82.82 | 1.42 | 43.49 | 1.92 | 0.15 | 4.74 | 8.66 | 4.19 | 0.66 | 17.37 | 3.43 | |
| AM | Min | 175.51 | −1.68 | 9.17 | 0.20 | −0.45 | 3.00 | 6.96 | 2.10 | 0.18 | 4.44 | 0.71 |
| Mean | 457.81 | 2.64 | 138.31 | 5.81 | 0.20 | 11.26 | 18.87 | 7.81 | 0.66 | 56.66 | 6.35 | |
| Max | 860.00 | 6.85 | 318.48 | 42.53 | 0.67 | 22.00 | 35.67 | 15.67 | 1.49 | 157.35 | 31.97 | |
| Std | 202.86 | 2.03 | 81.12 | 8.15 | 0.22 | 4.77 | 6.95 | 3.13 | 0.32 | 32.46 | 6.40 |
The Min, Mean, Max and Std are the minimum, average, maximum and standard deviation values, respectively.
Effects of climate and community characteristics on biomass trade-off in alpine grasslands
Significant positive relationships were observed between AMP and trade-offs in AM (R2 = 0.21, P < 0.01, Fig. 2a) and AS (R2 = 0.15, P < 0.01, Fig. 2a). Meanwhile, the biomass trade-off in AM was significantly affected by AMT (R2 = 0.10, P < 0.01, Fig. 2b), however, there was no significant correlation between AMT and the biomass trade-off in AS (Fig. 2b).
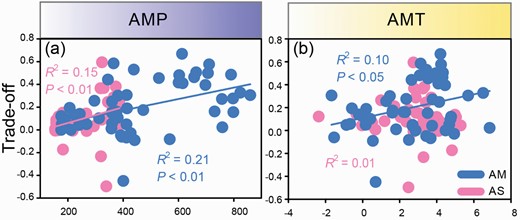
Relationships between AMP and biomass trade-off (a), AMT and biomass trade-off (b) in AM and AS.
In AM, the trade-off was significantly positively influenced by SR (R2 = 0.33, P < 0.01, Fig. 3a) and CMWLDMC (R2 = 0.21, P < 0.01, Fig. 3e), and it was also significantly negatively affected by CMWLC (R2 = 0.31, P < 0.01, Fig. 3b), CMWLN (R2 = 0.30, P < 0.01, Fig. 3c) and CMWLP (R2 = 0.18, P < 0.01, Fig. 3d). Similarly, in AS, the trade-off was significantly positively influenced by SR (R2 = 0.39, P < 0.01, Fig. 3a) and CMWLDMC (R2 = 0.18, P < 0.01, Fig. 3e), and significantly negatively affected by CMWLC (R2 = 0.17, P < 0.01, Fig. 3b), CMWLN (R2 = 0.17, P < 0.01, Fig. 3c) and CMWLP (R2 = 0.09, P < 0.05, Fig. 3d). However, H had not effect on the trade-off in either grassland types.
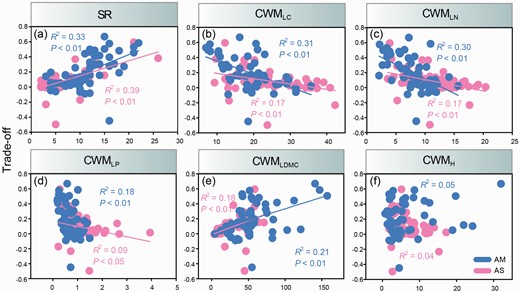
Relationships between SR and trade-off (a), CMWLC and trade-off (b), CMWLN and trade-off (c), CMWLP and trade-off (d), CMWLDMC and trade-off (e), CMWH and trade-off (f) across two different alpine grassland types. CWMLC = community-weighted mean value of leaf carbon content, CWMLN = community-weighted mean value of leaf nitrogen content, CWMLP = community-weighted mean value of leaf phosphorus content, CWMLDMC = community-weighted mean value of leaf dry matter content, CWMH = community-weighted mean value of plant height.
The driving process of biomass trade-offs in different types of grasslands
AMP showed more significant relationships with the community traits (SR, CWMLC, CWMLN, CWMLP and CWMLDMC), while AMT did not show any relationships (Fig. 4). In particular, AMP had a positive effect on SR (R2 = 0.29, P < 0.01, Fig. 4a) and CWMLDMC (R2 = 0.11, P < 0.05, Fig. 4i), while it showed a negative effect on CWMLC (R2 = 0.12, P < 0.01, Fig. 4c) in the AM. In the steppe, AMP also had a significantly positive effect on SR (R2 = 0.40, P < 0.01, Fig. 4a) and CWMLDMC (R2 = 0.52, P < 0.01, Fig. 4i), while it exhibited a remarkably negative effect on CWMLC (R2 = 0.10, P < 0.05, Fig. 4c), CWMLN (R2 = 0.16, P < 0.05, Fig. 4e) and CWMLP (R2 = 0.09, P < 0.05, Fig. 4g).
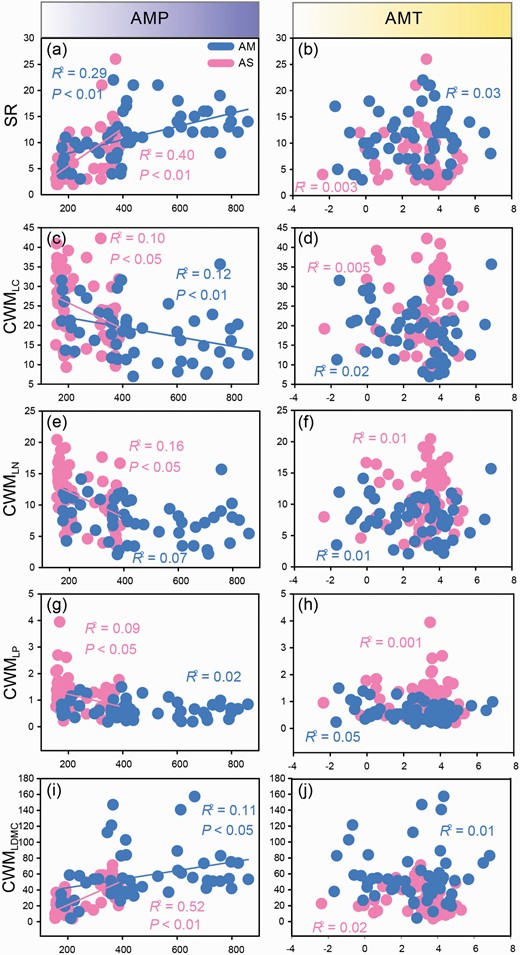
Relationships between AMP and SR (a), AMT and SR (b), AMP and CMWLC (c), AMT and CMWLC (d), AMP and CMWLN (e), AMT and CMWLN (f), AMP and CMWLP (g), AMT and CMWLP (h), AMP and CMWLDMC (i) and AMT and CMWLDMC (j) across two different alpine grassland types. CWMLC = community-weighted mean value of leaf carbon content, CWMLN = community-weighted mean value of leaf nitrogen content, CWMLP = community-weighted mean value of leaf phosphorus content, CWMLDMC = community-weighted mean value of leaf dry matter content.
Variation partitioning analysis demonstrated that, PCTF (SR, CWMLC, CWMLN, CWMLP, CWMLDMC and CWMH) explained a greater proportion of trade-offs than climate variables (AMP and AMT) in AS (37.1% vs. 11.6%, Fig. 5a) and AM (55.4% vs. 20.7%, Fig. 5b), respectively.
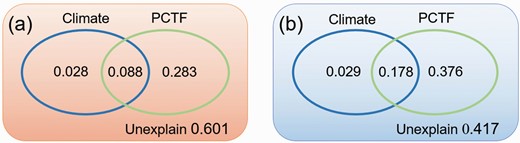
Relative contribution of PCTF and climate factors to the trade-off in AS (a) and AM (b).
According to the SEM, in AS, AMP had a significant positive effect on SR and CWMLDMC, with standard total effects of 0.63 and 0.72, respectively (Fig. 6a). The trade-off in AS was determined by SR, CWMLDMC and AMP, with standard total effect values of 0.69, 0.42 and 0.38, respectively (Fig. 6a). In AM, the trade-off was governed by CWMLDMC, CWMLC and AMT, with standard total effect values of 0.48, −0.45 and 0.18, respectively (Fig. 6b). Apparently, AMP indirectly affected the trade-off in AM through SR, CWMLC and CWMLDMC (Fig. 7).
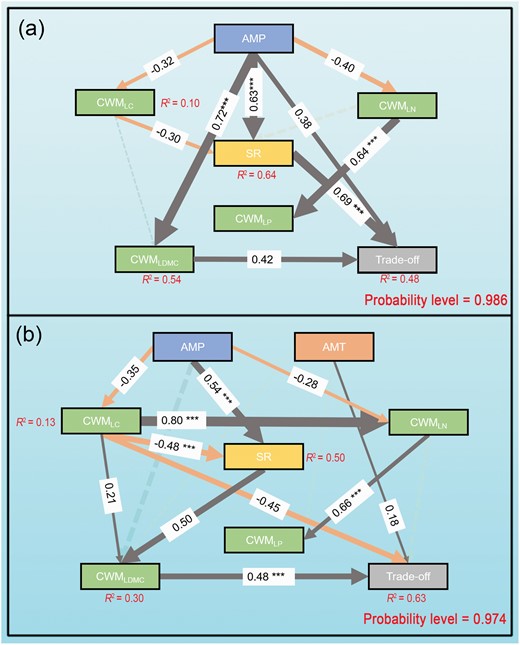
Direct and indirect effects of PCTF on trade-offs in AS (a) and AM (b). SEM investigated the intensity of the response of trade-offs to each factor for both grassland types. Single-headed arrows indicate the hypothesized direction of causation. Influence of PCTF on trade-offs. The dashed line, solid line and thickness of the solid arrows represent the indirect, direct path and magnitude of the standardized SEM coefficients, respectively. The standardized coefficients are listed on each significant path. CWMLC = community-weighted mean value of leaf carbon content, CWMLN = community-weighted mean value of leaf nitrogen content, CWMLP = community-weighted mean value of leaf phosphorus content, CWMLDMC = community-weighted mean value of leaf dry matter content. ***Show the significant correlations at 0.001 levels.
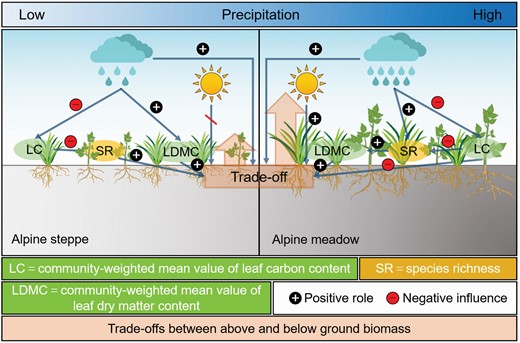
Summary conceptual model of the regulation of PCTF along the precipitation gradient in response to biomass trade-offs.
DISCUSSION
Precipitation regulates the biomass trade-offs in alpine grasslands
Our results indicate that in both AS and AM, the biomass trade-off is in the direction of AGB, with higher trade-off values for AM than for AS (Fig. 1d). Additionally, precipitation appears to be a main factor influencing the trade-off patterns for AS and AM (Fig. 2). It is consistent with the optimal allocation hypothesis, suggesting plants will develop larger root systems and allocate more resources to leaves when underground (soil) and aboveground (light) resources are limited, respectively (Sun and Wang 2016; Yang et al. 2010). Our results support this hypothesis that increase in precipitation leads to increasing water availability, causing plants to reduce root mass in favor of acquiring more light (McCarthy and Enquist 2007). Previous studies have also found that AGB increases but BGB decreases with the increase of annual precipitation (Li et al. 2011; Wang et al. 2014; Zhou et al. 2009). In addition, some research suggests that plants tend to reduce the subsurface input of biomass with the increasing in precipitation (Wang et al. 2010).
There is still some debate about how biomass will be allocated under the background of climate change. For example, the indistinctive relationship of R/S with AMT and AMP in the different grassland types (from temperate to alpine grasslands), northern China (Yang et al. 2010). Similarly, precipitation plays a weak role in regulating biomass allocation in AM and AS (Sun and Wang 2016). In contrast, more researchers reported that the R/S decreased with increasing precipitation (Cairns et al. 1997; Mokany et al. 2006; Roa-Fuentes et al. 2012; Schenk and Jackson 2002; Wang et al. 2003), supporting our results. The decreasing trend in the R/S likely resulted from changes in the relative importance of limiting resources (e.g. water, light and nutrients) along the precipitation gradient (Tilman 1988; Vinton and Burke 1997). Therefore, the water requirement for plant growth decreased with increasing water availability, which shaped the aboveground part growth greater than the belowground part.
PCTF mediates the trade-offs in alpine grasslands
PCTF had a larger effect on trade-offs than climate factors. The effect of community traits on biomass trade-offs may be related to the distribution of plant photosynthetic products which changes with the survival, growth and reproduction of plants. As a matter of fact, the allocation of resources among different parts of the plant is often in conflict due to the available limited photosynthetic products (Ogden 1974). Therefore, PCTF represents plant strategies which regulating the trade-off between the rapid acquisition of resources and conservation of resources (Díaz et al. 2004; He et al. 2020). Furthermore, their traits have the strong impact on ecosystem function at a given time (called ‘immediate’ effects) (Grime 1998). The phenomenon plants to resolve conflicts over resource allocation and achieve optimal biomass trade-off patterns.
PCTF plays a role in regulating the trade-offs, but there have different driving mechanisms of trade-offs in AM and AS. In AS, the trade-off is also positively influenced by CWMLDMC, and the accumulation of LDMC can lead to increase in AGB. Furthermore, we found that the trade-off is mainly positively influenced by SR, increased SR leads to greater differences among species ecological niches, which can influence fluctuations in community biomass (Chen et al. 2021; Valencia et al. 2015; Zuo et al. 2012). The result is consistent with previous findings in Eurasia and the TP (Bai et al. 2007; Ma et al. 2010; Wang et al. 2013).
In AM, trade-offs are mainly controlled by the negative effect of CWMLC and the positive effect of CWMLDMC (Fig. 6b). Specifically, in terms of negative effects of CWMLC on trade-offs, CWMLC is a representative functional trait i.e. highly associated with photosynthesis and trade-offs in resource allocation and utilization (Fang et al. 2001). CWMLC exerts a suppressive effect on plant biomass trade-offs, likely regulating plant growth and avoiding wasting resources (Sun et al. 2019). In the long run, plants store nutrients to adapt to cold TP environmental conditions and continue to provide material and energy for the next stage of reproductive growth (Gao et al. 2016). In terms of positive effects of CWMLDMC on trade-offs, SR influences the trade-offs through CWMLDMC, higher species diversity could stabilize the LDMC of community in AM (Hector et al. 2010; Loreau et al. 2001; Tilman et al. 2014). Furthermore, the positive effects are observed in both AS and AM, with relatively close values of 0.42 and 0.48 (Fig. 6), which indicates that LDMC is not affected by the difference of nutrient availability and competition in the different grassland types (Ryser 1996). Thus, the leaf dry materials content is an important determinant within PCTF that regulates community productivity (Hou et al. 2022).
Linkages of precipitation with PCTF
It is noted that, precipitation dominates the changes in PCTF (Fig. 2). Specifically, plants have evolved different mechanisms of water utilization during their long-term habitat adaptation (Gellesch et al. 2015). Numerous reports have demonstrated that precipitation causes changes in the dominant species with the different functional attributes, which in turn affects community SR (Liu et al. 2016; Zhang et al. 2020; Zheng et al. 2021). The evidence from the local (Grossiord et al. 2016), regional (Flombaum and Sala 2008; Shi et al. 2014; Yang et al. 2010) and global-scale (Siepielski et al. 2017) studies of grasslands also confirms our opinion. Precipitation increases resource abundance, contributing significantly to the direct and indirect positive relationships between plant abundance and productivity (Wang et al. 2022a). Precipitation alters soil water effectiveness and enhances the dynamics of soil nutrient transformation and cycling, which regulates SR (Hawkins et al. 2003; Wu et al. 2021). The high SR increases the accumulation of organic matter via increasing soil microbial diversity and activities and suppressing carbon losses (Lange et al. 2015). Thus, the higher organic matter accumulation have the positive feedback on productivity by increasing soil water holding capacity and maintaining soil fertility (Tiessen et al. 1994).
CONCLUSIONS
We found the significant differences of the patterns and mechanisms of biomass trade-offs between AM and AS, and revealed that two grassland types tend to allocate more biomass to the aboveground. We speculated the findings may be related to the adaptation mechanisms of plants. Specifically, the plant community tends to allocate more biomass to the aboveground in AM compared with AS. Moreover, we also observed that SR and CWMLDMC were the main factors mediating the biomass allocation in AS, while the allocated pattern was dominated by CWMLDMC and CWMLC in AM. Overall, our findings suggest that the trade-off pattern of biomass is not only determined by PCTF, but also regulated by precipitation regimes, providing new insights into the self-regulatory mechanisms of plants along resource gradients on the regional scale.
Funding
Funding was provided by the National Science Foundation of China (41871040), the Second Tibetan Plateau Scientific Expedition and Research (2019QZKK0405) and Joint Research Project of Three-River-Resource National Park funded by the Chinese Academy of Sciences and Qinghai Provincial People's Government (LHZX-2020-08).
Acknowledgements
We thank Meng-Qi Zhang, Ruo-Wei Li, Qi Mi, Tian-Yuan Liu, Jin-Tao Zhang, Yang Li, Yu-Chuan He, Xiang-Yu Lan, Jiang-Hang Wu, Ye-Di Wang, Ma-Zheng Lin, Huang-Yu Huo, Chen Zhang, Ai-Ping Huang and Yun-Hui Li for their assistance during plant cultivation and harvesting. We are grateful to the Associate Editor and one anonymous referee for providing valuable comments.
Conflict of interest statement. The authors declare that they have no conflict of interest.


