


Abstract
Broussonetia papyrifera is an important native tree species in China with strong adaptability, wide distribution and economic importance. Climate change is considered as the main threat to ecological processes and global biodiversity. Predicting the potential geographical distribution of B. papyrifera in future climate change scenarios will provide a scientific basis for ecological restoration in China. Principal component analysis and Pearson correlation analysis were conducted to select the environmental variables. The distribution and changes in the potential suitable area for B. papyrifera were predicted using the maximum entropy model and the CIMP6 dataset from 2041 to 2060. The current highly suitable areas for B. papyrifera were mainly located in Guangdong (5.60 × 10⁴ km2), Guangxi (4.39 × 10⁴ km2), Taiwan (2.54 × 10⁴ km2) and Hainan (2.17 × 10⁴ km2). The mean temperature of the coldest quarter (11.54–27.11 °C), precipitation of the driest quarter (51.48–818.40 mm) and precipitation of the wettest quarter (665.51–2302.60 mm) were the main factors limiting the suitable areas for B. papyrifera. The multi-modal average of the highly and the total suitable areas for B. papyrifera were 111.42 × 10⁴ and 349.11 × 10⁴ km2 in the SSP5-8.5 scenario, while those in the SSP1-2.6 scenario were 87.50 × 10⁴ and 328.29 × 10⁴ km2, respectively. The gained suitable areas for B. papyrifera will expand to the western and northern China in the future scenarios. The multi-model averaging results showed that the potential available planting area was 212.66 × 10⁴ and 229.32 × 10⁴ km2 in the SSP1-2.6 and SSP5-8.5 scenarios, respectively, when the suitable area within the farmland range was excluded.
摘要
构树(Broussonetia papyrifera)具有适应性强、分布广泛、经济价值高等特点,是中国重要的乡土树种。气候变化被认为是对生态过程和全球生物多样性的主要威胁。开展气候变化情境下构树的潜在地理分布研究将为我国的生态恢复提供科学依据。本研究主要采用主成分分析法(PCA)和皮尔逊相关性分析法筛选环境变量。其次,利用最大熵模型(MaxEnt)和CIMP6数据集预测了2041–2060年构树潜在适宜区的分布和变化。研究结果表明,当前构树的高适宜区主要位于广东(5.60 × 10⁴ km2)、广西(4.39 × 10⁴ km2)、台湾(2.54 × 10⁴ km2)和海南(2.17 × 10⁴ km2)等省份。影响构树适宜区分布的主要环境因子为最冷季均温(11.54–27.11 °C)、最干季降水量(51.48–818.40 mm)和最湿季降水量(665.51–2302.60 mm)。未来2041–2060年期间,构树高适宜区和总适宜区的多模式平均值在SSP5-8.5情景下分别为111.42 × 10⁴ km2和349.11 × 10⁴ km2,而在SSP1-2.6情景下为87.50 × 10⁴ km2和328.29 × 10⁴ km2。在未来气候变化情景下,构树适宜区分布将向我国西部和北部地区延伸。此外,除去农田范围内的构树适宜区分布,多模型平均结果显示,构树潜在可种植面积在SSP1-2.6和SSP5-8.5情景下分别为212.66 × 10⁴ km2和229.32 × 10⁴ km2。
INTRODUCTION
Global climate change has attracted significant attention because of its important impact on geographical species distributions worldwide (Fortunel et al. 2014; Scheper et al. 2013). Over the past century, the global climate has shown an obvious warming trend caused by human activities and natural factors (Zhou et al. 2021). Average global land and sea temperatures have risen by 0.89 °C since the 20th century, and these increases are forecasted to continue rising (IPCC 2013). Such a dramatic change is considered to be the main threat to ecological processes and global biodiversity (Bertrand et al. 2011; Dawson et al. 2011). Previous studies have demonstrated that climate warming influences community structures and species interactions (Baldwin et al. 2014; Rudgers et al. 2016; Yang et al. 2015a). Therefore, predicting the impact of climate change on the potential distribution patterns of species is of great significance for formulating biodiversity conservation strategies (Bellard et al. 2012; Guan et al. 2018).
Species distribution models (SDMs) are empirical methods that can predict the potential distribution patterns of species by combining species occurrence records with the environmental variables (Guo et al. 2019). With the continuous development of SDMs, they have been applied to predict the potential distribution of flora and fauna (Fitzpatrick et al. 2013; Xiong et al. 2004; Zhang et al. 2022). The maximum entropy (MaxEnt) model is one SDM based on machine learning and MaxEnt (Phillips et al. 2006; Phillips and Dudik 2008). Elith et al. (2006) constructed 16 SDMs to predict the potential geographic distribution of 226 species on Earth and found that the MaxEnt model was more accurate than other models. Furthermore, the MaxEnt model has many other advantages over other models, including short model running time, easy operation and small sample size requirements, as well as its outstanding ability to predict the species distribution using incomplete datasets (Elith et al. 2011; Hernandez et al. 2006; Ortega-Huerta and Peterson 2008; Pearson et al. 2007; Phillips et al. 2006; Tu et al. 2022). Numerous studies on the distribution and changes of species based on the MaxEnt model have been conducted worldwide (Zwiener and Alves 2023). For example, Cheng et al. (2020) predicted the distribution of Corythucha marmorata in Nanjing and its risk analysis in China. Chen et al. (2019) predicted the habitat suitability of 12 coniferous forest tree species in Southwest China relative to climate change. Al-Khalaf (2021) investigated the potential distribution of honeybee predators (Palarus latifrons) in the Arabian deserts using MaxEnt and GIS. Recently, the accuracy of the temperature and precipitation datasets of the Coupled Model Intercomparison Project (CIMP) has been widely verified, allowing for the study of the future distribution of species (Tian et al. 2021). An increasing number of studies have combined CIMP6 data with the MaxEnt model to explore the distribution and changes in potential suitable areas for species in future climate change scenarios. The distribution area for Cunninghamia lanceolata (Lamb.) Hook. (Chinese fir) was predicted using the MaxEnt model with CMIP6 data from 2041 to 2060 in China, and it was found that Chinese fir will expand to northern China in a future warming scenario (Zhao et al. 2021; Zhou et al. 2021). Liu et al. (2021) demonstrated that the suitable areas of Houttuynia cordata Thunb (Ceercao) shrank in southern China and expanded into the northern China using a combination of the MaxEnt model and CIMP6 dataset from 2041 to 2060 and 2061 to 2080. All of these studies had demonstrated that the MaxEnt model with the CIMP datasets can be used to predict the future potential suitable areas for different species (Fitzpatrick et al. 2013; Hasui et al. 2017).
Broussonetia papyrifera is a deciduous tree in the Moraceae family (Li et al. 2011). It is an important native tree species in China and eastern Asia with strong adaptability, wide distribution and economic importance (Barker 2002). Broussonetia papyrifera is well known for its bark fibers, has a wide range of uses and has important application value, including the manufacturing of high-quality papers, cloths and ropes (Liao et al. 2006; Peng et al. 2019). This tree is rich in chalcones and flavonoid derivatives, which are important antioxidants (Cheng et al. 2001). Tender leaves and twigs are widely used in livestock feed (Li et al. 2011). Because of its fast growth, high yield, extensive planting and good resistance to adverse environments like drought and saline-alkali, it is an important tree species for ecological restoration (Li et al. 2011; Wu et al. 2018). The current research on B. papyrifera mainly focuses on its breeding (Wei and Yu 2010), physiological characteristics (Wu et al. 2011), medicinal and forage value (Sun et al. 2012), but the distribution of its suitable areas and influencing factors are less reported (Wu et al. 2018). As a tree species with important economic and ecological function values, the study of its suitable area distribution and future changes will provide a theoretical basis for the selection of tree species for regional economic forestry and ecological forestry projects.
This study, using the MaxEnt model and the environmental variables (both current and future datasets), had the following objectives: (i) obtain the potential suitable habitat distribution of B. papyrifera under current climatic conditions and identify the climatic factors that determine its distribution; (ii) predict the potential suitable areas for B. papyrifera using future climate change scenarios (2041–2060) and analyze the changes in habitat suitability distributions between the current period and 2041–2060 periods. These results will provide an important reference and theoretical basis for ecological restoration and species selection in forestry.
MATERIALS AND METHODS
Current species collection
A total of 1748 original current distribution points for B. papyrifera were obtained from the Global Biodiversity Information Facility (GBIF, https://www.gbif.org) and the Chinese Virtual Herbarium (CVH, http://www.cvh.ac.cn) (Huang et al. 2020; Miao et al. 2021). These data were recorded mainly through observations and preserved specimens. Repetitive and original records that lacked geolocation information (longitude or latitude) were deleted. Because the spatial resolution of bioclimatic variables was 30 arc-seconds (approximately 1 km), only one data point within a 1 km × 1 km grid cell was retained to minimize the clustering effects in the model prediction (Li et al. 2014; Miao et al. 2021). According to the requirements of the MaxEnt model, the distribution records of target species are sorted into CSV files in the order of species name, longitude and latitude. A total of 613 distribution points for B. papyrifera were finally reserved for the establishing of the MaxEnt model (Fig. 1).
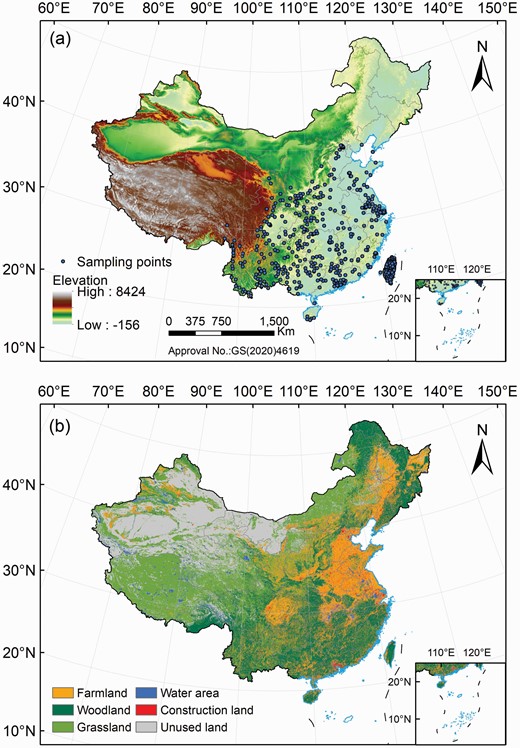
(a) The distribution points of Broussonetia papyrifera and (b) land use and land cover in China.
Environmental parameters for model simulation
Environmental variables play key roles in the distribution of species (Li et al. 2020). As the most important environmental variable, climatic factors are mainly used to establish niche-based species distribution prediction models (Li et al. 2020). Previous studies have identified 19 bioclimatic variables as the most typical variables for modeling and predicting species distribution (Guisan et al. 2007; Molloy et al. 2014). These 19 bioclimatic variables, slope, aspect and elevations with a spatial resolution of 30 arc-seconds were collected from the WorldClim’s dataset (http://www.worldclim.org) (Gong et al. 2022; Lin and Ye 2020). In addition, the effects of soil variables on SDM predictions were considered. A total of 33 soil variables were collected from the Harmonized World Soil Database (HWSD v. 1.21). All environmental variables were in raster formats, which were clipped and resampled using ArcGIS 10.5, and finally stored in ASCII format (Supplementary Table S2).
For future climate change scenarios, the bioclimatic data from the BCC-CSM2-MR, MRI-ESM2-0 and CanESM5 climate system models under two shared socio-economic pathways (SSP1-2.6 and SSP5-8.5) were selected in this study. The BCC-CSM2-MR, MRI-ESM2-0 and CanESM5 climate system models were developed by the National Climate Center (China), Meteorological Research Institute (Japan) and Canadian Centre for Climate Modelling and Analysis (Canada), respectively (Tian et al. 2021). In the SSP1-2.6 scenario, the radiative forcing will decrease to 2.6 W/m2 in 2100, representing a climate scenario with low concentrations of greenhouse gases. In the SSP5-8.5 scenario, the radiative forcing will rise to 8.5 W/m2 in 2100, representing a composite scenario of a highly energy-intensive socio-economic development path with strong radiative forcing (Liu et al. 2021; O’Neill et al. 2016; Tian et al. 2021). These future bioclimatic variable data were used to drive the MaxEnt model, and the results were averaged to obtain the future potential distribution for B. papyrifera from 2041 to 2060 in SSP1-2.6 and SSP5-8.5 scenarios.
To establish a better performance of the MaxEnt model, principal component analysis and Pearson correlation analysis were conducted with all the environmental variables (Fotheringham and Oshan 2016). Principal components with eigenvalues >1 were extracted and used for the subsequent correlation analysis (Supplementary Table S3) (Wan et al. 2021; Ye et al. 2022; Yi et al. 2018). Only the variables with lower ecological significance were removed when the correlation coefficient of two variables >0.8 (Dormann et al. 2013; Yin et al. 2023). Fourteen variables were finally selected as the data input for the MaxEnt model (Table 1).
Contribution of variables for modeling
| Variable | Description | Unit | Percent contribution (%) |
|---|---|---|---|
| cnabio11 | Mean temperature of coldest quarter | °C | 33.5 |
| cnabio17 | Precipitation of driest quarter | mm | 33.1 |
| cnabio16 | Precipitation of wettest quarter | mm | 20.4 |
| cnabio15 | Precipitation seasonality (coefficient of variation) | — | 3.3 |
| t_gravel | Topsoil gravel content | % vol | 2.4 |
| cnabio3 | Isothermality (bio2/bio7) (* 100) | — | 2 |
| t_clay | Topsoil clay fraction | % wt | 1.3 |
| cnaasp | Aspect | — | 1.2 |
| cnabio10 | Mean temperature of warmest quarter | °C | 1.1 |
| t_teb | Topsoil TEB (total exchangeable bases) | cmol/kg | 0.8 |
| s_gravel | Subsoil gravel content | % vol | 0.4 |
| s_sand | Subsoil sand fraction | % wt | 0.3 |
| s_ece | Subsoil salinity (Elco) | dS/m | 0.1 |
| t_oc | Topsoil organic carbon | % wt | 0.1 |
MaxEnt model description and modeling
The MaxEnt model (version 3.4.1) was used to predict species distribution. A total of 75% of the occurrence data were used for training, while the remaining 25% was used for testing. The algorithm was executed with 1000 iterations of these processes. The logistic output of the MaxEnt revealed a potential distribution map for the B. papyrifera in China, with values <1. The results obtained from the MaxEnt were assembled in ArcGIS 10.5 to generate the output in raster format for further analysis.
Evaluation of model results
The contribution of the MaxEnt model to the environmental variables was tested using the jackknife method to evaluate the impact of environmental factors on the distribution of B. papyrifera in China. The MaxEnt model tracked environmental variables with high contributions to species distribution and then increased the gain value by gradually modifying the individual factor, assigning the gain value to the environmental variable on which the factor depends, expressed as a percentage (Zhao et al. 2020). The performance of the model was analyzed using the receiver operating characteristic (ROC) curve and the area under the ROC curve (AUC), where the AUC value ranged from 0 to 1 (Zhou et al. 2021). Model performance evaluation is usually divided into the following five grades: failure (0.5–0.6), average accurate (0.6–0.7), relatively accurate (0.7–0.8), very accurate (0.8–0.9) and extremely accurate (0.9–1) (Dong et al. 2022).
Potential habitat classification and future change determination
According to the previous criteria for the suitable area threshold division of B. papyrifera, the results of the habitat suitability index output by the MaxEnt model were finally loaded into ArcGIS 10.5 for classification as follows: unsuitable habitat with values <0.15, poorly suitable habitat values ranging from 0.15 to 0.30, moderately suitable habitat values ranging from 0.30 to 0.52, and highly suitable habitat values ranging from 0.52 to 1.00 (Wu et al. 2018).
To compare the scope changes of the future and the current suitable areas for B. papyrifera, the current and future results were divided into suitable areas and the non-suitable areas in ArcGIS using a threshold of 0.15, and the changes in the distribution range of the future suitable areas were obtained by superposition analysis (Brown et al. 2017; Chen et al. 2021). Ultimately, future scope changes in suitable areas were divided into four categories: gained, unsuitable, stable and lost.
Identification of potential available planting areas using LUCC data
Land use and land cover change (LUCC) data were used to determine whether the suitable area simulated by the model was consistent with actual land use, and to further determine whether the suitable area can be used as an actual growth area (Zhou et al. 2021). The LUCC 2015 data were downloaded from the Chinese Academy of Sciences Resource and Environmental Science Data Center (http://www.resdc.cn/, accessed on 8 December 2020). The original dataset was divided into six primary categories and 26 secondary categories. This study mainly used the six primary categories: (i) Farmland, (ii) Woodland, (iii) grassland, (iv) water-area, (v) construction land and (vi) unused land (Zhang et al. 2019b). When the simulated suitable areas were distributed in the farmland, they were regarded as ineffective planting areas for B. papyrifera because of China’s farmland protection policy (Liang et al. 2022). All spatial statistics were performed in ArcGIS10.5.
RESULTS
Model evaluations and critical environmental variables
Figure 2 shows the ROC curve for the same environmental data averaged over the replicate runs. The average test AUC for the replicate runs was 0.910, and the standard deviation was 0.002, which indicated that the prediction result of the MaxEnt model in this study was very accurate and reliable.
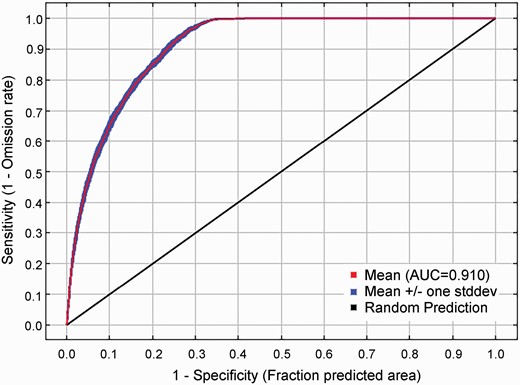
Reliability test of the MaxEnt model created for Broussonetia papyrifera.
For the environmental data used in the MaxEnt model prediction, the MaxEnt model modified each evaluation factor and the coefficient adjustment of the model to calculate the contributions of each environmental factor to the prediction using iterative algorithms (Table 1). We found that the top three environmental variables of the model’s predicted contribution rates were the mean temperature of the coldest quarter (cnabio11, 33.5%), precipitation of the driest quarter (cnabio17, 33.1%) and precipitation of the wettest quarter (cnabio16, 20.4%). The cumulative contribution of the top three environmental variables was 87%. Furthermore, when only a single variable was used for the simulation, the three variables with the highest regularization training gain were also the mean temperature of the coldest quarter (cnabio11), precipitation of the driest quarter (cnabio17) and precipitation of the wettest quarter (cnabio16), which indicated that the information contained in these three variables was more effective than other variables. When various other variables were used in the simulation, the variable with the largest decrease in regularization training gain was the mean temperature of the coldest quarter (cnabio11), indicating that this variable contains information that the others do not (Fig. 3). It is worth noting that among the bioclimatic and soil environmental variables, climate factors played a dominant role, while soil factors had relatively little influence on the prediction (Table 1; Fig. 3). For the soil factor variables, topsoil gravel content and topsoil total exchangeable bases (TEB) played more important roles in the simulation than the other soil variables. In general, the mean temperature of the coldest quarter, precipitation of the driest quarter and precipitation of the wettest quarter were the main factors that affected the distribution of the current potential suitable areas for B. papyrifera in the simulation.
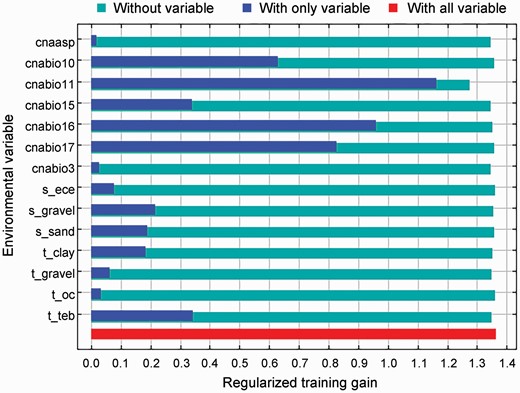
Jackknife test of variable importance for Broussonetia papyrifera.
The following curves show how each dominant environmental variable affects the MaxEnt prediction (Fig. 4). Each of the curves represents a different model, namely, a MaxEnt model created using only the corresponding variable. These plots reflect the dependence of the predicted suitability on the selected variable and the dependencies induced by correlations between selected variable and other variables. They may be easier to interpret if there are strong correlations between variables. Our results showed that when the presence probability of B. papyrifera was greater than 0.52, the corresponding environmental factor value was a critical value for B. papyrifera. The response curves showed that the mean temperature of the coldest quarter was 11.54–27.11 °C would be suitable for the growth of B. papyrifera. The suitable ranges of precipitation of the driest quarter and precipitation of the wettest quarter for the growth of B. papyrifera were 51.48–818.40 and 665.51–2302.60 mm, respectively.
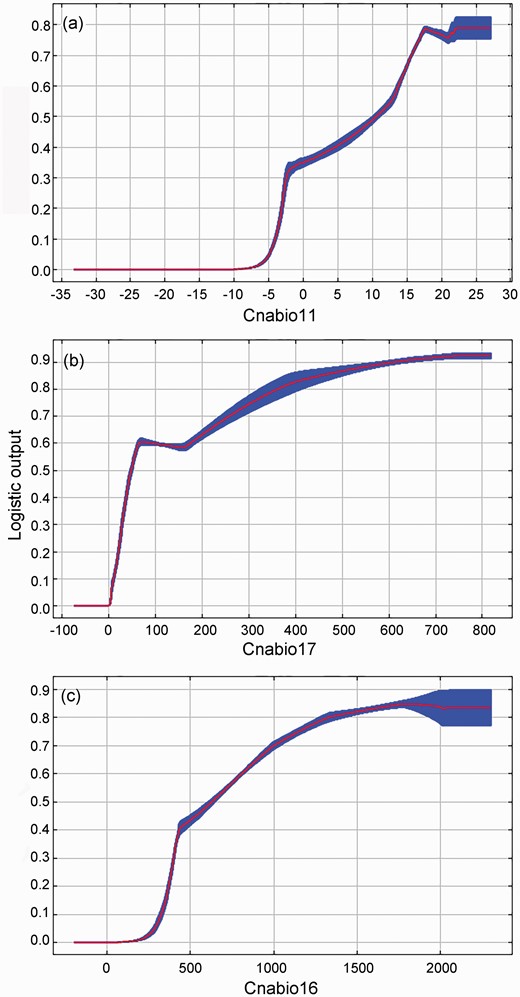
Response curves of major environmental variables for the probability of presence of Broussonetia papyrifera, (a) cnabio11, (b) cnabio17 and (c) cnabio16.
Current potential distribution for B. papyrifera
The current suitable distribution map for B. papyrifera in China is shown in Fig. 5. Figure 5a shows the distribution of the current suitable area obtained by using bioclimatic and soil variables, while Fig. 5b by using climate variables only to drive the model. Based on the original output of the model, the results were reclassified and computed using the Reclassify and Zonal Statistics tool in ArcGIS 10.5. The statistical results showed that the highly, moderately and poorly suitable areas were 28.66 × 10⁴, 165.28 × 10⁴ and 98.56 × 10⁴ km2, respectively, which accounted for 9.80%, 56.50% and 33.70% of the total suitable area (292.50 × 10⁴ km2), respectively (Fig. 5a; Table 2).
Potential suitable areas for Broussonetia papyrifera predicted in the BCC-CSM2-MR, MRI-ESM2-0 and CanESM5 models under SSP1-2.6 and SSP5-8.5 scenarios
| Model | Periods | Scenarios | Low suitability | Moderate suitability | High suitability | Total suitability |
|---|---|---|---|---|---|---|
| Current1 | 98.56 | 165.28 | 28.66 | 292.50 | ||
| Current2 | 38.18 | 219.15 | 41.59 | 298.92 | ||
| BCC-CSM2-MR | 2041–2060 | SSP1-2.6 | 37.83 | 205.53 | 74.95 | 318.31 |
| SSP5-8.5 | 40.88 | 193.59 | 100.53 | 335.00 | ||
| MRI-ESM2-0 | 2041–2060 | SSP1-2.6 | 48.45 | 205.72 | 61.86 | 316.03 |
| SSP5-8.5 | 47.38 | 200.00 | 81.88 | 329.26 | ||
| CanESM5 | 2041–2060 | SSP1-2.6 | 43.38 | 181.28 | 121.16 | 345.82 |
| SSP5-8.5 | 54.37 | 185.73 | 145.68 | 385.78 | ||
| Multi-modal averaging | 2041–2060 | SSP1-2.6 | 45.91 | 194.88 | 87.50 | 328.29 |
| SSP5-8.5 | 48.55 | 189.14 | 111.42 | 349.11 |
Current1: model driven by bioclimatic and soil variables; Current2: model driven by bioclimatic variables. Suitable area values are presented as (104 km2).
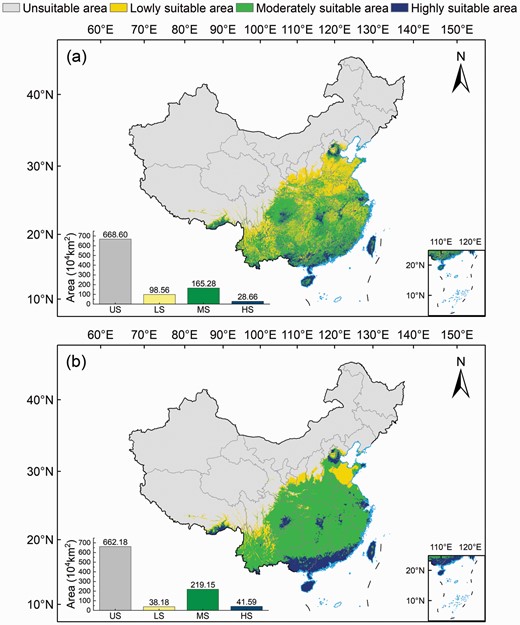
Current potential suitable areas for Broussonetia papyrifera. Models driven by (a) bioclimatic and soil variables and (b) bioclimatic variables.
Suitable areas for B. papyrifera were mainly located in the eastern, central and southeastern China. The highly suitable areas were distributed in Guangdong (5.60 × 10⁴ km2), Guangxi (4.39 × 10⁴ km2), Taiwan (2.54 × 10⁴ km2) and Hainan (2.17 × 10⁴ km2), which accounted for 51.29% of the total highly suitable areas. In addition, southern Yunnan, southern Hunan, Fujian, southeastern Xizang and southern Jiangsu were highly suitable for the growth of B. papyrifera. The moderately suitable areas were distributed in southern Yunnan (19.04 × 10⁴ km2), the eastern part of Sichuan (16.82 × 10⁴ km2), most parts of Guangxi (14.21 × 10⁴ km2), eastern Hunan (13.89 × 10⁴ km2), Hubei (11.59 × 10⁴ km2), Jiangxi (11.58 × 10⁴ km2), central and southern Guizhou (10.86 × 10⁴ km2), Guangdong (9.44 × 10⁴ km2) and Fujian (8.55 × 10⁴ km2), with a proportion of moderately suitable areas that was more than 5%.
The results of the model driven only by bioclimatic variables (Fig. 5b) were consistent with those of the model driven by bioclimatic variables and soil variables in terms of spatial distribution and total habitat area (Fig. 5a; Table 2). However, the results of the model driven only by bioclimatic variables showed a wider range of high and moderate suitable areas than those of the model driven by bioclimatic variables and soil variables, with an area of 41.59 × 10⁴ and 219.15 × 10⁴ km2, respectively. The results of the model driven by bioclimatic and soil variables showed a wider distribution of low suitable areas (98.56 × 10⁴ km2) when compared with the model only driven by bioclimatic variables.
Changes in future potential distribution areas for B. papyrifera
We next predicted the potential suitable areas for B. papyrifera in 2041–2060 using BCC-CSM2-MR, MRI-ESM2-0 and CanESM5 climate data in the SSP1-2.6 and SSP5-8.5 climate change scenarios (Fig. 6). The mean values of the predicted results of the three models for the low, moderate, high and total suitable areas were 48.55 × 10⁴, 189.14 × 10⁴, 111.42 × 10⁴ and 349.11 × 10⁴ km2 under the SSP5-8.5 scenario; and 45.91 × 10⁴, 194.88 × 10⁴, 87.50 × 10⁴ and 328.29 × 10⁴ km2 under the SSP1-2.6 scenario, respectively. Under the SSP5-8.5 scenario, the CanESM5 reached a maximum total suitable area of 385.78 × 10⁴ km2, followed by BCC-CSM2-MR (335.00 × 10⁴ km2) and MRI-ESM2-0 (329.26 × 10⁴ km2, Table 2). Under the SSP1-2.6 scenario, the total suitable areas showed a similar ranking, with CanESM5 (345.82 × 10⁴ km2) > BCC-CSM2-MR (318.31 × 10⁴ km2) > MRI-ESM2-0 (316.03 × 10⁴ km2, Table 2). The highly suitable areas identified in different modes showed that the suitable areas predicted by SSP5-8.5 scenario was larger than those predicted by the SSP1-2.6 scenario.
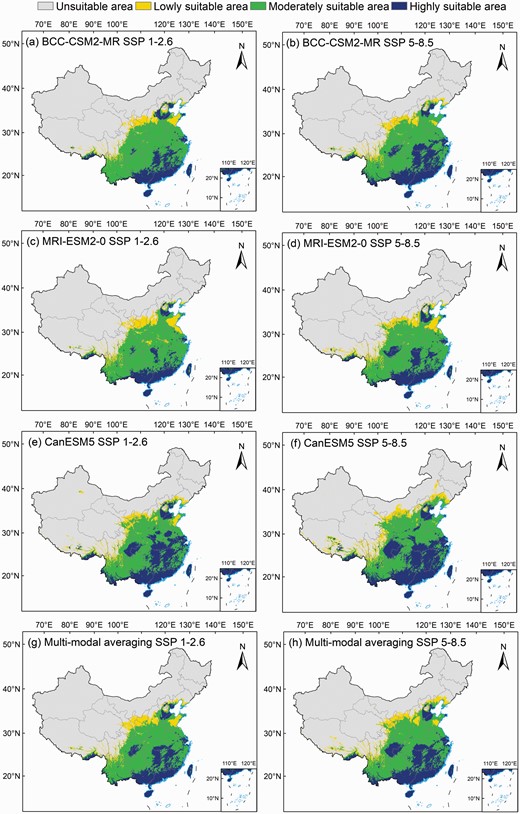
Potential suitable areas for Broussonetia papyrifera under SSP1-2.6 and SSP5-8.5 scenarios, (a, b) BCC-CSM2-MR, (c, d) MRI-ESM2-0, (e, f) CanESM5 and (g, h) multi-modal averaging.
In terms of spatial distribution, compared with the current suitable area, the highly suitable area predicted using the BCC-CSM2-MR model showed an obvious expansion trend from the southern edge of China to the north, especially in the SSP5-8.5 scenario. The newly added highly suitable areas were mainly distributed in Hunan, Hubei, Jiangxi, Anhui, Fujian, Beijing and Tianjin (Fig. 6a and b). The two different scenarios provided by the CanESM5 model had a wider range than those provided by the other two models, and there were highly suitable areas in the Chongqing, Henan and Shandong (Fig. 6e and f). The distribution of the highly suitable areas in different scenarios in the MRI-ESM2-0 model showed little increase, and the distribution was mainly in Chongqing, Hunan and Hubei (Fig. 6c and d). Under future climate change scenarios, the mean results of the three models showed similar distribution patterns, with highly suitable areas extending into Sichuan, Hunan and Jiangxi (Fig. 6g and h). In short, the highly suitable areas identified in the different scenarios showed a wider distribution and an expanding trend from the south toward the eastern and northern parts of China in response to future climate change.
Changes in the potential future geographic distribution of B. papyrifera were calculated based on the simulation results of the current and future potential suitable areas (Fig. 7). The simulation results showed that in the SSP1-2.6 and SSP5-8.5 scenarios, most of the suitable areas in China remained stable, while a few areas showed a loss of suitability, and increased suitable areas were mainly located in northwest China (Fig. 7). The gained area of suitable areas increased from 29.75 × 10⁴ km2 in SSP1-2.6 to 50.17 × 10⁴ km2 in SSP5-8.5, and was mainly distributed in southern Inner Mongolia and Gansu, Hebei, Shanxi, Ningxia and Liaoning regions (Fig. 7a and b). In addition, we observed an expansion of the gained suitable areas in the western Sichuan and Tibetan regions.
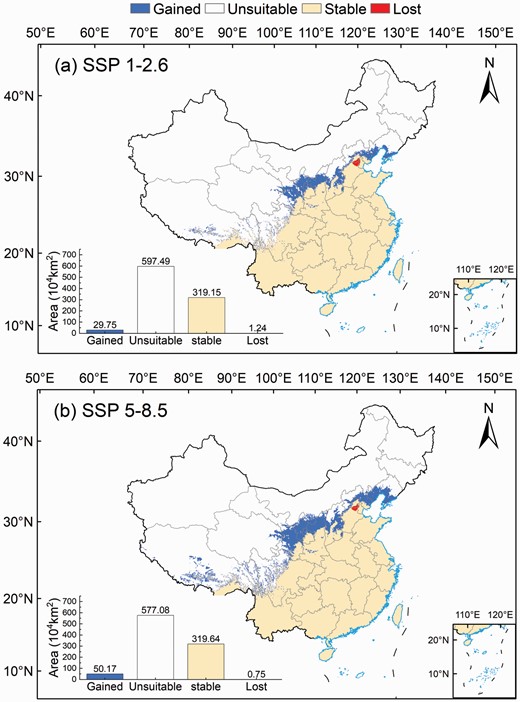
Changes in the potential geographical distribution of Broussonetia papyrifera under (a) SSP1-2.6 and (b) SSP5-8.5 scenarios.
Figure 8 shows the potential available planting areas for B. papyrifera in different scenarios during 2041–2060. We found that 112.18 × 10⁴ to 127.07 × 10⁴ km2 of the simulated suitable area for B. papyrifera fell within farmlands in the different models and scenarios (Fig. 8). After excluding these areas, the results from the BCC-CSM2-MR model showed that the potential available suitable areas were 205.78 × 10⁴ and 218.03 × 10⁴ km2 in the SSP1-2.6 and SSP5-8.5 scenarios, respectively, while the MRI-ESM2-0 mode reported 203.85 × 10⁴ and 214.75 × 10⁴ km2 of available suitable area, respectively. The CanESM5 mode showed the widest areas with 227.01 × 10⁴ and 258.76 × 10⁴ km2, respectively. The results of multi-model averaging showed that the available planting area was 212.66 × 10⁴ and 229.32 × 10⁴ km2 in the SSP1-2.6 and SSP5-8.5 scenarios, respectively, when the suitable area within the farmland range was excluded.
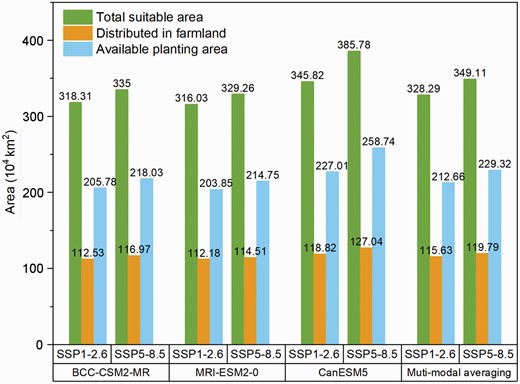
Potential available planting area for Broussonetia papyrifera during 2041–2060.
DISCUSSION
Prediction of MaxEnt model for B. papyrifera
Similar to previous studies, the MaxEnt model performed well in predicting suitable areas for various species in China (Liu et al. 2021; Wang et al. 2020; Zhao et al. 2021). The average test AUC for the replicate runs was 0.910, and the standard deviation was 0.002, which indicated that the prediction results of the MaxEnt model used in this study were very accurate and reliable. The accuracy of our simulation is lower than that reported by Wu et al. (2018), which may be due to the lack of screening of climatic factors in the Wu et al. study, as well as the collinearity among the multivariable, which can lead to overfitting of the model (Wu et al. 2018; Zhao et al. 2022). Prediction of current highly suitable areas for B. papyrifera indicated that they were mainly located in eastern, central and southeastern China, and the highly suitable areas were distributed in Guangdong, Guangxi, Taiwan and Hainan, which is consistent with the records of the CVH (Wu et al. 2018). There were differences between our results for the suitable distribution area of B. papyrifera and Wu et al. report. Our results showed that the highly suitable areas were mainly distributed in Fujian, Guangdong, Guangxi, Hainan and Taiwan, which was different from distribution in Sichuan, Chongqing, Guizhou and Yunnan reported previously (Wu et al. 2018). A possible reason for this is that the species occurrence data collected were different between the two studies. The species occurrence point data collected by Wu et al. are mainly concentrated in Sichuan, Chongqing and Guizhou, while our study showed a distribution in Fujian, Taiwan, Guangdong and Hainan, which led to different simulation results owing to differences in model simulation target variables. Another reason for the differences between results of our and previous studies may be from the choice of climatic variables.
Under different future scenarios and model datasets, there were differences in trends of the prediction results for some regions, such as Jiangsu and Chongqing. The primary reason for this result is the limitations of MaxEnt model. The current MaxEnt model mainly focuses on the influence climate, altitude and other environmental factors had on the suitability for B. papyrifera growth, and did not apply to areas with intensive human activities (Wang et al. 2020); In addition, the MaxEnt prediction only showed the highest probability of species distribution, not the true distribution (Liu et al. 2021). Another important reason for differences may be the large uncertainties in the CIMP6 data as model data inputs, including uncertainties in the spatial distribution and rate of warming and precipitation (Zhao et al. 2020). Owing to error propagation, the error could have been further amplified when the MaxEnt model is used to simulate the potential suitable area for the B. papyrifera with the CIMP6 data (Zhu et al. 2020). Therefore, to improve the prediction accuracy of species habitats, future studies should focus on improving the quality of the input data and the model to comprehensively consider the impact of human activities as well as climate change.
Restriction of climatic variables on the geographical distribution of B. papyrifera
Our results showed that the mean temperature of the coldest quarter, precipitation of the driest quarter and precipitation of the wettest quarter are the main factors that limit the selection of the suitable area for B. papyrifera. Additionally, the mean temperature of the coldest quarter ranges from 11.54 to 27.11 °C would be suitable for the growth of B. papyrifera growth, which is consistent with heliophilous species. Yang et al. (2015b) found that the germination rate and germination index of B. papyrifera reached the highest level (90% and 19.04) at 20/10 °C (light/dark) and decreased as water stress increased. The mean temperature of the coldest quarter was the main limiting factor for the growth of B. papyrifera, and adequate sunlight with relatively high temperatures was very suitable for its germination and growth. We found that B. papyrifera was less dependent on water availability; the precipitation of the driest quarter and precipitation of the wettest quarter was 51.48–818.40 and 665.51–2302.60 mm, respectively, which is enough to support B. papyrifera growth. This also reflected the ecological characteristics of B. papyrifera, which include strong stress resistance and drought tolerance (Nie et al. 2013; Yang et al. 2015b). One possible explanation is that the stable carbonic anhydrase activity and strong photosynthetic ability enable B. papyrifera to adapt well to drought conditions (Wu et al. 2011). Additionally, the root system of B. papyrifera has extremely developed fibrous roots, which provide it with a strong ability to absorb water (Zhang et al. 2009). In addition, some roots can also form rhizobia and a solid network structure in the soil to prevent soil erosion, which has enabled it to become one of the preferred tree species for vegetation ecological restoration in the karst region (Nie et al. 2013; Wang et al. 2022; Wei and Yu 2010). In addition, the results of this study indicate that although the contribution rate of soil factors to the simulation of the potential geographical distribution was low, they play a crucial role in the distribution of high suitable areas of B. papyrifera, which was consistent with previous studies on Phyllostachys edulis (Chen et al. 2021), Polyporus umbellatus (Guo et al. 2019) and Cornus officinalis (Cao et al. 2016).
Changes in potential suitable areas for B. papyrifera
Previous studies have demonstrated that 80% of species migration changes is associated with climate changes (Shimai et al. 2021; Zhao et al. 2021). Climate warming has a subtle impact on species adaptation and distribution, and northern or higher latitudes are easily transformed into suitable conditions for species growth under the warming trend (Koo et al. 2015; Zhao et al. 2021).
The predictions of this study suggest the future potential suitable areas for B. papyrifera will expand in southern China, and a wider suitable area was identified in the northern of China based on the BCC-CSM2-MR, MRI-ESM2-0 and CanESM5 data under different scenarios for 2041–2060. Similar changes have been observed for other tree species, such as Cunninghamia lanceolate (Zhou et al. 2021), Pinus massoniana (Wu et al. 2022) and Taiwania cryptomerioides (Zhao et al. 2020). However, our results were different from the predictions for herbaceous plants, such as H. cordata Thunb (Ceercao) (Liu et al. 2021) and Coptis herbs (Li et al. 2020), which showed a decreasing trend in areas under future climate change scenarios. A previous study demonstrated that the annual mean precipitation had an upward fluctuation under all the SSPs scenarios with the CIMP6 dataset from 2015 to 2099 across China, and predicted a higher increased rate in northern China than that in southern China, which would alleviate water shortages (Tian et al. 2021). Furthermore, the annual average surface temperature in China increased by 2.7–2.9 °C, and the warming in the south increased by 1.8–2.5 °C (Jiang and Fu 2012). Our research showed that the main influencing factors for the distribution for B. papyrifera suitable areas were the mean temperature of the coldest quarter, precipitation of the driest quarter, and precipitation of the wettest quarter. The future spatial changes in temperature and precipitation are consistent with the expansion of our predicted range of suitable growth areas for B. papyrifera in southern and northwestern China (Yang et al. 2021). Soil moisture and thermal conditions change with the increase in temperature and precipitation, which is mainly reflected in the increase in soil moisture and the more suitable soil temperature to meet the needs of seed germination and vegetation growth that then affect the distribution of B. papyrifera (Yang et al. 2015b). The simulation results of different data-driven models in this study showed that the potential highly suitable area for B. papyrifera in the SSP5-8.5 scenario had a wider distribution range and larger area than that predicted in the SSP1-2.6 scenario. This is mainly because the SSP5-8.5 scenario is a high radiative forcing scenario, in which the multi-model average temperature rise reached 2.4–4.8 °C in 2100, and its warming range was significantly larger than that of the SSP1-2.6 scenario, which had a warming of less than 2.0 °C (Zhang et al. 2019a). This would result in significantly higher increases in the coldest season mean temperature in the SSP5-8.5 scenario than in the SSP1-2.6 scenario. Therefore, the SSP5-8.5 scenario showed more adequate hydrothermal conditions than the SSP1-2.6 scenario for the expansion of B. papyrifera (Tian et al. 2021). In addition, the northward expansion of the suitable area for B. papyrifera is likely related to human activities. It is worth noting that the suitable areas for B. papyrifera were mainly distributed in the Three North Shelterbelt areas in China, such as Hebei, Tianjin, southern Inner Mongolia and other provinces in northern China. It might be the construction of major ecological projects that changed the local climate conditions, which in turn created more suitable areas for vegetation species to migrate north. Additionally, the prediction results for the suitable growth of B. papyrifera in northern China also provide more species selection for the construction of the Three North Shelterbelts in the future.
CONCLUSIONS
This study was conducted to simulate the current suitable distributions of B. papyrifera using the MaxEnt model in China. Future changes in potentially suitable distributions of B. papyrifera were analyzed using the BCC-CSM2-MR, MRI-ESM2-0 and CanESM5 datasets in the SSP1-2.6 and SSP5-8.5 from 2041 to 2060. The main conclusions are summarized as follows: (i) The highly, moderately and poorly suitable areas for B. papyrifera were 28.66 × 10⁴, 165.28 × 10⁴ and 98.56 × 10⁴ km2, which accounted for 9.80%, 56.50% and 33.70% of the total suitable area (292.50 × 10⁴ km2), respectively. These areas were mainly located in eastern, central and southeastern China. The mean temperature of the coldest quarter (11.54–27.11 °C), precipitation of the driest quarter (51.48–818.40 mm) and precipitation of the wettest quarter (665.51–2302.60 mm) are the main factors that limit the selection of the suitable areas for B. papyrifera. (ii) Compared with the current suitable area, the future highly suitable area distribution of B. papyrifera from 2041 to 2060 was wider. In the SSP5-8.5 scenario, the multi-modal averages of the highly and the total suitable area of B. papyrifera were 111.42 × 10⁴ and 349.11 × 10⁴ km2, while those in the SSP1-2.6 scenario were 87.50 × 10⁴ and 328.29 × 10⁴ km2, respectively. The gained suitable areas increased from 29.75 × 10⁴ km2 in SSP1-2.6 to 50.17 × 10⁴ km2 in SSP5-8.5 and were mainly distributed in the western and northern parts of China. (iii) Excluding the suitable area of B. papyrifera distributed within the farmland, the mean values of potential available planning areas were 212.66 × 10⁴ and 229.32 × 10⁴ km2 in the SSP1-2.6 and SSP5-8.5 scenarios, respectively.
Supplementary Material
Supplementary material is available at Journal of Plant Ecology online.
Table S1: Environmental variables for habitat suitability modeling of Broussonetia papyrifera.
Table S2: Soil variables for habitat suitability modeling of Broussonetia papyrifera.
Table S3: Results of principal component analysis of variables for habitat suitability modeling of Broussonetia papyrifera.
Table S4: Pearson correlation coefficients among different variables for habitat suitability modeling of Broussonetia papyrifera.
Funding
This research was funded by the National Natural Science Foundation of China (31971453).
Acknowledgements
We are grateful to the Associate Editor and anonymous referees for providing valuable comments.
Conflict of interest statement. The authors declare that they have no conflict of interest.


