


Abstract
Leaf is the main organ of photosynthesis. Leaf phenotypic plasticity largely determines the adaptation of plants to enriched nitrogen (N) environments. However, it remains unclear whether the optimal number (proportion) of leaves representing the leaf traits of the whole plant is similar between ambient and N-enriched conditions. Moreover, whether alteration in ammonium (NH4+-N) to nitrate (NO3−-N) ratios in atmospheric N deposition will alter the optimal leaf number is unexplored. By adding three NH4+-N/NO3−-N ratios in a temperate grassland of northern China since 2014, three traits (leaf area, thickness and chlorophyll content) of two dominant clonal grasses, Leymus chinensis and Agropyron cristatum, were measured in August 2020. Results showed that under ambient conditions, the mean leaf area, thickness and chlorophyll content values of two fully expanded leaves were similar to these of all leaves at the plant level, except for the leaf area of L. chinensis, which needed five leaves (78.82% of leaves in the plant). The ratios of NH4+-N/NO3−-N increased the number of required sampled leaves and significantly changed the mean value of leaf traits and the maximum value along leaf order. Moreover, the ratios of NH4+-N/NO3−-N altered the trade-off among the three leaf traits, which is dependent on leaf order, by increasing leaf area and decreasing leaf thickness. Therefore, our study suggests that to better indicate the leaf traits’ value of the whole plant under N-enriched conditions, measuring all fully expanded leaves or providing a suitable scaling-up parameter is needed.
摘要
叶片是植物光合作用的主要器官。叶片可塑性在很大程度上决定了植物对富氮环境的适应。然而在自然条件和富氮环境中,测定植物叶片性状时需要采集的最佳数量或比例是否一致并不明确;同时大气氮沉降主要组分铵态氮与硝态氮比例变化是否会改变叶片最佳测量数量缺少实验证据支撑。因此本研究依托自2014年在中国北方温带草原开展的铵硝比添加实验(即对照和5:1、1:1和1:5的NH4+-N/NO3−-N比例),于2020年8月(植物群落生物量高峰时期)测量了两个形态相似的优势多年生禾本科物种(即羊草和冰草)在叶序水平的叶面积、叶厚度和叶绿素含量。我们发现在对照处理(自然条件),除羊草叶面积需要测定5片(占单株总叶片数的78.82%),其它性状通过测量两片完全展开叶即可代表整株该叶性状的单叶平均特征。铵硝比添加处理显著改变了叶性状最大值所在叶序,导致需要增加叶片测定数才能代表整株叶片的单叶平均特征。铵硝比添加显著改变了受叶序调控的叶性状间权衡关系,即叶片虽变大却变薄。因此,本研究结果表明,通过测量全部完全展开叶或者提供一个合适的尺度推绎参数方能更好地评估氮沉降效应下植株叶片性状的响应特征。
INTRODUCTION
Changes in plant traits affect resource absorption and utilization in plants, which in turn influences ecosystem functions (Fagundes et al. 2021; Díaz et al. 2007). Leaf area, thickness and chlorophyll content are three key traits in determining the photosynthetic capacity of plants, affecting plants’ survival (Ishizawa et al. 2021; Wright et al. 2004). A larger leaf area can promote light interception, in turn enhancing the photosynthetic rate (Freschet et al. 2018; Liang et al. 2020). Thicker leaves can increase the water storage capacity and facilitate a higher photosynthetic rate (Wright et al. 2017). The leaf chlorophyll content is directly associated with the net photosynthetic rate of plants and determines their capacity to assimilate carbon. Leaves are sensitive to environmental changes; therefore, leaf traits display trade-offs resulting from adaptation to the surrounding environment (Freschet et al. 2018; Reich 2014). For example, plants with thicker leaves usually have smaller leaf areas (Li et al. 2017). Manuals recommend examining two to three relatively mature and fully expanded leaves per individual herbaceous plant to investigate plant functional traits (Cornelissen et al. 2003; Pérez-Harguindeguy et al. 2013). However, few experimental studies explored whether leaf traits change along leaf order (Messier et al. 2017; Siefert et al. 2015). Therefore, it is unclear as to whether the mean values obtained from examining two to three leaves of an individual plant can represent all the leaves of the plant.
Human-induced increase of reactive nitrogen (N) has resulted in the doubling of the global atmospheric N deposition (Galloway et al. 2021; Yu et al. 2019) and a considerable increase in N availability in many terrestrial ecosystems (Mason et al. 2022) relative to that prior to the Industrial Revolution. Temperate terrestrial ecosystems are generally N-limited (Du et al. 2020). Accordingly, an increase in N availability can, at least partially, contribute to fulfilling the N requirements of plants and may alter ecosystem functions (Diao et al. 2021). The responses of ecosystem functions to environmental changes (e.g. N deposition and extreme climate events) would be firstly by altering traits, especially leaf physiological and morphological traits, such as leaf water content, area, thickness, chlorophyll content and N content (Cui et al. 2020; Felton and Smith 2017; Liu et al. 2017; Pérez-Ramos et al. 2012). This means leaf traits may serve as a mechanistic bridge to connect global change factors and ecosystem functions (He et al. 2019, 2020, 2022; Zhang et al. 2019b). Leaf area (Liang et al. 2020) and leaf chlorophyll content (Wan et al. 2007) were often increased by N enrichment, while both positive (Zhu et al. 2020) and neutral (Tatarko and Knops 2018) effects on leaf thickness have been reported. These above-mentioned findings are mainly based on the effect of N addition amount. It has been reported that the ratios of ammonium and nitrate have been significantly altered, even reversed, in many developed and developing countries (Du 2016; Liu et al. 2013; Yu et al. 2019), and plant species often prefer ammonium or nitrate (Xi et al. 2017; Zhang et al. 2018a). For instance, Agropyron cristatum, a perennial grass, prefers nitrate to ammonium because a larger biomass was promoted by nitrate than by ammonium (Leffler et al. 2011; Liu et al. 2020). Another perennial grass, Leymus chinensis, shows no consistent preference for ammonium or nitrate (Cao et al. 2021; Wang et al. 2016). A recent study stated that a better understanding of the influence of atmospheric N deposition, especially different ratios of ammonium and nitrate, on grasslands is warranted (Stevens et al. 2022). Only one recent study found that the long-term (>5 years) changes in the ratios of ammonium to nitrate deposition may affect plant growth (Ren et al. 2021). However, few field experiments have been conducted to investigate the effects of the ratios of ammonium and nitrate on plant traits, which might differ from those adding a single N form.
The semi-arid grassland (a temperate grassland) in northern China is dominated by clonal grasses (Kang et al. 2007). It has experienced relatively low N deposition for the last four decades (Yu et al. 2019), making it an ideal model ecosystem for studying N-induced ecological processes (Bai et al. 2010; Zhang et al. 2014, 2019a). Previous studies did explore the effect of either nitrate, ammonium or ammonium nitrate on plant traits. However, few reported the long-term (>5 years) impacts of the ratios of ammonium and nitrate. Here, by using a field N addition experiment (at 10 g N m−2 year−1) with a control and three ratios (5:1, 1:1 and 1:5) of NH4+-N to NO3−-N, we aimed to explore whether the responses of leaf traits to the ratios of NH4+-N/NO3−-N are dependent on the leaf order. This will suggest the optimal sampling of leaves for future studies and to provide information on the responses of the three leaf traits (leaf area, thickness and chlorophyll content), which are closely associated with the photosynthetic capacity. Leaf traits of two dominant clonal grasses, L. chinensis and A. cristatum, were sampled in 2020 (i.e. the sixth treatment year), with 640 individuals and 3147 leaves. We hypothesized that: (i) the leaf traits of L. chinensis will be similar among the three NH4+-N/NO3−-N ratios because L. chinensis has no consistent preference for ammonium or nitrate (Cao et al. 2021; Wang et al. 2016); and (ii) the leaf traits of A. cristatum will be altered by the ratios of NH4+-N/NO3−-N because of NO3−-N preference (Liu et al. 2020); (iii) therefore, the responses’ range of leaf traits of L. chinensis to the ratios of NH4+-N/NO3−-N will be smaller than that of A. cristatum.
MATERIALS AND METHODS
Study site
The field adding the ratios of NH4+-N/NO3−-N experiment was carried out in an L. chinensis steppe (Ren et al. 2021), experiencing a temperate continental climate, near the Inner Mongolia Grassland Ecosystem Research Station, the Chinese Academy of Sciences (43°38ʹ N, 116°42ʹ E), located in the Xilin River basin, Inner Mongolia, China. The long-term (1982–2020) mean annual temperature in the station was 1.1 °C, with a mean monthly temperature ranging from −21.1 °C in January to 20.0 °C in July. Mean annual precipitation was 341.3 mm, and 71.4% fell from May to August (i.e. the growing season). Precipitation and heat are conducive to plant growth. The experimental grassland has been fenced to prevent sheep grazing since 1999. Four perennial grasses, L. chinensis, Stipa grandis, Achnatherum sibiricum and A. cristatum, accounted for ~88.5% of the ecosystem aboveground net primary productivity in the experimental grassland from 2014 to 2019 (Ren et al. 2021). No fertilizers were added to the grassland before the experiment. The annual atmospheric N deposition from 1985 to 2015 was less than 1.0 g N m−2 (Yu et al. 2019).
Experimental design
In 2014, the field experiment with different ratios of NH4+-N/NO3−-N was established, following a completely random block design. Adding N at 10 g N m−2 year−1 is commonly used to assess the impacts of N deposition in global grasslands (Borer et al. 2014). Four treatments, the control (ambient N condition) and three ratios (5:1, 1:1 and 1:5) of NH4+-N/NO3−-N at 10 g N m−2 year−1, with 8 replicates each, i.e. 32 experimental plots (4 m × 4 m), were conducted. There was a 1-m interval between plots. To better explore the influence of the ratios of ammonium and nitrate from the atmosphere on the grassland ecosystem, a nitrification inhibitor was not added. The ratios of NH4+-N/NO3−-N at 5:1, 1:1 and 1:5 were evenly hand-broadcasted with NH4NO3 + NH4Cl, NH4NO3 and NH4NO3 + Ca(NO3)2·4H2O, respectively, at the end of every May from 2015 onward (Ren et al. 2021). The effects of Ca2+ and Cl− additions on plant aboveground biomass production were negligible (Bai et al. 2010).
Sampling and trait measurements
With sword shape leaves, L. chinensis and A. cristatum display a similar aboveground appearance (Fig. 1a and b). On 20 May 2020, 15 individuals of each species with similar height were randomly labelled in the core 2 m × 2 m of every experimental plot. To ensure that labelled individuals were prevented from connecting via their rhizomes, any two individuals of each species were at least 10 cm apart. On 10 August 2020, 10 plant individuals of each species were cut near the soil surface and brought to the laboratory. Leaf area (cm2), thickness (mm) and chlorophyll content (SPAD value) of all fully expanded leaves following the leaf order, i.e. from the top (young) to bottom (old), were measured on 10 August 2020, using a leaf area meter (LI-3050C, LI-COR, USA), digital vernier caliper (DL3944, Deli Company, China) and portable chlorophyll meter (SPAD-502Plus, Konika Minolta, Inc., Japan). Three evenly distributed and representative positions on each leaf were established and recorded. The average value was taken as the leaf thickness. SPAD value is a substitute index for leaf chlorophyll content (Uddling et al. 2007). Similar to the leaf thickness measurement, three positions were measured, recorded and averaged. In total, 1804 and 1343 leaves of L. chinensis and A. cristatum, respectively, were measured.
![The number of leaves in representing the mean leaf properties of the plant individual. Schematic diagram presents two clonal grasses: (a) Leymus chinensis and (b) Agropyron cristatum. Leaf traits, i.e. leaf area (cm2), thickness (mm) and chlorophyll content (SPAD value), of (a) L. chinensis and (b) A. cristatum under the control (grey) and three NH4+-N/NO3−-N ratios (5:1 [purple], 1:1 [blue] and 1:5 [green]). Within each experimental treatment, *, ** and *** have statistical significance at P < 0.05, 0.01 and 0.001, respectively, in comparison with the values of all leaves of the individual plant. The two and three leaves are consistent with the counting leaves of plant functional trait manuals. Error bars represent mean ± SE. Images of L. chinensis and A. cristatum under the ambient N communities on 6 August 2022. Leaf traits with ratios of ammonium and nitrate were measured on 10 August 2020.](https://oup.silverchair-cdn.com/oup/backfile/Content_public/Journal/jpe/16/4/10.1093_jpe_rtac108/2/m_rtac108_fig1.jpeg?Expires=1749770694&Signature=RXrJP1bBKwPYpYBqYLumcy3NEPRVOvbBTAPPwEA3oErhNMnMAuCLCmxrMnB-EED1Ku~TihvdnhX8yWFyqrxK3IQdu5Zi0tMF1NXh1qGWN1iAnOVnMK2bbndj9uMAQQbVCf~6cQT3nhYfjpUksb9B5bnixEyqh6FBw3FaVrisckwLyBOkV8v6p75J1Tbk44NWbb-lLwTfTu1u4HlraY-m89uSJM1JJKKyX38t7wN~~hAOfrN7nlbw7aO9P6ocT~PCliSi0gsrEWROZwGn7xAVtY-c9wwcQTplfzTAioaOUAsODUelAkEfKNlHRNTdLp-0Bvzyd1Acj~PS57t3GyeA1A__&Key-Pair-Id=APKAIE5G5CRDK6RD3PGA)
The number of leaves in representing the mean leaf properties of the plant individual. Schematic diagram presents two clonal grasses: (a) Leymus chinensis and (b) Agropyron cristatum. Leaf traits, i.e. leaf area (cm2), thickness (mm) and chlorophyll content (SPAD value), of (a) L. chinensis and (b) A. cristatum under the control (grey) and three NH4+-N/NO3−-N ratios (5:1 [purple], 1:1 [blue] and 1:5 [green]). Within each experimental treatment, *, ** and *** have statistical significance at P < 0.05, 0.01 and 0.001, respectively, in comparison with the values of all leaves of the individual plant. The two and three leaves are consistent with the counting leaves of plant functional trait manuals. Error bars represent mean ± SE. Images of L. chinensis and A. cristatum under the ambient N communities on 6 August 2022. Leaf traits with ratios of ammonium and nitrate were measured on 10 August 2020.
Statistical analyses
The optimal sampling number (proportion) of leaves
In line with plant trait manuals and previous studies (Cornelissen et al. 2003; Pérez-Harguindeguy et al. 2013), two fully expanded leaves (i.e. the second and third leaves from the top) of each individual plant were first selected for analysis. We then gradually increased the cumulative number of leaves to three, four, five and all leaves of each individual plant, which accounted for 57.88%, 73.15%, 78.82% and 100%, respectively, of the total number of leaves in L. chinensis, and for 66.79%, 70.71%, 71.43% and 100%, respectively, of the total number of leaves in A. cristatum (Supplementary Table S1). Independent t-tests were used to assess whether the differences between two, three, four, five and all the leaves under each experimental treatment were significant.
Changes in traits with leaf order (age)
For each trait, the mean values were fitted into linear or nonlinear regression models with an increase in leaf order using the ‘lm’ function. The goodness of fit was judged using the Akaike information criterion (AIC).
Impacts of NH4+-N/NO3−-N ratios on leaf traits
Based on the above-mentioned analyses, the mean value from all leaves was a better fit for leaf traits in response to the treatments. Therefore, the values of all leaves were used in the subsequent analyses. We used the response ratio (RR) to quantify the response of three leaf traits to varying NH4+-N/NO3−-N ratios. The RR was calculated as:
where xi is the value of a trait of the ith leaf of L. chinensis or A. cristatum and is the mean value of this leaf trait in the control. The linear mixing effect model in the ‘lmerTest’ package (Kuznetsova et al. 2017) was used to detect the effects on leaf traits and RR, using NH4+-N/NO3−-N ratios, species and leaf order as fixed factors, and plant number and block as random factors. The lowest AIC was employed for model selection using the ‘model.avg’ function in the ‘MuMIn’ (Sirami et al. 2019). The ‘Ismeans’ package was used to test the difference in RR under the three NH4+-N/NO3−-N ratios. The significant level was set at α = 0.05. In addition, the range of RR of each trait of the two species among the three ratios of NH4+-N/NO3−-N (i.e. six values) was calculated.
Trade-off among the three leaf traits
According to previous studies (Liang et al. 2020; Tatarko and Knops 2018; Wan et al. 2007; Zhu et al. 2020), both leaf area and leaf chlorophyll content tended to increase, while leaf thickness displayed increased, decreased or stayed the same under N-enriched conditions. This indicates that there should be a trade-off relationship among the three leaf traits under N-enriched conditions. Therefore, based on the classical ternary diagram, a trade-off index (Tz) was established to represent how the three leaf traits, both morphological and physiological, respond synergistically to the environmental changes under N enrichment. We standardized leaf area, thickness and chlorophyll content using
where xi is the value of a trait of the ith leaf of L. chinensis or A. cristatum, and j is the sum of values of the trait of L. chinensis or A. cristatum in all four treatments. The variance contributions of leaf area, thickness and chlorophyll content were obtained using principal component analysis. According to the variance contribution rates, the trade-off index among the three leaf traits of each leaf was calculated using . In the ternary diagram, a point closer to the centre represents a better trade-off. Analogously, a smaller Tz indicates a better trade-off among the three leaf traits. The linear mixed effect model was used to fix the optimal model using the ‘MuMIn’ package. Then, nonlinear regressions were performed using the ‘lm’ function to illustrate the relationships between Tz and leaf order.
All analyses were performed in R 4.0.2. The ternary diagram was obtained using the ‘ggtern’ package (Hamilton and Ferry 2018) and the other diagrams using ‘ggplot2’ (Wilkinson 2011).
RESULTS
The number of leaves representing the trait property of the individual plant
Under the control conditions, the mean leaf area, thickness and chlorophyll content values of two fully expanded leaves were not significantly different from these of the plant level (Ps ≥ 0.1975, Supplementary Table S2; Fig. 1), except for the leaf area of L. chinensis, which needed five leaves (78.82% leaves of the plant individual, Supplementary Table S1; t724 = −1.7511, P = 0.0804, Supplementary Table S2). Mean values of leaf area at all three NH4+-N/NO3−-N ratios (Ps ≤ 0.0433, Supplementary Table S2) and leaf chlorophyll content at 5:1 NH4+-N/NO3−-N ratio (t833 = −2.0746, P = 0.0383) of five L. chinensis leaves (77.68%, Supplementary Table S1) were still different from those at plant level. In contrast, mean values of leaf chlorophyll content at 1:1 (t828 = −1.7953, P = 0.0730, Supplementary Table S2; Fig. 1a) and 1:5 (t817 = −1.7832, P = 0.0749) NH4+-N/NO3−-N were similar to those at the individual level for up to five leaves. The mean value of two or three relatively mature and fully expanded leaves was similar to that at the whole plant level (all Ps ≥ 0.0616, Supplementary Table S2) for the remaining treatments, consistent with that of the control.
Changes of leaf traits with leaf order
Leaf area (F7,3038.3 =29.72, P < 0.0001, Supplementary Table S3), thickness (F7,3040.1 =4.92, P < 0.0001) and chlorophyll content (F7,3047.3 = 16.43, P < 0.0001) varied significantly with leaf order. Under the control conditions, the three leaf traits of A. cristatum (Ps ≤ 0.0209, Supplementary Table S4; Fig. 2b), but not that of L. chinensis (Ps ≥ 0.0660; Fig. 2a), exhibited significant nonlinear changes with leaf order. NH4+-N/NO3−-N ratios tended to shift the tipping values towards smaller (younger) leaves (Fig. 2a) of L. chinensis but towards larger (older) leaves of A. cristatum (Fig. 2b).
![Regression patterns of leaf traits as a function of leaf order (from top to bottom) to NH4+-N/NO3−-N ratios. Leaf area, thickness and chlorophyll content of (a) Leymus chinensis and (b) Agropyron cristatum under the control (grey) and three NH4+-N/NO3−-N ratios (5:1 [purple], 1:1 [blue] and 1:5 [green]). Regression was estimated by means of each leaf trait. Shaded areas indicate 95% confidence intervals. Dotted line fitting the tipping point corresponding to leaf order (the abscissa).](https://oup.silverchair-cdn.com/oup/backfile/Content_public/Journal/jpe/16/4/10.1093_jpe_rtac108/2/m_rtac108_fig2.jpeg?Expires=1749770694&Signature=WP0c9FoQaOnPUhtNCfJkKlAGLT-dgWvBS9h7TbcxOMv-bX1jV2TKg~FwEure1cjoKLQ80C~eUP2BX-sGo4qGvND2RWwRx897asVMyHypn4SRtJKIcbydg0lFKX90Tpgm4jA9lUo7lf~r~uovHONMOnjTSl4oN6vJPxWqQO2qA5q~sSvnsDuGuzRM59SxvD3qUR4zfyJ0T7nPoavY3flUjz1vo4e0n5fAVybuP4ZphxYm-G50WMOdiDeiWog81Sb2zSkRoP8JXRYvmiB0nrlWNOPuC5fG3GCfaxlAMn~Reco8qQVanZKzSACujHyvyEgKH0NPvx~gwPm-akjNGSCPaQ__&Key-Pair-Id=APKAIE5G5CRDK6RD3PGA)
Regression patterns of leaf traits as a function of leaf order (from top to bottom) to NH4+-N/NO3−-N ratios. Leaf area, thickness and chlorophyll content of (a) Leymus chinensis and (b) Agropyron cristatum under the control (grey) and three NH4+-N/NO3−-N ratios (5:1 [purple], 1:1 [blue] and 1:5 [green]). Regression was estimated by means of each leaf trait. Shaded areas indicate 95% confidence intervals. Dotted line fitting the tipping point corresponding to leaf order (the abscissa).
RR of leaf traits under NH4+-N/NO3−-N ratios
NH4+-N/NO3−-N ratios significantly altered RRs of leaf thickness (F2,2383.3 = 5.20, P = 0.0056, Supplementary Table S5), but not of leaf area (F2,2375.4 = 1.87, P = 0.1545) or leaf chlorophyll content (F2,2403.9 = 0.16, P = 0.8545). The RRs of leaf area (F1,2374.1 = 1.27, P = 0.2604) and leaf thickness (F1,2381.3 = 2.69, P = 0.1012) were similar between the two species, whereas those of leaf chlorophyll content were smaller for L. chinensis (F1,2401.3 = 5.84, P = 0.0157). Leaf order significantly influenced the RRs of leaf area (F7,2360.4 = 20.84, P < 0.0001), thickness (F7,2363.7 = 6.13, P < 0.0001) and chlorophyll content (F7,2373.8 = 16.98, P < 0.0001). NH4+-N/NO3−-N ratios and species significantly interacted on the RRs of all three leaf traits (Ps ≤ 0.0046), and the interaction between species and leaf order significantly affected the RRs of leaf area (F6,2357.4 = 7.08, P < 0.0001) and leaf thickness (F6,2359.8 = 8.41, P < 0.0001).
Response ranges of the RRs of leaf area (0.0629 vs. 0.1512), thickness (0.0540 vs. 0.0725) and chlorophyll content (0.0105 vs. 0.0105) were smaller in L. chinensis than these in A. cristatum (Fig. 3). In other words, the response range of morphological traits (i.e. leaf area and leaf thickness) was larger than that of physiological trait (i.e. leaf chlorophyll content).
![The RRs of leaf traits to NH4+-N/NO3−-N ratios. (a) Leaf area, (b) leaf thickness and (c) leaf chlorophyll content of Leymus chinensis and Agropyron cristatum under the three NH4+-N/NO3−-N ratios (5:1 [purple], 1:1 [blue] and 1:5 [green]). Error bars represent mean ± SE. Different letters indicated statistically significant differences across the two species (P < 0.05).](https://oup.silverchair-cdn.com/oup/backfile/Content_public/Journal/jpe/16/4/10.1093_jpe_rtac108/2/m_rtac108_fig3.jpeg?Expires=1749770694&Signature=Zm5sMzqZGpqyVgtOZS3Zm-XamjbYWZBvHG5kBW5p0b~TbZqXULwtZJTBTPTWXt4YFRwQCkeRlZiQn8UAbYBdEowC29X8Sar9u5azetvYwmvQt3sfXQDnNFaTUruEx~sgj55r658v2bvhFog3Tk972suWJ8RxjAmfNhMPGm~DaX3RPdt3hHH-n-Km6seqyHXnKnRuo5nGfc2y9mTkW7VEefVrGxxqufG47CThA8rZOm3sfkCTMMDAaQt1gHYWVF8BWDzJ~dqLqtgJk-QML0Sq3lgxMGDPaXZBuO5kDZU1KdRSzbCkzJFQ4vo8v3PVTfWkKuDJEXoG0XJRRJvGxLwIZw__&Key-Pair-Id=APKAIE5G5CRDK6RD3PGA)
The RRs of leaf traits to NH4+-N/NO3−-N ratios. (a) Leaf area, (b) leaf thickness and (c) leaf chlorophyll content of Leymus chinensis and Agropyron cristatum under the three NH4+-N/NO3−-N ratios (5:1 [purple], 1:1 [blue] and 1:5 [green]). Error bars represent mean ± SE. Different letters indicated statistically significant differences across the two species (P < 0.05).
The trade-off among leaf traits
NH4+-N/NO3−-N ratios tended to increase leaf area and reduce leaf thickness, but did not alter leaf chlorophyll content (Fig. 4). The trade-off index (Tz) was significantly smaller in L. chinensis (F1,3051.3 = 200.72, P < 0.0001, Table 1) than in A. cristatum, and was significantly increased by NH4+-N/NO3−-N ratios (F3,3083.7 = 5.23, P = 0.0013, Table 1; Fig. 5). Specifically, Tz of L. chinensis was similar among three NH4+-N/NO3−-N ratios (Fig. 5a). Tz of A. cristatum peaked at the ratio of 1:1 NH4+-N/NO3−-N (Fig. 5b). Tz changed nonlinearly with leaf order (Fig. 5c and d; Supplementary Table S6), except at 5:1 NH4+-N/NO3−-N ratio for A. cristatum. Moreover, NH4+-N/NO3−-N ratio moved the tipping point position of Tz relative to that of the control (Fig. 5c and d).
Results of linear mixed effect modelling analysis on the trade-off index (Tz) among leaf traits, using block and plant number as random factors and NH4+-N/NO3−-N ratios, species, leaf order and their interactions as fixed factors, respectively
| df | F | P | |
|---|---|---|---|
| NH4+-N/NO3−-N ratios (N) | 3,3083.7 | 5.23 | 0.0013 |
| Species (S) | 1,3051.3 | 200.72 | <0.0001 |
| Leaf order (O) | 7,3083.2 | 11.51 | <0.0001 |
| N × S | 3,3086.8 | 2.04 | 0.1056 |
| N × O | 21,3084.8 | 3.45 | <0.0001 |
| S × O | 6,3085.2 | 14.14 | <0.0001 |
| N × S × O | 17,3084.9 | 4.36 | <0.0001 |
df, F and P values were given.
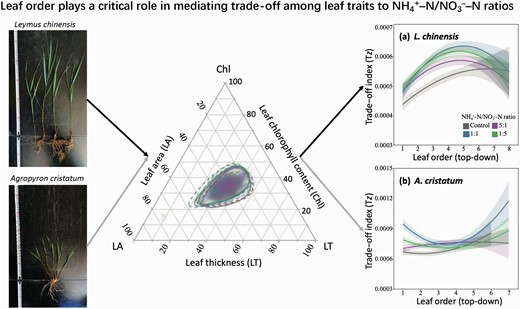
![Ternary plot of the three leaf traits to NH4+-N/NO3−-N ratios. Leaf traits, i.e. leaf area, thickness and chlorophyll content, of (a) Leymus chinensis (solid line) and (b) Agropyron cristatum (dotted line) under the control (grey) and three NH4+-N/NO3−-N ratios (5:1 [purple], 1:1 [blue] and 1:5 [green]). All trait values were standardized. The line represents 95% confidence intervals.](https://oup.silverchair-cdn.com/oup/backfile/Content_public/Journal/jpe/16/4/10.1093_jpe_rtac108/2/m_rtac108_fig4.jpeg?Expires=1749770694&Signature=2tkM5B8VqN0babGJs7IT06DPGTg1xSS2h0YKQWwfF~OktTTPcKFhPRUtM5wqPnfSH4uGBmzv-g2Pxrc4qF9gkpCzA4MMBn9QFwBaEtb2YB-~xvRAzGVexEBiGzTrzPAgyBdCbYFAUwkzA-V5cpraGwP6uOVU-X6haQvEFRFzIMsXkkrS6MEoDqe6iOn-cd8cnsb3q9AJooU3uSBJlAstqWnnODQdR0aBcfynn1HwErjTqFQlf7HQFrpqrYCsV2e4L0vV-B9sgqo3MZBgr7J8TIuDxNptCjw5QROPinzwbgGej~3kiKxZF9z-eJToa7DcQUxYwJzHJ5eva8zaFeYYyA__&Key-Pair-Id=APKAIE5G5CRDK6RD3PGA)
Ternary plot of the three leaf traits to NH4+-N/NO3−-N ratios. Leaf traits, i.e. leaf area, thickness and chlorophyll content, of (a) Leymus chinensis (solid line) and (b) Agropyron cristatum (dotted line) under the control (grey) and three NH4+-N/NO3−-N ratios (5:1 [purple], 1:1 [blue] and 1:5 [green]). All trait values were standardized. The line represents 95% confidence intervals.
![The trade-off index (Tz) among leaf area, thickness and chlorophyll content to NH4+-N/NO3−-N ratios. Effects of NH4+-N/NO3−-N ratios on the Tz of (a) Leymus chinensis and (b) Agropyron cristatum. Regressions of the Tz as a function of leaf order (from top to bottom) of (c) L. chinensis and (d) A. cristatum under the control (grey) and three NH4+-N/NO3−-N ratios (5:1 [purple], 1:1 [blue] and 1:5 [green]). Shaded areas indicate 95% confidence intervals. Error bars represent mean ± SE. Different letters indicated statistically significant differences between treatments (P < 0.05).](https://oup.silverchair-cdn.com/oup/backfile/Content_public/Journal/jpe/16/4/10.1093_jpe_rtac108/2/m_rtac108_fig5.jpeg?Expires=1749770694&Signature=2hbuAMyr~CIHnpptefjYA2t5CiUS7mlue9UlEcb8TEDVnAUCzvU81kvlAenHwwmGBlVroT5DLWqD~b~rq0yMunDOCLdxQFNEFmyXgIv1U6aSSssxr7thfeG7HwAyo72v~1eIBpA0vJh0chs3Mj3Ttg8GqDsbKVxLIV32OVObaFguItxXrdVlezRJwf4KT7BEbvM3Gck-bOwIEp0BE7jFUcipBbW3Ay7oq37d7ypZaJDDjYw9l~h5asn6Mg1baMEtlRxTTOrUyMwtgFR5w6vRW2odA6uakbWfJqUmTptBrH2jaQJ~XrvVHF5mRz9oauuKCDVNAqSNVOEpiFKoDIGtIQ__&Key-Pair-Id=APKAIE5G5CRDK6RD3PGA)
The trade-off index (Tz) among leaf area, thickness and chlorophyll content to NH4+-N/NO3−-N ratios. Effects of NH4+-N/NO3−-N ratios on the Tz of (a) Leymus chinensis and (b) Agropyron cristatum. Regressions of the Tz as a function of leaf order (from top to bottom) of (c) L. chinensis and (d) A. cristatum under the control (grey) and three NH4+-N/NO3−-N ratios (5:1 [purple], 1:1 [blue] and 1:5 [green]). Shaded areas indicate 95% confidence intervals. Error bars represent mean ± SE. Different letters indicated statistically significant differences between treatments (P < 0.05).
DISCUSSION
This study quantified the changes in leaf area, thickness and chlorophyll content of two clone grasses (L. chinensis and A. cristatum) in response to adding NH4+-N/NO3−-N ratios and explored whether these are dependent on the leaf order in a temperate grassland. We found that under the control conditions, the mean leaf area, thickness and chlorophyll content values of two relatively mature and fully expanded leaves’ traits were not significantly different from that of all leaves at the individual plant level, except for the leaf area of L. chinensis. This confirms that the method in plant functional trait manuals can be used directly (Cornelissen et al. 2003; Pérez-Harguindeguy et al. 2013). In contrast, we found more leaves, and even all leaves, were needed with varying ratios of NH4+-N/NO3−-N. Moreover, we found that the changes in leaf traits and trade-off index (i.e. Tz) among them in response to the ratios of NH4+-N/NO3−-N were mediated by leaf order. As expected, the RRs of L. chinensis were less affected by the ratios of NH4+-N/NO3−-N than those of A. cristatum and were dependent on leaf order. Therefore, these results suggest that measuring all leaves of an herbaceous plant could be needed to accurately assess trait plasticity in N-enhanced environments.
How many leaves can represent the mean leaf trait of the plant?
We found that under control (i.e. ambient) N conditions, the mean trait value of two leaves (~45% all leaves) was not significantly different from that at the plant level, except the leaf area of L. chinensis needing five leaves (~80% all leaves). These results indicate that the method in plant functional trait measurement manuals (Cornelissen et al. 2003; Pérez-Harguindeguy et al. 2013) can be directly used to sample two or three relatively mature and fully expanded leaves to reflect the mean leaf trait of all leaves at plant level in ambient conditions. For A. cristatum, the mean value among three leaves can accurately represent that of all leaves. For L. chinensis, unexpectedly, regardless of the ratios of NH4+-N/NO3−-N, the mean value of leaf area and chlorophyll content was not significantly different from that of all leaves at the plant level when five leaves (~80%) were measured. The responses of leaf traits to NH4+-N/NO3−-N ratios are both trait- and species dependent. It may be mainly because the values of leaf traits showed nonlinear responses with leaf order (discussed in the section ‘Leaf order (age) affects the responses of leaf traits to the ratios of NH4+-N/NO3−N’). Therefore, with the ratios of NH4+-N/NO3−-N, the question of how many leaves could represent the traits of the whole plant becomes complicated. Setting a more suitable number of leaves is the key step to representing the responses of the leaf traits to environmental changes at the plant level. Based on our findings, we recommend measuring all leaves of the sample plant in the semi-arid grassland of northern China.
Leaf order (age) affects the responses of leaf traits to the ratios of NH4+-N/NO3−-N
We found that under the three ratios of NH4+-N/NO3−-N, leaf thickness and leaf chlorophyll content increased, and the range in changing leaf traits of A. cristatum was greater than that of L. chinensis. It has been reported that L. chinensis has no clear preference for ammonium or nitrate (Cao et al. 2021), while A. cristatum might tend to preferentially assimilate nitrate (Liu et al. 2020; Xi et al. 2017). In other words, responses of L. chinensis to the ratios of NH4+-N/NO3−-N might be associated with the amount of N availability in the soils, while those of A. cristatum would be largely dependent on soil NO3−-N concentrations. Although inorganic N (NH4+-N and NO3−-N) concentrations in the top 10 cm of soil were similar among the three NH4+-N/NO3−-N ratios during the leaf trait sampling period, NH4+-N and NO3−-N concentrations and their ratios all increased significantly (Supplementary Table S7, unpublished data). Thus, soil NH4+-N/NO3−-N ratios would be an important factor in understanding the variation in leaf traits between the two clonal grasses. Furthermore, we found that, in the adjacent ambient N grassland (5 m from this field N experiment), without including the L. chinensis rhizomes, root depth and length of A. cristatum were significantly larger (Supplementary Table S8), while root biomass, diameter and specific root length were similar. The differences in rhizome and root depth and length might affect N uptake capacity from soils. With rhizomes, L. chinensis can adapt to a wide range of environmental changes (Liu et al. 2019; Wang and Gao 2004) and help to quickly reach and absorb the dominant N forms in the soils (Cao et al. 2021; Xi et al. 2017). The rhizome structure can also help to detoxify ammonium toxicity caused by N enrichment (Tian et al. 2022). In contrast, A. cristatum is a bunchgrass without rhizomes; therefore, its root distribution range is much smaller than that of L. chinensis. The roots of A. cristatum are less flexible and less able to capture resources in patchy environments. As a result, the roots may only partially utilize nitrate, even if it is abundant.
The leaf chlorophyll content of A. cristatum was significantly different under NH4+-N/NO3−-N ratios of 5:1 and 1:1, which was directly affected by soil NO3−-N availability. The leaf chlorophyll content of A. cristatum was similar between 1:1 and 1:5 NH4+-N/NO3−-N ratios, which might be determined by the soil NO3−-N utilization. Therefore, the response of leaf traits of clonal grasses to the ratios of NH4+-N/NO3−-N may be partly regulated by soil N concentrations and forms as well as root structure. As leaf chlorophyll content cannot fully explain N utilization and its response to different N forms, leaf N forms should be measured in further research to uncover the underlying mechanisms.
It has been well established that with suitable temperature and sufficient water, the increase of soil N availability is conducive to the synthesis of leaf chlorophyll and enhancement of leaf area. However, this results in a reduction in leaf thickness (i.e. a trade-off among the three leaf traits) to improve photosynthetic capacity (Wan et al. 2007; Zheng and Ma 2018). In this study, the trade-off index (Tz) of L. chinensis was not significantly different among three ratios of NH4+-N/NO3−-N. This supports the preferential characteristic of L. chinensis (Cao et al. 2021). The Tz of A. cristatum was the highest at 1:1 NH4+-N/NO3−-N ratio. It might be associated with the largest leaf area and chlorophyll content but the smallest leaf thickness, which may be affected by soil NO3−-N availability and root structure, as mentioned above. Moreover, the Tz of L. chinensis was smaller than that of A. cristatum (Fig. 5), suggesting that L. chinensis tends to rapidly adjust its leaf traits to adapt to N addition regardless of the ratios of ammonium and nitrate. In combination, our results indicate that L. chinensis might replace A. cristatum if they cannot coexist or be over dominant if coexisting under long-term N deposition.
In addition, we found that leaf order indeed affected leaf traits and their responses to NH4+-N/NO3−-N ratios. The ratios of NH4+-N/NO3−-N influenced the regression shape between leaf trait and order, i.e. moving the position of the tipping point to smaller (younger) leaves for L. chinensis and larger (older) leaves for A. cristatum. Leaf traits changed with time or leaf age (leaf order) (Chavana-Bryant et al. 2017; Pedreira et al. 2015). For example, Bauerle et al. (2020) found that the photosynthetic rate of hemp (Cannabis sativa L.) crown leaves decreased linearly as leaf age increased. Therefore, leaf age or position could determine the photosynthetic rate prediction of plants (Kitajima et al. 2002). In our study, leaf traits tended to respond nonlinearly to the ratios of NH4+-N/NO3−-N along leaf order. For example, the leaf area of the two target clonal grasses likely increased linearly with leaf age but peaked at the second to fourth leaf position. We also found that regressions between leaf trait and order varied between our target species with NH4+-N/NO3−-N enrichment. It may be related to the way leaves unfold and expand. The leaves of L. chinensis unfold and then expand, while those of A. cristatum reach the length of the adjacent mature leaf and then unfold rapidly. The nonlinear variation of leaf area and chlorophyll content along leaf order may be related to climate temperature and precipitation. The leaves that grew in May were at the largest leaf order when they were sampled in August. May, with low temperature and precipitation (Zhang et al. 2018b), is characterized by the early stage of the growing season in the temperate grassland of Inner Mongolia. Thus, the leaf area is relatively small to better accumulate carbohydrates by reducing heat and water dissipation. In August, the sampling period, the chlorophyll in the old leaves is partially decomposed and transferred to the new fully expanded leaves (i.e. middle leaves) in the form of elements (e.g. N, magnesium and iron) to maximize the potential photosynthetic rate. Meanwhile, plants tend to allocate resources to adjust the trade-off among leaf traits to better adapt to environmental changes, e.g. temperature, water and nutrients (Bauerle et al. 2020; Cui et al. 2020; Kitajima et al. 2002; Reich 2014). For herbaceous plants, this trade-off can be well displayed in the leaf order. Supporting this inference, we found that the trade-off among the three leaf traits changed nonlinearly with leaf order. However, not all leaf traits changed significantly with leaf order, and the trade-off among these traits might be dependent on leaf order.
CONCLUSIONS
Based on N inputs with three ratios of NH4+-N/NO3−-N for six consecutive years in a temperate grassland in northern China, we found that, as manuals suggest, measuring two or three relatively mature and fully expanded leaves can represent the response of leaf traits at the plant level to ambient conditions. However, adding ratios of NH4+-N to NO3−-N might alter the responses of leaf traits along leaf order, and sampling more leaves, even all leaves of the plant, can accurately indicate the leaf traits of the whole plant. This study found that the ratios of NH4+-N/NO3−-N did not significantly affect the trade-off, which was leaf order dependent, between the two clonal grasses, which is beneficial to their coexistence. Therefore, our results point out that leaf order plays a critical role in mediating the responses of leaf traits to the ratios of NH4+-N/NO3−-N and providing basic experimental evidence for understanding plant leaf adaptation strategies to anthropogenic environmental change.
Supplementary Material
Supplementary material is available at Journal of Plant Ecology online.
Table S1: The number and percentage of measured leaves under five sampling modes.
Table S2: T-test analysis results of leaf traits to NH4+-N/NO3−-N ratios under different sampling modes compared with the mode of all leaves measured.
Table S3: Results of linear mixed effect modeling analysis on leaf traits (leaf area, thickness and chlorophyll content), using blocks and plant numbers as random factors and NH4+-N/NO3−-N ratios, species, leaf order and their interactions as fixed factors.
Table S4: Regression equations of leaf traits as a function of leaf order (from top to bottom) to NH4+-N/NO3−-N ratios.
Table S5: Results of linear mixed effect modeling analysis of the response ratios (RRs) on leaf traits (leaf area, thickness and chlorophyll content), using blocks and plant numbers as random factors and NH4+-N/NO3−-N ratios, species, leaf order and their interactions as fixed factors.
Table S6: Regression equations of trade-off index (Tz) as a function of leaf order (from top to bottom) to NH4+-N/NO3−-N ratios.
Table S7: Changes of NH4+-N (mg kg−1 dry soil), NO3−-N (mg kg−1 dry soil), total inorganic N (NH4+-N and NO3−-N, mg kg−1 dry soil) and NH4+-N/NO3−-N ratios in the top 10 cm soil to NH4+-N/NO3−-N ratios.
Table S8: Third-order root traits including root depth (mm), length (mm), biomass (g), diameter (mm) and specific root length (mm·mg−1) of L. chinensis and A. cristatum in adjacent areas (about 5 m apart from field plots) without N additions.
Funding
This work was supported by the National Natural Science Foundation of China (32122055 and 32071603) and the Key Research Program of Frontier Sciences, Chinese Academy of Sciences (ZDBS-LY-DQC034).
Acknowledgements
We appreciate the Inner Mongolia Grassland Ecosystem Research Station, the Chinese Academy of Sciences for the experimental facility support.
Conflict of interest statement. The authors declare that they have no conflict of interest.


