


Abstract
Land use and nutrient enrichment can substantially affect biodiversity and ecosystem functioning. However, whether and how the responses of community temporal stability to land use and nutrient enrichment change with time remain poorly understood. As part of a 15-year (2005–2019) field experiment, this study was conducted to explore the effects of mowing, nitrogen (N) and phosphorus (P) additions on community temporal stability in a temperate steppe on the Mongolian Plateau. Over the 15 years, N and P additions decreased community temporal stability by reducing the population stability, especially the shrub and semi-shrub stability. However, mowing increased community temporal stability in the early stage (2005–2009) only. Nitrogen addition suppressed community temporal stability in the early and late (2015–2019) stages, whereas enhanced it in the intermediate stage (2010–2014). Phosphorus addition decreased community temporal stability marginally in the early stage and significantly in the late stage. The fluctuations of N-induced changes in community temporal stability are mainly explained by its diverse effects on species asynchrony and population stability over time. Our findings highlight the important role of plant functional groups and species asynchrony in regulating community temporal stability, suggesting that more long-term studies are needed to accurately forecast ecosystem response patterns in the context of global change.
摘要
土地利用和养分富集能对生物多样性和生态系统功能产生巨大的影响。然而,群落时间稳定性对土地利用和养分富集的响应是如何随时间变化的尚不清楚。作为历经15年(2005–2019)野外实验的一部分,本研究旨在探索在蒙古高原温带草原上,刈割、氮添加和磷添加对群落时间稳定性的效应。经过15年的实验,氮添加和磷添加均降低了群落时间稳定性,尤其是灌木和半灌木功能群的时间稳定性。刈割仅在实验早期(2005–2009)增加群落时间稳定性。氮添加在实验早期和末期(2015–2019)降低了群落时间稳定性,但在实验中期(2010–2014)反而提高了群落时间稳定性。磷添加在实验早期只轻微降低群落时间稳定性,但在实验末期显著降低群落时间稳定性。氮添加引起的群落时间稳定性变化的波动主要归因于其对物种异步性和种群时间稳定性的不同影响。我们的发现强调了植物功能群和物种异步 性在调控群落时间稳定性方面的重要作用,以及仍然需要进行更长期的研究,以准确预测全球变化背景下的生态系统响应模式。
INTRODUCTION
Temporal stability, often quantified as the inverse of the temporal coefficient of variation (Pimm 1984; Tilman 1999), is one of the essential attributes of ecological communities. Species diversity is often recognized as a fundamental factor influencing community temporal stability (Craven et al. 2018; De Mazancourt et al. 2013; Pennekamp et al. 2018; Tilman et al. 2006) via affecting population stability as well as the compensatory dynamics among species (Muraina et al. 2021; Thibaut and Connolly 2012; Wang et al. 2019; Xu et al. 2021). In addition to the aforementioned diversity effects, community temporal stability may also be regulated by different functional groups and/or dominant species, particularly when communities are characterized by high dominance (Ma et al. 2017, 2021; Xu et al. 2015; Yang et al. 2017). Nevertheless, the relative roles of diversity and functional groups in mediating community temporal stability remain controversial (García-Palacios et al. 2018; Gilbert et al. 2020; Sasaki et al. 2019).
Since the Industrial Revolution, terrestrial ecosystems have been dramatically changed by anthropogenic activities, including land-use change and nutrient enrichment due to the consumption of fossil fuels and fertilizer application (IPCC 2014; Yu et al. 2019). Mowing for hay, as a widely used management practice in grasslands, can facilitate short-statured species by removing plant canopy and litter (Hu et al. 2021), which can enhance ground-level light availability, with consequent increases in species richness and community temporal stability (Antonsen and Olsson 2005; Collins et al. 1998; Yang et al. 2012; Zheng et al. 2020). In contrast, mowing can reduce plant species richness by destroying above-ground plant organs or affecting the ability of plants to regerminate (Socher et al. 2012), which may negatively influence community temporal stability.
Nutrient enrichment has been recognized as one of the major reasons that lead to species loss at the local, regional and global scales (Duprè et al. 2010; Stevens et al. 2004). Nitrogen (N) addition generally drives species loss by aggravating competition for other resources (i.e. light; Borer et al. 2014; Hautier et al. 2009), reducing niche dimension and/or resulting in soil acidification (Band et al. 2022; Clark et al. 2019; Harpole and Tilman 2007; Harpole et al. 2016), with subsequent decreases in community temporal stability (Borer et al. 2017; Chen et al. 2022; Yang et al. 2022). In addition, N addition can suppress community temporal stability by reducing compensatory dynamics among plant species (Hautier et al. 2020; Zhang et al. 2016, 2019) and/or functional group stability (Huang et al. 2020; Xu et al. 2015; Yang et al. 2012). However, N addition may also contribute to community temporal stability by increasing compensatory dynamics among the remaining species (Grman et al. 2010) or the dominant species stability (Yang et al. 2011). By contrast, the effect of phosphorus (P) addition on community temporal stability has received much less attention. Low diversity is observed in soils with higher P levels (Crawley et al. 2005), and the number of endangered plant species is the highest under P-limited conditions (Fujita et al. 2014), indicating that the loss of rare species is closely correlated with P release (Wassen et al. 2005). The P-induced negative effect on diversity subsequently decreases community temporal stability in a temperate steppe (Yang et al. 2012). However, moderate P enrichment may alleviate the plant growth limitation resulting from low-mineralization rates, thus leads to neutral effects on diversity (Avolio et al. 2014; Soons et al. 2017).
Given the temporal accumulation of nutrient enrichment, its effects on diversity may change with time. For example, species richness does not change after 2–4 years of nitrogen addition, but is reduced by 17% after 21–23 years of nutrient addition in a prairie of North America (Clark and Tilman 2008). By contrast, N addition has also been demonstrated to decrease and increase species richness in the early and later stage, respectively, in a meadow steppe of Northeast China (Liu et al. 2019). Given the widely recognized positive relationships of stability and diversity, the temporal changes in species richness under nutrient enrichment suggest that community temporal stability may also change with time. Nevertheless, no evidence on whether the effects of nutrient enrichment, land use and their interaction on community temporal stability change with time has been reported so far.
As part of a long-term field experiment established since April 2005, this study was conducted to examine the effects of mowing and increased nutrient availability (i.e. N and P additions) on community temporal stability in a semi-arid temperate steppe on the Mongolian Plateau. The semi-arid grasslands, representing the typical vegetation across the Eurasian continent, provide essential ecosystem products and services for the region (Kang et al. 2007) and is sensitive to both mowing and nutrient addition (Niu et al. 2010; Yang et al. 2012). Three specific objectives of this study were to address: (i) How mowing and nutrient (N and P) addition affect community temporal stability? (ii) Do the responses of community temporal stability to mowing and nutrient addition change with time? (iii) What are the underlying mechanisms of mowing and nutrient addition regulating community temporal stability?
MATERIALS AND METHODS
Study site and experimental design
The study site is located in a semi-arid temperate steppe in Duolun Country (42°02ʹ N, 116°17ʹ E, 1324 m a.s.l.), Inner Mongolia, China. Long-term (1953–2019) mean annual precipitation is approximately 381.8 mm, with 90.6% rainfall occurring during the growing season (from May to October). Mean annual temperature is 2.4°C, ranging from −17.3°C in January to 19.2°C in July. The sandy soil is classified as Haplic Calcisols according to the Food and Agriculture Organization (FAO classification). The vegetation is dominated by perennial species, including Artemisia frigida, Aster altaicus, Leymus chinensis and Cleistogenes squarrosa.
This study was a part of Duolun Global Change Multifactor Experiment, which was initiated within an area of 199 m × 265 m in 2005. Eight 92 m × 60 m plots were arranged into four rows and two columns, with a 5-m-wide buffer zone between any two adjacent plots. Eight plots were randomly assigned to the mowing treatments (control and mowing) with four replications. Each plot was divided into four 44 m × 28 m subplots with 1-m-wide buffer zone. Four subplots within each plot were randomly assigned to four nutrient treatments, consisting of the control without nutrient addition, N addition treated with urea in 2005 and 2009–2019, and NH3NO4 in 2006–2008 (10 g N m−2 year−1), P addition treated with calcium superphosphate (5 g P2O5 m−2 year−1), and N plus P addition (Niu et al. 2010). Mowing was applied annually in August at the height of 10 cm above the soil surface to simulate hay harvesting, and the harvested plant materials were removed immediately after mowing. Nutrients were added in mid-July each year since 2005.
Vegetation monitoring
Two permanent quadrats were established within each subplot since 2005. Each quadrat was at least 50 cm from the edge of the subplot to avoid edge effects. Plant cover and species richness in the permanent quadrat (1 m × 1 m) were monitored annually at the peak biomass in August from 2005 to 2019. As in many previous studies (Isbell et al. 2015; Xu et al. 2015; Yang et al. 2017), plant cover was used as the proxy of biomass. The percent cover of each species was estimated using a canopy interception technique based on 100 equally distributed grids (10 cm × 10 cm) in each quadrat, and community cover was acquired by summing the percent cover of each species. Community cover could exceed 100% due to the canopy overlap among species. The mean plant cover of the two quadrats in each subplot was used for statistical analyses. The total number of plant species detected in each quadrat was recorded as species richness. The recorded plant species were classified into three functional groups according to growth form: shrubs and semi-shrubs, forbs and grasses. The names and relative cover in the control plots of shrub and semi-shrub, forb and grass species from 2005 to 2019 are listed in Supplementary Table S1.
Statistical analysis
Detrending was done because significant temporal trends in community cover were detected (tested by regressing community cover against the logarithm of year, as in Tilman et al. 2006) in 25 of 32 subplots during the experimental periods (Supplementary Table S2). The detrended community temporal stability was calculated as (Thibaut and Connolly 2012):
where and are the temporal mean cover in each subplot of community and species, respectively, and denotes the sum of a temporal variance-covariance matrix of species cover with elements in a community with S species from 2005 to 2019. The weighted temporal stability of population, shrubs and semi-shrubs, grasses and forbs were also calculated as (Wang et al. 2020):
where denotes the variance of cover in each subplot of species i in a community with S species from 2005 to 2019. The was set to 1 if the ith species of community is a shrub and semi-shrub species, otherwise, it was set to 0. Similar procedures were also applied in and, which were set to 1 for grass species and forb species, respectively; otherwise, they were set to 0. To assess if the responses of community temporal stability were consistent over time, the 15 years was divided into three non-overlapping periods, each having five years (early stage, 2005–2009; intermediate stage, 2010–2014; late stage, 2015–2019). No significant temporal trend in community cover was detected in the three non-overlapping periods. Community temporal stability and weighted population and functional group temporal stability in each subplot for each period were also calculated.
The degree of species asynchrony was quantified by the community-wide asynchrony index (Loreau and de Mazancourt 2008), defined as:
Species asynchrony reaches its minimum value (zero) when species dynamics are perfectly synchronized and maximum value (one) when species dynamics are perfectly asynchronized.
Mixed-effect models were used to examine the effects of year, mowing, N addition, P addition and their interactions on the cover of community, shrubs and semi-shrubs, forbs, and grasses and species richness over the 15 years. Year, mowing, N and P additions were treated as fixed effects, and block was treated as a random effect. The responses of species asynchrony, temporal stability of community, population and functional groups to mowing, N and P additions across the 15 years were also tested by mixed-effect models. The main effects of mowing, N addition, and P addition on species richness and temporal stability were calculated as:
where C, N, P, NP, M, MN, MP and MNP refer to control, N addition, P addition, N plus P addition, mowing, mowing plus N addition, mowing plus P addition, mowing and N plus P addition, respectively. Temporal stability of community, population and functional groups were log-transformed to ensure normality. Simple linear regressions were used to explore the relationships of community temporal stability with species richness, the stability of population and functional groups, and species asynchrony across all treatments over the whole experiment and three non-overlapping periods.
To determine the pathways of how mowing, N and P additions influenced community temporal stability, structural equation modelling (SEM) was performed. The bivariate relationships between community stability and explanatory variables were assessed to ensure the linear models were appropriate. An a priori model was constructed based on the known effects and potential relationships among the driving factors of community stability (Supplementary Fig. S8). Then, the a priori model was further simplified by eliminating non-significant pathways and state variables based on regression weight estimates until we attained the final model. Overall fitness of the piecewiseSEM was evaluated using the Shipley’s test of d-separation, Fisher’s C statistic and AIC to ensure that no potential pathways between variables were lost. We consider the collection of potential relationships being consistent with the data when P for the Fisher’s C test was larger than the threshold of significance (i.e. P > 0.05). SEMs were conducted with the “piecewiseSEM” package (Lefcheck 2015) in R 3.5.1 (R Core Team 2018). All the other statistical analyses were performed in SAS (SAS Institute Inc., Cary, NC, USA).
RESULTS
Plant community response
Over the 15-year experimental period, mowing did not affect community cover, whereas both N and P additions increased it (absolute change; Supplementary Fig. S1a; both P < 0.001, Supplementary Table S3). When analyzing by plant functional groups, mowing increased shrub and semi-shrub cover (P < 0.05), whereas N (P < 0.001) and P additions (P < 0.05) reduced it (Supplementary Fig. S1b). Grass cover showed no response to mowing, but was elevated under N and P additions (both P < 0.001, Supplementary Fig. S1c). By contrast, mowing marginally decreased forb cover (P < 0.10), N addition had no effect on it, but P addition stimulated it (P < 0.05, Supplementary Fig. S1d).
Mowing enhanced community species richness across the 15 years (P < 0.05, Supplementary Table S3), but both N and P additions reduced it (both P < 0.001, Supplementary Fig. S2a). When separating the 15-years experimental period into the early (2005–2009), intermediate (2010–2014), and late (2015–2019) stages, mowing enhanced species richness in the intermediate stage only (P < 0.05, Supplementary Fig. S2b). By contrast, the negative impacts of N addition on species richness were exacerbated with time (all P < 0.001). Similarly, P addition decreased species richness in all the three stages with a marginal decrease in the early stage (P < 0.1) and significant decreases in the intermediate and late stages (both P < 0.001).
Temporal stability and species asynchrony
Over the 15 years of experimental period, community temporal stability showed no responses to mowing (Table 1), but declined under nutrient additions with significant decreases under N addition (P < 0.001) and a marginal decrease under P addition (P < 0.10, Fig. 1a). Mowing marginally and significantly increased the weighted temporal stability of population (P < 0.10) and shrubs and semi-shrubs (P < 0.05), respectively, but N and P additions decreased them (all P < 0.05). The weighted grass temporal stability showed no response to mowing and P addition, but increased under N addition (P < 0.001). The weighted forb temporal stability was unaffected by any of the three treatments or their interactions.
Summary (P-values) of three-way ANOVAs with a split plot design on the effects of mowing (M), nitrogen addition (N), phosphorus addition (P), and their interactions on community temporal stability, the weighted temporal stability of population, shrubs and semi-shrubs, grasses, and forbs, and species asynchrony across the 15 years (2005–2019) and three non-overlapping periods (early stage, 2005–2009; intermediate stage, 2010–2014; late stage, 2015–2019)
| Periods | Source of variation | Temporal stability | Species asynchrony | ||||
|---|---|---|---|---|---|---|---|
| Community | Population | Shrub and semi-shrubs | Grasses | Forbs | |||
| 2005–2019 | M | 0.109 | 0.076 | 0.030 | 0.631 | 0.237 | 0.747 |
| N | <0.001 | <0.001 | <0.001 | <0.001 | 0.225 | 0.334 | |
| P | 0.090 | 0.030 | 0.012 | 0.328 | 0.836 | 0.284 | |
| M × N | 0.619 | 0.715 | 0.821 | 0.387 | 0.452 | 0.241 | |
| M × P | 0.557 | 0.715 | 0.499 | 0.684 | 0.142 | 0.828 | |
| N × P | 0.393 | 0.584 | 0.444 | 0.387 | 0.631 | 0.828 | |
| M × N × P | 0.557 | 0.670 | 0.821 | 0.230 | 0.494 | 0.828 | |
| 2005–2009 | M | 0.037 | 0.042 | 0.125 | 0.764 | 0.092 | 0.973 |
| N | <0.001 | <0.001 | <0.001 | 0.001 | <0.001 | 0.006 | |
| P | 0.063 | 0.005 | 0.021 | 0.879 | 0.108 | 0.227 | |
| M × N | 0.706 | 0.578 | 0.073 | 0.013 | 0.231 | 0.942 | |
| M × P | 0.706 | 0.080 | 0.904 | 0.070 | 0.108 | 0.131 | |
| N × P | 0.660 | 0.438 | 0.092 | 0.009 | 0.399 | 0.856 | |
| M × N × P | 1.000 | 0.911 | 0.235 | 0.820 | 0.231 | 0.772 | |
| 2010–2014 | M | 0.555 | 0.074 | 0.062 | 0.720 | 0.842 | 0.333 |
| N | 0.033 | 0.042 | 0.008 | 0.001 | 0.022 | <0.001 | |
| P | 0.125 | 0.827 | 0.927 | 0.495 | 0.564 | 0.119 | |
| M × N | 0.234 | 0.338 | 0.453 | 0.331 | 0.163 | 0.306 | |
| M × P | 0.284 | 0.189 | 0.157 | 0.929 | 0.648 | 0.737 | |
| N × P | 0.062 | 0.554 | 0.868 | 0.613 | 0.221 | 0.126 | |
| M × N × P | 0.010 | 0.925 | 0.956 | 0.788 | 0.831 | 0.008 | |
| 2015–2019 | M | 0.363 | 0.672 | 0.075 | 1.000 | 0.048 | 0.550 |
| N | 0.004 | 0.017 | <0.001 | 0.069 | 0.632 | 1.000 | |
| P | 0.020 | 0.034 | 0.011 | 0.536 | 0.796 | 0.868 | |
| M × N | 0.575 | 0.430 | 0.321 | 0.965 | 0.046 | 0.544 | |
| M × P | 0.079 | 0.967 | 0.566 | 0.790 | 0.182 | 0.012 | |
| N × P | 0.160 | 0.219 | 0.659 | 0.824 | 0.712 | 0.474 | |
| M × N × P | 0.864 | 0.588 | 0.947 | 0.275 | 0.712 | 0.912 | |
Note the bold numerals highlight the significance at P < 0.05.
Mowing enhanced community temporal stability only in the early stage (Fig. 1b; P < 0.05, Table 1). By contrast, N addition decreased community temporal stability in the early (P < 0.001) and late stages (P < 0.01), and increased community temporal stability in the intermediate stage (P < 0.05). Phosphorus addition reduced community temporal stability marginally in the early stage (P < 0.10) and significantly in the late stage (P < 0.05). Mowing also increased the weighted population temporal stability significantly in the early stage (P < 0.05) and marginally in the intermediate stage (P < 0.10, Fig. S3a). However, N addition decreased the weighted population temporal stability in all the three stages (all P < 0.05). The weighted population temporal stability was also reduced under P addition in the early (P < 0.01) and late stages (P < 0.05). When analyzed by plant functional groups, mowing marginally increased the weighted shrub and semi-shrub temporal stability in the intermediate and late stages (both P < 0.10), whereas N addition reduced it in all the three stages (all P < 0.01, Fig. S3b), and P addition also decreased it in the early and late stages (both P < 0.05). However, N addition increased the weighted grass temporal stability significantly in the early and intermediate stages (both P < 0.001), and marginally in the late stage (P < 0.10, Fig. S3c). The weighted forb temporal stability was marginally increased under mowing in the early stage (P < 0.10) and decreased in the late stage (P < 0.05, Fig. S3d). Nitrogen addition decreased the weighted forb temporal stability in the early (P < 0.001) and intermediate stages (P < 0.05), but P addition did not affect it in any of the three stages.
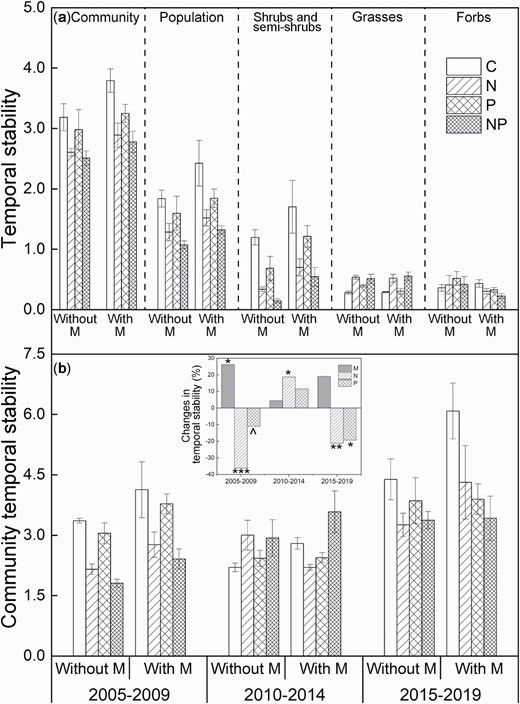
Community temporal stability and the weighted temporal stability of population, shrub and semi-shrubs, grasses, and forbs across the 15 years (a), and community temporal stability in three non-overlapping periods (b; early stage, 2005–2009; intermediate stage, 2010–2014; late stage, 2014–2019) without and with mowing. Inset in Panel (b) represents the main effects of mowing, nitrogen (N), and phosphorus (P) addition on community temporal stability in the early, intermediate, and late stages. Means ± 1 SE, n = 4. M, mowing; N, nitrogen addition; P, phosphorus addition. ^P < 0.1, *P < 0.05, **P < 0.01, ***P < 0.001.
Mowing, N addition, P addition or their interactions did not affect species asynchrony across the 15 years (Fig. 2a; Table 1). Species asynchrony showed no response to mowing and P addition in any of the three non-overlapping periods (Fig. 2b). By contrast, N addition suppressed species asynchrony in the early stage (P < 0.01), but increased it in the intermediate stage (P < 0.001).
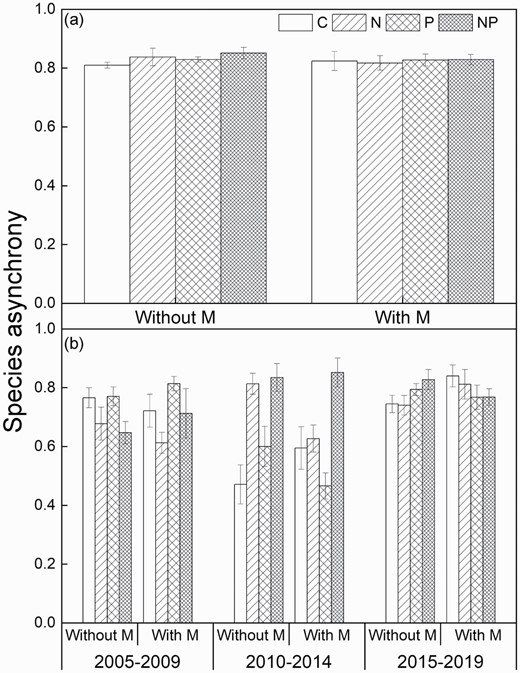
Species asynchrony under the four treatments over the 15 years (a) and in three non-overlapping periods (b) without and with mowing. Means ± 1 SE, n = 4. See Fig. 1 for abbreviations.
Driving factors over community temporal stability
Across the 15 years, community temporal stability demonstrated positively linear correlations with species richness and the weighted temporal stability of population and shrubs and semi-shrubs (Fig. 3a–c), negatively linear correlation with that of grasses (Supplementary Fig. S4a), but no relationship with the weighted forb temporal stability (Supplementary Fig. S4b) or species asynchrony (Fig. 3d). The weighted population temporal stability (Supplementary Fig. S4c), but not species asynchrony (Supplementary Fig. S4d), was positively related with species richness. In addition, the weighted population stability showed positive and negative dependences on the weighted temporal stability of shrubs and semi-shrubs (Supplementary Fig. S5a) and grasses (Supplementary Fig. S5b), respectively, but not on the weighted forb temporal stability (Supplementary Fig. S5c).
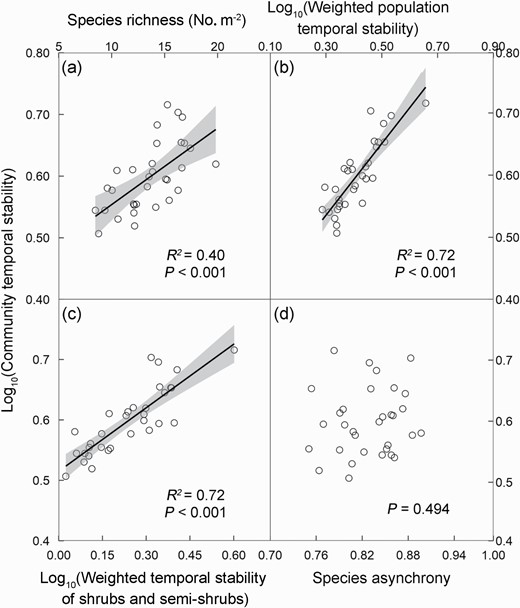
Relationships of community temporal stability with species richness (a), the weighted temporal stability of population (b) and shrubs and semi-shrubs (c) and species asynchrony (d) over the 15 years. Values of the temporal stability of community, population, and shrubs and semi-shrubs are log-transformed. Each data point represents 15 years mean value in each of the 32 subplots. The solid line and shaded area represent regression line and 95% confidence interval, respectively.
When analyzed by the three non-overlapping periods, community temporal stability linearly increased with increasing species richness in the early stage, but decreased with it in the intermediate stage (Fig. 4a). Community temporal stability in the early and late stages showed positive dependences on the weighted temporal stability of both population (Fig. 4b) and shrubs and semi-shrubs (Fig. 4c). In addition, community temporal stability linearly increased with species asynchrony in all the three stages (Fig. 4d). Community temporal stability showed no relationship with the weighted temporal stability of grasses in any of the three stages (Supplementary Fig. S6a), but positively correlated with that of forbs in the early stage (Supplementary Fig. S6b). The weighted population temporal stability increased with increasing species richness in the early stage only (Supplementary Fig. S6c). However, species asynchrony decreased with increasing species richness in the intermediate stage only (Supplementary Fig. S6d). In addition, the weighted population temporal stability also showed positive dependence on the weighted shrub and semi-shrub temporal stability in all the three stages (Supplementary Fig. S7a), but not on the weighted grass temporal stability (Supplementary Fig. S7b). In contrast, the weighted population temporal stability positively correlated with the weighted forb temporal stability in the early stage only (Supplementary Fig. S7c).
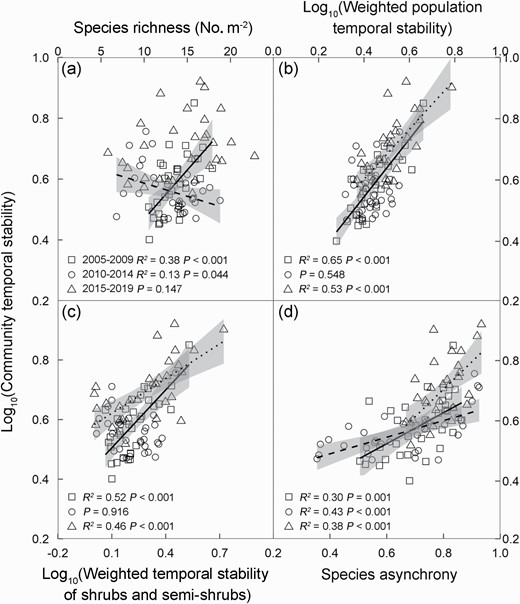
Dependences of community temporal stability on species richness (a), the weighted temporal stability of population (b) and shrubs and semi-shrubs (c) and species asynchrony (d) in the early (2005–2009, squares and solid line), intermediate (2010–2014, circles and dashed line), and late stages (2015–2019, triangles and dotted line), respectively. Values of the temporal stability of community, population, and shrubs and semi-shrubs are log-transformed. The shaded areas represent regression 95% confidence intervals, respectively. Each data point represents 5 years mean value in each of the 32 subplots.
The final SEM showed that species asynchrony and the weighted population stability together explained 90% of the variations in community temporal stability across the 15 years (Fig. 5a). The result revealed that N and P additions reduced community temporal stability by decreasing the weighted population temporal stability. In the early stage, mowing enhanced community temporal stability by increasing the weighted population temporal stability, N addition reduced it via decreasing both the weighted population temporal stability and species asynchrony, but P addition decreased it by reducing the weighted population temporal stability only (Fig. 5b). The positive impact of N addition on community temporal stability in the intermediate stage was mainly ascribed to the increased species asynchrony overcoming the decreased weighted population temporal stability (Fig. 5c). By contrast, N and P additions reduced community temporal stability by decreasing the weighted population temporal stability only in the late stage (Fig. 5d). Notably, species richness accounted for litter variation in community temporal stability for all time periods considered (Fig. 5).
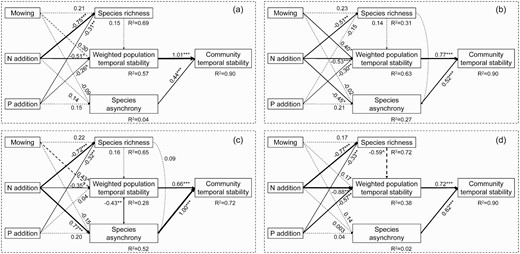
The results of structural equation modelling showed the pathways through which mowing, N addition, and P addition affected community temporal stability over the 15 years. Arrows indicate significant (solid, P < 0.05) and nonsignificant (dashed, P > 0.05) relationships. The width of arrows indicates the strength of the causal effect. Number above the arrows indicates path coefficients (0.05 < ^P < 0.1, *P < 0.05, **P < 0.01, ***P < 0.001). R2 values represent the proportion of variance explained for each variable. The final SEMs based on the whole experiment period (2005–2019; Panel a, Fisher’s C = 9.76, AIC = 65.76, d.f. = 12, P = 0.64), early (2005–2009; Panel b, Fisher’s C = 15.40, AIC = 73.40, d.f. = 10, P = 0.12), intermediate (2010–2014; Panel c, Fisher’s C = 18.49, AIC = 74.49, d.f. = 10, P = 0.05) and late stages (2015–2019; Panel d, Fisher’s C = 19.87, AIC = 75.87, d.f. = 12, P = 0.07).
DISCUSSION
The effects of mowing on community temporal stability
Increased species richness but unchanged community temporal stability across the 15 years and in the intermediate stage, in combination with unchanged species richness but enhanced community temporal stability in the early stage under mowing were observed in this study (Fig. 1). A positive relationship between community temporal stability and species diversity was also found over the 15 years in this temperate grassland (Fig. 3a). However, species richness is not a significant predictor of community temporal stability in all the SEMs (Fig. 5), indicating that species diversity might not always be the major driving factor for community temporal stability. The lack of diversity effect on community temporal stability could be potentially explained by the relatively small changes in species richness under mowing, consisting with previous studies (Yang et al. 2017; Zhang et al. 2016). The neutral effect of mowing might be ascribed to the absence of diversity effects on community temporal stability and small changes in the weighted population temporal stability and species asynchrony under mowing. However, increased community temporal stability under mowing in the early stage is consistent with mowing-induced positive effects on community temporal stability in the first 7 years (2005–2011) of the same experiment (Yang et al. 2012), which is mainly accounted for by the marginal increases in population temporal stability (Fig. 5b). This result is in accordance with no link between community temporal stability and species diversity reported in several previous studies (Grman et al. 2010; Lepš 2004). These findings suggest that grasslands, a vegetation type long adapted to grazing and/or mowing for hay, have the capability to maintain ecological function and stability under fluctuating environmental conditions.
Temporal changes of the responses of diversity to nutrient addition
Reduced species richness under both N and P additions is consistent with previous observations that ecosystems under nutrient enrichment have lower diversity (Clark and Tilman 2008; DeMalach et al. 2017; Ma et al. 2020). In addition, intensified negative effects of nutrient addition on plant species richness over time (Supplementary Fig. S2), in line with the observations in several recent studies (Humbert et al. 2016; Seabloom et al. 2021), indicate the accumulative effects of nutrient enrichment on diversity in grasslands. Nutrient addition-induced species loss might be ascribed to the intensified competition for limiting resources (Borer et al. 2014; Harpole et al. 2016; Hautier, et al. 2009). The addition of N and P may make these resources no longer limiting, shifting multi-dimensional trade-off for belowground resources and light to one-dimensional trade-off for light (Duprè et al. 2010; Hautier et al. 2009). Enhanced nutrient inputs favor relatively fast-growing taller species (e.g. L. chinensis and Stipa krylovii) that can intercept greater proportion of light per unit size to competitively exclude species with shorter stature (e.g. Astragalus galactites and Astragalus scaberrimus). According to the niche dimension hypothesis, reduced niche dimensionality in community under nutrient additions could be another reason leading to species loss (Harpole and Tilman 2007). Moreover, species loss under nutrient addition could also be ascribed to the N-specific mechanisms (e.g. ammonium toxicity, soil acidification, plant-soil feedbacks; Band et al. 2022) except for the two mechanisms mentioned earlier. The intensified species loss over time may also be mediated by N form applied in the early and subsequent (intermediate and late) stages. Nitrogen addition in different forms could affect species dominance and interactions because of the species-specific N preference in plants (Gherardi et al. 2013). However, neutral effects of N form on species richness have also been reported in several previous studies (Ren et al. 2021; Seabloom et al. 2013; Song et al. 2015). More detailed experimental studies are needed to distinguish the influences and underlying mechanisms of N forms on species richness in the long-term.
Temporal changes of the responses of community temporal stability to nutrient addition
Decreased community temporal stability under both N and P additions over the 15 years and in the early and late stages, is consistent with nutrient addition-induced reductions in community temporal stability over the first 7 years in the same experiment (Yang et al. 2012) and many other studies in grassland (Borer et al. 2017; Carroll et al. 2021; Hautier et al. 2020; Xu et al. 2015; Yang et al. 2022; Zhang et al. 2019) and forest ecosystems (Kardol et al. 2018). However, the N-induced early- and late-stage decreases but an intermediate-stage increase in community temporal stability (Fig. 1) contrast with the intuitively or theoretical expectations of the exacerbated reductions in species richness with lengthening experimental period (Supplementary Fig. S2). Our observations are supported by several previous studies reporting no linkages between decreased species diversity and community temporal stability under nutrient enrichment (Grman et al. 2010; Lepš 2004; Xu et al. 2015). The lack of diversity effect on community temporal stability under nutrient addition may not be potentially explained by relatively small changes in species richness, because of the more than one third species loss under N addition (−35.9% in the late stage) observed in this study. The more likely reason is that the majority of the lost/gained species under experimental treatments are rare species (e.g. A. scaberrimus, A. galactites and C. erecta), which account for a small proportion of community cover.
Positive relationships between community temporal stability and the weighted population temporal stability in all the SEMs in this study indicate that community temporal stability could be affected by nutrient enrichment via altering the stability of its constituent population, which are supported by previous findings (Thibaut and Connolly 2012; Wang et al. 2020; Zhang et al. 2016). The SEM identified the major pathway by which N and P addition decreased community temporal stability across the 15 years and in the late stage is the loss of weighted population temporal stability only (Fig. 5a and d). The weighted population temporal stability was strongly influenced by the shrub and semi-shrub species group (Supplementary Fig. S5 and S7), which account for a large proportion of community cover (Supplementary Table S1). The positively linear relationships between community and the weighted shrub and semi-shrub temporal stability across the 15 years (Fig. 3c), and in the early and late stages (Fig. 4c) are consistent with the conclusions that shrub and semi-shrub species play a more important role in determining community temporal stability in the absence of diversity effect (Yang et al. 2017). Moreover, the dominant species, A. frigida, accounted for the overwhelming majority of shrub and semi-shrub cover, which is relatively insensitive to environment disturbance because of the greater nutrient acquisition ability via adventitious roots arising from aboveground stolons, belowground deeper root system, and higher seed production (Gao et al. 2007). Thus, the shrub and semi-shrub species shows higher weighted temporal stability than other species, indicating that shrub and semi-shrub species are better able to maintain a stable community.
Inconsistent with the mediate mechanisms over the 15 years and late stage, N- and P-induced decreases in community temporal stability in the early stage (2005–2009) are mainly explained by the reductions in species asynchrony and the weighted population temporal stability (Fig. 5b). Species asynchrony, an important factor affecting community temporal stability (Hautier et al. 2020; Valencia et al. 2020; Zhang et al. 2019), can arise form varied responses of species to environmental fluctuations (Loreau and de Mazancourt 2013) and interspecific competition (Tilman 1996). On the one hand, species asynchrony can stabilize community via compensating growth between species or plant functional groups (Bai et al. 2004). On the other hand, species asynchrony will be higher in a community with stronger competitions, which are ascribed to a similar way in resource use among species (Lepš et al. 2018). However, it is difficult for us to distinguish between the two mechanisms, resulting from the lack of monoculture experiment of species. The positive dependences of community temporal stability on species asynchrony in the final SEMs over the 15 years and all the three 5-year stages (Fig. 5) are in line with previous field experiments in semi-arid grasslands (Yang et al. 2017; Zhang et al. 2016), highlighting the crucial roles of species asynchrony in regulating community temporal stability in this system.
More importantly, the impacts of N addition on community temporal stability vary over time, with an increase in the intermediate stage (Fig. 1b), which is in disagreement with the consistent responses of diversity and stability to anthropogenic drivers over time reported in a previous study (Hautier et al. 2015). The inconsistent responses patterns of community temporal stability and species loss over time further provide the evidence that plant diversity is not the primary determining factor of community temporal stability in this temperate grassland under nutrient enrichment. increased community temporal stability under N addition in the intermediate stage (2010–2014) are caused by both the enhanced species asynchrony overcoming the reduced weighted population temporal stability in intermediate-stage (Fig. 5c). Enhanced species asynchrony under N additions in the intermediate stage (Fig. 2b) is supported by the results of previous studies that nutrient enrichment increases species asynchrony by enhancing compensatory dynamics among species (Lepš et al. 2018; Zhou et al. 2020), but contrary to other previous studies (Liu et al. 2019; Zhang et al. 2016). This discrepancy might be explained by the increased interspecific competition for light in the nutrient addition plots (Grman et al. 2010; Hautier et al. 2009). Species with strong competition capacity would reduce species with low-competition capacity because of the asymmetric competition for light, resulting in compensatory dynamics among species (Tilman 1996). For example, the cover of a semi-shrub, A. frigid, with short stature and constituting 44.7% of community cover (Supplementary Table S1) decreased under the N addition treatment. By contrast, the cover of two grass species, including L. chinensis and S. krylovii with high stature, increased in response to N addition, leading to greater asynchronous population dynamics. In the late stage (2015–2019), decreased community temporal stability under N and P additions could be accounted for by the reductions in the weighted population temporal stability only (Fig. 5d), which is mainly mediated by shrub and semi-shrub species. Nutrient addition-induced negative, positive, negative effects and the mechanisms involved in the early, intermediate and late stages, respectively, indicate that the short-term conclusions may not necessarily be extrapolated to predict the long-term consequence of global change on ecosystem functioning and services.
CONCLUSIONS
Our study provides empirical observations of neutral effects of mowing but negative effects of nutrient enrichment on community temporal stability across the 15-year experiment in a temperate grassland. More importantly, the effects of mowing and nutrient enrichment on community temporal stability changed over time. The mowing-induced enhancement of community temporal stability in the early stage suggests the efficacy of mowing, one of the two major land-use practices (i.e. grazing and mowing for hay), and the potential self-regulation and adaption of grasslands, which need to be further explored. The N- and P-induced negative effects on community temporal stability are mainly ascribed to the decreased population temporal stability, which are largely determined by shrub and semi-shrub species. These findings highlight the important role of plant functional groups in regulating community temporal stability, providing evidence that other ecological factors can regulate ecosystem stability and services with the absence of diversity effects. Moreover, to our knowledge, this work is the first to observe the temporal changes of community temporal stability in response to anthropogenic disturbance, indicating that long-term experiments have advantages in capturing the general patterns of global change effects on grassland ecosystem and the mechanisms underlying, especially dynamic changes over time. However, our study is conducted in a semi-arid temperate steppe only because of constraints on human and financial resources. Therefore, more long-term field studies on multiple vegetation types are needed to accurately predict ecosystem responses to global change.
Supplementary Material
Supplementary material is available at Journal of Plant Ecology online.
Table S1: The Latin names and relative dominance (RD) of shrubs and semi-shrubs, grasses and forbs in plant community at the experimental site.
Table S2: Results of linear regressions of community cover against the sampling year.
Table S3: Summary (P-values) of four-way, split-plot ANOVAs on the effects of M, N, P, Year and their interactions on the cover of community, shrubs and semi-shrubs, grasses and forbs over the 15 years, and community species richness in the whole experiment period (2005–2019), early (2005–2009), intermediate (2010–2014) and late stages (2015–2019).
Figure S1: Plant cover of community (a), shrubs and semi-shrubs (b), grasses (c) and forbs (d) from 2005 to 2019 under the eight treatments (means ± 1 SE, n = 4).
Figure S2: Species richness (a) from 2005 to 2019 under the eight treatments and main effects (b) of mowing, nitrogen addition and phosphorus addition on species richness in the early (2005–2009), intermediate (2010–2014) and late stages (2015–2019).
Figure S3: Main effects of mowing, N and P addition on the weighted temporal stability of population (a), shrubs and semi-shrubs (b), grasses (c) and forbs (d) in the early, intermediate and late stages.
Figure S4: Dependences of community temporal stability on the weighted temporal stability of grasses (a) and forbs (b), and dependences of the weighted population temporal stability (c) and species asynchrony (d) on species richness across the 15 years, respectively.
Figure S5: Relationships of the weighted temporal stability of population with those of shrubs and semi-shrubs (a), grasses (b) and forbs (c) over the 15 years, respectively.
Figure S6: Relationships of community temporal stability with the weighted temporal stability of grasses (a) and forbs (b), and relationships of the weighted population temporal stability (c) and species asynchrony (d) with species richness in the early (2005–2009, squares and solid line), intermediate (2010–2014, circles and dashed line) and late stages (2015–2019, triangles and dotted line), respectively.
Figure S7: Dependences of the weighted population temporal stability on those of shrub and semi-shrubs (a), grasses (b) and forbs (c) in the early (2005–2009, squares and solid line), intermediate (2010–2014, circles and dashed line), and late stages (2015–2019, triangles and dotted line), respectively.
Figure S8: A priori structural equation modeling relating mowing, N addition and P addition, species richness, species asynchrony, the weighted population temporal stability to community temporal stability.
Funding
This work was supported by the National Natural Science Foundation of China (31830012 and 32101346) and Hebei Natural Science Foundation (C2022201042).
Acknowledgements
We thank Mingxing Zhong and Mengmei Zheng from the Henan University for their help in the field work; Jing Wang (Hebei University) and Zhenxing Zhou (Henan University) for their constructive comments and suggestions in improving the manuscript.
Conflict of interest statement. The authors declare that they have no conflict of interest.


