


Abstract
Nutrient resorption is a crucial mechanism for plant nutrient conservation, but most previous studies did not consider the leaf-mass loss during senescence due to lack of measured data. This would lead to an underestimation of nutrient resorption efficiency (NuRE), or calculating NuRE of various species based on the average mass loss at plant-functional-group level in the literature, thus affecting its accuracy. Here we measured the leaf-mass loss to correct NuRE with the species-specific mass loss correction factor (MLCF), so as to foster a more accurate calculation of the nutrient fluxes within and between plants and the soil. Green leaves and senesced leaves were collected from 35 dominant woody plants in northern China. Mass of green and senesced leaves were measured to calculate the MLCF at species level. The MLCF was reported for each of the 35 dominant woody plants in northern China. These species averagely lost 17% of the green-leaf mass during leaf senescence, but varied greatly from 1.3% to 36.8% mass loss across the 35 species, or 11.7% to 19.6% loss across the functional types. Accordingly, the MLCF varied from 0.632 to 0.987 across the 35 species with an average value 0.832. The NuRE corrected with MLCF was remarkably increased on the whole (e.g. both the average nitrogen and phosphorus NuRE became about 9% higher, or more accurate), compared with the uncorrected ones, especially in the case of low resorption efficiencies. Our field data provide reliable references for the MLCF of plants in related regions at both species and functional-type levels, and are expected to promote more accurate calculations of NuRE.
摘要
养分重吸收是植物保持养分的关键机制,但以往多数研究未考虑叶片衰老过程中的质量损失,低估了植物的叶片养分重吸收效率(NuRE);或只能基于文献中植物功能群水平的平均质量损失,校正所研究的不同物种的叶片NuRE,从而影响了该参数的精确性。本研究通过采集中国北方地区35种常见木本植物的绿色叶片和凋落叶片样本,测量绿色叶片和凋落叶片的质量,计算了叶片衰老过程中的质量损失,并给出了这些物种凋落叶片的质量损失校正系数(MLCF)。总体而言,植物凋落叶片的质量比成熟绿 色叶片平均损失17%,物种水平质量损失变化范围为1.3%–36.8%,功能群水平为11.7%–19.6%。相 应地,这35种木本植物的凋落叶片的MLCF值平均为0.832,变化范围为0.632–0.987。与校正前相 比,用MLCF校正后的NuRE总体上显著增加。例如,校正后氮和磷的平均NuRE皆增高约9%,即比其校正前(低估)更接近真实值;当植物NuRE较低时,这种校正作用(改善)表现得尤为明显。本研究基于物种水平的野外实测数据,报道了中国北方部分常见木本植物的MLCF参考值,研究结果将有助于更准确地计算此类植物的养分重吸收效率,提升本地区植物-土壤系统中养分流通评估的精准度。
INTRODUCTION
Nutrient resorption is one of the most important strategies for higher plants, especially perennial higher plants, to conserve nutrients and maintain elemental balance. The resorbed nutrients can be re-utilized to build new tissues, increasing the residence time of nutrients within plants, enhancing the fitness of plants, making them less dependent on external nutrient availability and surviving better under harsh conditions (Aerts 1996; Han et al. 2013; Scalon et al. 2017; Wright and Westoby 2003). Nutrient resorption efficiency (NuRE) is widely used as a parameter to quantify the resorption process. It describes the percentage of nutrients withdrawn from senesced leaves to other tissues (seeds, roots and other live parts) before leaf abscission.
The nutrient concentrations are usually expressed on the basis of leaf mass or leaf area. The process of nutrient resorption happens before leaf senescence with the concomitant reduction of leaf mass and area. Oland (1963) first realized that there was mass loss during leaf senescence, and conducted an experiment with 12 years old trees (apple tree variety Gravenstein) to study the mass loss during leaf senescence. His results showed that the loss of leaf dry mass and nitrogen of selected leaves happened during the abscission periods. Vernescu et al. (2005) indicated that leaf mass had 50%–60% loss during senescence in wetland plants. By reviewing the literature, van Heerwaarden et al. (2003) reported the leaf mass loss and leaf shrinkage data and presented a formula to describe the different effects of measurement basis on the “real” resorption efficiency value and the measured resorption efficiency. It concluded that there was 21% of leaf mass loss and 11% of leaf area shrinkage during leaf senescence (van Heerwaarden et al. 2003). Given that senesced leaves are usually fragile and easy to breakdown, or get wrinkled and unevenly coiled, it is hard to measure the areas of such leaves. So it seems to be more convenient and easier to correct NuRE on leaf mass rather than area basis. Actually, some studies did adopt leaf mass as the basis (Güsewell 2005; Han et al. 2013; Vergutz et al. 2012; Yuan and Chen 2015; Zhang et al. 2018), although fewer ones (e.g. Scalon et al. 2017; Wright and Westoby 2003) used the latter.
However, most previous studies did not consider the loss for lack of measured data, which leads to an overestimation of senesced-leaf nutrient concentration () and thus underestimation of NuRE (equation 1) (Killingbeck 1984; Kazakou et al. 2007; Oland 1963),
where and are the nutrient concentration of green and senesced leaves, respectively.
To overcome this underestimation of NuRE, has to be corrected with a mass loss correction factor (MLCF),
where is the nutrient concentration in senesced leaves with concentrations corrected, and MLCF was computed with the equation as follows:
where and are the dry mass of green and senesced leaves, respectively.
Unfortunately, the leaf mass loss ( − ) frequently was not measured for various reasons, making it impossible to calculate the MLCF at individual or species level. In such cases, researchers who noticed the above problem had to take a compromise approach: using the average value at functional-type level, reported by peer-reviewed literature (e.g. van Heerwaarden et al. 2003; Vergutz et al. 2012), as an approximation of the MLCF at species level (e.g. Luo et al. 2020, 2021; Tang et al. 2013; Yuan and Chen 2015; Zhang et al. 2018). For example, based on a global meta-data analysis, Vergutz et al. (2012) proposed that the MLCF for forbs, graminoids, conifers, evergreen angiosperms and deciduous angiosperms were 0.640, 0.713, 0.745, 0.780 and 0.784, respectively.
Due to the large variations in leaf physical and chemical attributes (e.g. leathery vs. papery leaves, coniferous needles vs. broad-leaved lamina), and thus in the mass loss during leaf senescing, across different plant species within each plant functional type, using functional-type averaged MLCF to correct a specific plant species will certainly introduce an error with unknown size. In this study, based on a four-year field sampling project, we measured and calculated the species-specific leaf mass loss before senescence and the corresponding MLCF of the dominant woody plants in northern China, to contribute first-hand data for more accurate calculation of leaf nutrient resorption efficiency.
MATERIALS AND METHODS
We collected fully expanded green leaves in summer (in July when the leaves are fully grown) and freshly senesced leaves (by slightly shaking a branch) in autumn (in September to October when leaves hang from the branches but do not fall) of the dominant woody species in northern China during 2014–2017. This study involves 35 species belonging to 15 families (Table 1). The sample sites located in the Greater Khingan Mountains, Lesser Khingan Mountains, Changbai Mountains, Qilian Mountains and Taihang Mountains (Baiwang Mountain, Dongling Mountain, Fenghuang Mountain, Luya Mountain, Zhongtiao Mountain and Ziwuling Mountain) (Supplementary Table S1), ranging from 36°59′39″ to 47°3′27″ N, and 94°10′00″ to 128°3′33″ E.
Mass loss correction factor (MLCF) of the 35 dominant species in northern China
| Species | n | T/S | A/G | Family | MLCF |
|---|---|---|---|---|---|
| Abies fabri | 90 | T | G | Pinaceae | 0.923 |
| Abies nephrolepis | 90 | T | G | Pinaceae | 0.987 |
| Acer palmatum | 40 | T | A | Sapindaceae | 0.742 |
| Acer pictum subsp. mono | 32 | T | A | Sapindaceae | 0.897 |
| Acer tegmentosum | 14 | T | A | Sapindaceae | 0.910 |
| Acer truncatum | 11 | T | A | Sapindaceae | 0.763 |
| Acer ukurunduense | 8 | T | A | Sapindaceae | 0.945 |
| Betula albosinensis | 11 | T | A | Betulaceae | 0.772 |
| Carpinus cordata | 8 | T | A | Betulaceae | 0.870 |
| Carya cathayensis | 15 | T | A | Juglandaceae | 0.721 |
| Corylus mandshurica | 32 | S | A | Betulaceae | 0.889 |
| Cotoneaster acutifolius | 32 | S | A | Rosaceae | 0.850 |
| Dasiphora fruticosa | 30 | S | A | Rosaceae | 0.632 |
| Euonymus alatus | 37 | S | A | Celastraceae | 0.828 |
| Forsythia suspensa | 50 | S | A | Oleaceae | 0.764 |
| Fraxinus mandshurica | 37 | T | A | Oleaceae | 0.799 |
| Juglans regia | 15 | T | A | Juglandaceae | 0.721 |
| Juniperus przewalskii | 30 | T | G | Cupressaceae | 0.742 |
| Lonicera caerulea | 32 | S | A | Caprifoliaceae | 0.783 |
| Picea asperata | 90 | T | G | Pinaceae | 0.987 |
| Pinus armandii | 20 | T | G | Pinaceae | 0.915 |
| Pinus massoniana | 20 | T | G | Pinaceae | 0.883 |
| Platycladus orientalis | 30 | T | G | Cupressaceae | 0.742 |
| Populus davidiana | 11 | T | A | Salicaceae | 0.772 |
| Prunus persica | 70 | S | A | Rosaceae | 0.909 |
| Quercus mongolica | 15 | T | A | Fagaceae | 0.979 |
| Salix arbutifolia | 37 | T | A | Salicaceae | 0.799 |
| Salix linearistipularis | 37 | S | A | Salicaceae | 0.799 |
| Sorbus alnifolia | 8 | T | A | Rosaceae | 0.784 |
| Spiraea pubescens | 32 | S | A | Rosaceae | 0.744 |
| Tilia amurensis | 17 | T | A | Malvaceae | 0.931 |
| Ulmus pumila | 8 | T | A | Ulmaceae | 0.870 |
| Vitex negundo var. heterophylla | 70 | S | A | Lamiaceae | 0.826 |
| Zabelia biflora | 32 | S | A | Caprifoliaceae | 0.804 |
| Ziziphus jujuba var. spinosa | 70 | S | A | Rhamnaceae | 0.827 |
| All species | 1181 | 0.832 ± 0.015a |
n means the sample size of the leaves in every species. T, tree; S, shrub; A, angiosperm; G, gymnosperm. aStandard error of the mean.
The equal number of green vs. senesced leaves were collected, in summer and autumn, respectively, from the sun-lit branches of three to five mature and healthy individual plants for each species at each site. We collected the autumn samples by carefully selecting the average-sized senesced leaves, so as to keep the senesced leaf areas to be as close, or commensurable, as possible to those of their green summer counterparts who also had the average sizes from the same individuals. The leaf sample size depended on species, with relatively smaller sample size for species with bigger leaf size (e.g. Quercus mongolica) and relatively larger sample size for species with smaller leaf size (e.g. Dasiphora fruticose) (for more details, see Table 1). Samples were dried at 70 °C for 48–72 h until the weight was stable. Then the dry-mass of green and senesced leaves were measured, and the MLCFs were calculated with equation 3. Finally, the “correct” NuRE was recalculated with the following equations:
where NuREc is the MLCF-corrected NuRE. and are nutrient concentrations in green and senesced leaves. is the nutrient concentration in senesced leaves with concentrations corrected. NuREc is the MLCF-corrected NuRE.
Leaf N concentration was determined with an elemental analyzer (Elementar Vario MACRO cube, Germany). Leaf P was determined with a molybdate/ascorbic acid method after HNO3–H2O2 digestion with MARS (MARS Xpress, CEM,USA) and ICP-OES (ICP-OES 7300DV, PerkinElmer, USA).
RESULTS
There was significant mass loss during leaf senescing for all these 35 plant species (averagely, 17% of the green-leaf mass; or, MLCF 0.832 ± 0.015) (Fig. 1; Table 1).
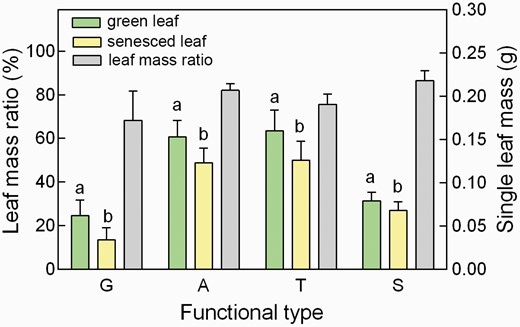
The average mass per green- and senesced-leaf and their mass ratio of different functional-type plants. A, angiosperms; G, gymnosperms; S, shrubs; T, trees. Different letters above the colored bars indicated a significant difference in the mass between green- and senesced-leaves (paired t-test, P < 0.05). Single leaf means a lamina for angiosperms or a needle for gymnosperms. Leaf mass ratio (%) means the mass ratio of a single senesced leaf against a singe green leaf.
Angiosperms lost 18.1% and gymnosperms lost 11.7%, respectively, of their green-leaf mass during leaf senescence, whereas there was 15.5% and 19.6% leaf mass loss for trees and shrubs, respectively (Table 2; Fig. 1). Accordingly, there were significant differences in MLCF (= one minus the relative leaf mass loss; see equation 3) between different functional types (P < 0.05, Table 2).
Statistics of mass loss correction factor (MLCF) of different plant types
| Functional type | n | MLCF | |
|---|---|---|---|
| Mean | SE | ||
| Gymnosperm | 7 | 0.883a | 0.039 |
| Angiosperm | 28 | 0.819b | 0.015 |
| Tree | 23 | 0.845a | 0.019 |
| Shrub | 12 | 0.804b | 0.021 |
| Functional type | n | MLCF | |
|---|---|---|---|
| Mean | SE | ||
| Gymnosperm | 7 | 0.883a | 0.039 |
| Angiosperm | 28 | 0.819b | 0.015 |
| Tree | 23 | 0.845a | 0.019 |
| Shrub | 12 | 0.804b | 0.021 |
n is the number of species in this study. Different lowercase letters indicate a significant difference (ANOVA, P < 0.05) between different plant types within each pair; SE standard error.
Among angiosperms, D. fruticosa lost about 37% of its green-leaf mass in autumn (MLCF = 0.632), but Picea asperata had almost no leaf mass loss during senescence (MLCF = 0.987) in gymnosperms (Table 1).
The NuRE before MLCF correction (NuREc, i.e. NREc and PREc) were consistent with those after MLCF correction (NREunc and PREunc, Fig. 2), with the corrected and uncorrected NuRE above and below 1:1 line, respectively, and averagely NuREc increasingly departing from their uncorrected counterparts at lower values. The NuRE corrected with MLCF were remarkably increased, compared with the uncorrected ones. For example, the NuRE of leaf nitrogen (NRE) phosphorus (PRE) both increased averagely by 9% (from 45.7% to 54.7% and 54.1% to 63.2%, respectively), or became 9% more accurate (P < 0.05, Table 3). Among the 35 species, Zabelia biflora and Spiraea pubescens (both deciduous angiosperm shrubs) showed the highest increases in PRE (23%), and P. asperata and Abies nephrolepis (both evergreen gymnosperm trees) had the lowest increases in PRE (0.3%–0.4%, Table 3).
Nutrient resorption efficiency before and after leaf mass loss correction
| Species | NREunc (%) | NREc (%) | PREunc (%) | PREc (%) |
|---|---|---|---|---|
| Abies fabri | 46.6 (5.7) a | 48.7 (5.4) b | 63.0 (1.2) a | 64.4 (1.1) b |
| Abies nephrolepis | 57.0 (2.6) a | 57.6 (2.6) b | 74.1 (1.6) a | 74.5 (1.6) b |
| Acer palmatum | 36.3 (4.3) a | 52.8 (3.2) b | 40.2 (3.2) a | 55.6 (2.4) b |
| Acer pictum subsp. mono | 36.4 (7.0) a | 43.0 (6.3) b | 35.7 (6.0) a | 42.3 (5.4) b |
| Acer tegmentosum | 44.8 (3.2) a | 48.1 (3.0) b | 56.7 (1.0) a | 59.3 (1.0) b |
| Acer truncatum | 53.5 (4.6) a | 65.1 (2.8) b | 66.7 (2.4) a | 74.1 (4.3) b |
| Acer ukurunduense | 53.4 (5.7) a | 56.0 (5.4) b | 64.6 (7.5) a | 66.6 (7.1) b |
| Betula albosinensis | 40.5 (10) a | 54.1 (8.1) b | 64.8 (5.9) a | 72.8 (4.6) b |
| Carpinus cordata | 35.0 (1.6) a | 43.5 (1.4) b | 47.6 (2.5) a | 54.4 (2.2) b |
| Carya cathayensis | 18.1 (5.3) a | 40.9 (3.8) b | 37.0 (6.1) a | 54.6 (4.4) b |
| Corylus mandshurica | 35.0 (4.4) a | 37.4 (3.4) a | 51.4 (2.5) a | 53.8 (2.8) b |
| Cotoneaster acutifolius | 50.4 (1.4) a | 57.8 (1.2) b | 63.7 (1.5) a | 69.2 (1.3) b |
| Dasiphora fruticosa | 51.1 (1.8) a | 69.1 (1.1) b | 63.1 (0.9) a | 76.7 (0.5) b |
| Euonymus alatus | 29.9 (4.6) a | 49.5 (7.2) b | 37.1 (4.0) a | 59.4 (2.4) b |
| Forsythia suspensa | 21.0 (2.0) a | 39.7 (1.5) b | 36.2 (1.6) a | 51.3 (1.2) b |
| Fraxinus mandshurica | 49.6 (5.3) a | 59.7 (4.2) b | 56.1 (8.2) a | 64.9 (6.5) a |
| Juglans regia | 22.8 (5.4) a | 44.3 (3.9) b | 42.4 (4.9) a | 58.5 (3.6) b |
| Juniperus przewalskii | 56.1 (2.7) a | 67.4 (2.0) b | 75.1 (2.9) a | 81.5 (2.2) b |
| Lonicera caerulea | 54.3 (2.7) a | 64.2 (2.1) b | 41.9 (8.0) a | 54.5 (6.3) b |
| Picea asperata | 62.4 (2.1) a | 62.9 (2.0) b | 77.3 (1.4) a | 77.6 (1.4) b |
| Pinus armandii | 58.2 (2.1) a | 61.8 (1.9) b | 87.5 (1.8) a | 88.5 (1.7) b |
| Pinus massoniana | 78.2 (0.4) a | 80.8 (0.4) b | 77.3 (1.0) a | 80.0 (0.9) b |
| Platycladus orientalis | 37.5 (5.3) a | 53.7 (3.9) b | 55.8 (4.5) a | 67.2 (3.4) b |
| Populus davidiana | 16.1 (7.8) a | 35.2 (6.0) b | 20.2 (4.8) a | 38.4 (3.7) b |
| Prunus persica | 46.4 (5.3) a | 51.3 (4.8) a | 55.6 (7.9) a | 59.6 (7.2) b |
| Quercus mongolica | 51.0 (8.3) a | 52.0 (8.4) a | 41.6 (2.3) a | 55.7 (3.0) b |
| Salix arbutifolia | 53.5 (7.8) a | 62.9 (6.2) b | 57.5 (4.7) a | 66.0 (3.8) b |
| Salix linearistipularis | 50.4 (0.9) a | 60.4 (0.7) b | 63.9 (3.6) a | 71.1 (2.9) b |
| Sorbus alnifolia | 57.9 (4.8) a | 60.2 (5.0) b | 78.3 (5.2) a | 79.5 (6.0) a |
| Spiraea pubescens | 29.8 (3.5) a | 48.9 (2.5) b | 38.2 (4.5) a | 61.1 (2.8) b |
| Tilia amurensis | 41.7 (4.8) a | 47.4 (4.7) b | 33.7 (3.3) a | 40.9 (3.5) b |
| Ulmus pumila | 35.9 (5.9) a | 44.2 (5.2) b | 42.7 (3.8) a | 50.2 (3.3) b |
| Vitex negundo var. heterophylla | 37.5 (2.0) a | 48.4 (1.6) b | 51.2 (2.6) a | 59.6 (2.2) b |
| Zabelia biflora | 34.7 (6.4) a | 51.3 (5.7) b | 39.3 (4.5) a | 62.3 (9.3) b |
| Ziziphus jujuba var. spinosa | 41.0 (4.4) a | 51.3 (3.6) b | 53.0 (7.9) a | 61.2 (6.5) b |
| All species | 45.7 (1.1) a | 54.7 (0.9) b | 54.1 (2.6) a | 63.2 (1.9) b |
Values are mean (standard error). Different lowercase letters indicate a significant difference (Paired t-test, P < 0.05) before and after mass loss correction. NREc and NREunc, (and PREc and PREunc) are the MLCF-corrected and uncorrected nitrogen (and phosphorus) resorption efficiency, respectively.
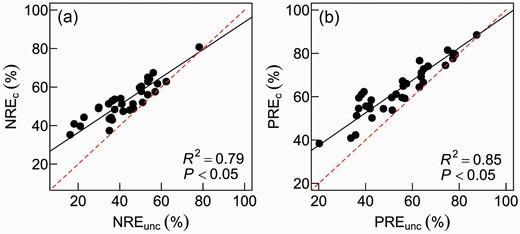
Relationships of (a) nitrogen resorption efficiency (NRE) or (b) phosphorus resorption efficiency (PRE) uncorrected vs. corrected with mass loss corrected factor (MLCF) of plant leaves. The solid black lines show standardized major axis regression (type II linear regression) results. The red dashed lines indicate 1:1 line. NREc and NREunc (and PREc and PREunc) are the MLCF-corrected and uncorrected nitrogen (and phosphorus) resorption efficiency, respectively.
DISCUSSION
Usually, nutrient resorption efficiency is defined as the percentage changes in nutrient concentration of senesced relative to green leaves, calculated by the measured green- and senesced-leaf nutrient concentrations based on mass or area basis (see equation 1). However, it is on condition that leaf mass and area do not change during leaf senescence; otherwise, NuRE will not be accurate (as shown in equations 2~4). Actually, the NuRE obtained without considering leaf mass loss are underestimated (Killingbeck 1984; Kazakou et al. 2007; van Heerwaarden et al. 2003). The main cause of mass loss lies in the resorption and potential leaching of leaf carbon (C) and mineral nutrients. Compared to the C concentration, other nutrients occupy fewer components of leaves. Hence, even small portion of C resorption could lead to large decreases in the total mass of the leaf (vergutz et al. 2012). The mass basis is better for forbs, grasses, shrubs and conifer trees, as the leaves of them usually dry out and shrink a lot before leaf abscission, or are too much small to measure, which causes difficulty in the calculation. Woodwell (1974) suggested that it would be better to use leaf area than mass to calculate NuRE. However, leaf area is not considered as a stable parameter during leaf senescence. Leaf area shrinks 6%–20% during leaf senescence, with the average 10% (van Heerwaarden et al. 2003). So, area basis may be more suitable for sclerophylls.
Our results indicated that the difference between MLCF-corrected and uncorrected NuRE increased with the decrease of NuRE value (Fig. 2), suggesting that the underestimation of NuRE is more serious in the case of low resorption efficiencies. The MLCF for gymnosperms and deciduous angiosperms in this study are 0.883 and 0.819 (i.e., 11.7% and 18.1% leaf-mass loss), respectively, which were bigger than that reported by Vergutz et al. (2012) (MLCF: 0.745 and 0.784, respectively). The leaf-mass loss of Fagaceae in van Heerwaarden et al. (2003) was about 20%, whereas the leaf-mass loss of the same family in this study was only 10%. One possible reason may be that the leaching-caused foliar-nutrient loss in plants in northern China is lower than that occurs in the global plants reported, e.g. by Vergutz et al. (2012). In addition, we did not have ferns, forbs and graminoid species. The leaf nutrients of these herbaceous plants are more susceptible to leaching because of their nutrient-rich feature, compared with the woody plants in this study.
Because the green leaf samples had been removed from the plants in summer, the senesced leaves sampled in autumn were surely not that same ones as sampled in summer. Therefore, in order to control the result error caused by this problem of destructive sampling, the two stages of samples (cf. equation 1) must be collected from the same leaf population, i.e. the areas (as well as shapes, thickness and other size attributes) of the green and senesced leaf samples should be controlled as similar as possible by direct measurement of the sample leaf areas. However, given that the falling senesced leaves of some species would shrink, or curl over, becoming easily broken due to crispation during their drying, it was hard to assess precisely the area (and shapes) of these types of senesced leaves. Nevertheless, by carefully selecting the average-sized green and senesced leaves, the result error due to the destructive sampling method should be acceptable. It suggests that our specifically MLCF-corrected results could greatly improve the accuracy of NuRE, given that the results reported by most previous studies were corrected with MLCF at the functional group level (e.g. Han et al. 2013; Luo et al. 2020; Vergutz et al. 2012; Zhang et al. 2015), or even uncorrected (Li et al. 2020; Peng et al. 2019; Yuan and Chen 2009; Zhang et al. 2021), and also without comparison of the areas between green- and senesced-leaf samples.
CONCLUSION
In this study, we measured the leaf mass loss during senescence of 35 dominant woody plants in northern China and reported the mass loss correction factor (MLCF) for every single species. These woody plants averagely lost 17% of their green-leaf mass during leaf senescence, but varied greatly from 1.3% to 36.8% leaf mass loss across these species, or 11.7% to 19.6% mass loss across various functional types, during leaf senescence. Accordingly, the MLCF varied from 0.632 to 0.987 across the 35 species with an average value 0.832. Using MLCF could remarkably improve the accuracy, or eliminate the underestimation errors, of leaf nutrient resorption efficiency (NuRE), by correcting the leaf mass loss, especially in the case of low resorption efficiencies. For example, the leaf nitrogen resorption efficiency (NRE) increased significantly from 45.7% to 54.7% and the leaf phosphorus resorption efficiency (PRE) increased significantly from 54.1% to 63.2% averagely after correction with MLCF. Our field data provided reliable references for the MLCF of plants in related regions at both species and functional-type levels, expected to foster more accurate calculations of NuRE and the associated nutrient fluxes within and between plants and the soil.
Supplementary Material
Supplementary material is available at Journal of Plant Ecology online.
Table S1: Sampling locations of the 35 dominant species in northern China.
Acknowledgements
We thank Miss J. Chen and Dr. S. N. Liu for assistance with the field sampling and laboratory work.
Funding
The National Key Research and Development Program of China (2018YFC0507204), “Strategic Priority Research Program” of the Chinese Academy of Sciences (XDA26040202) and the National Natural Science Foundation of China (41473068).
Conflict of interest statement
The authors declare that they have no conflict of interest.


