


Abstract
Phosphorus (P) availability and efficiency are especially important for plant growth and productivity. However, the sex-specific P acquisition and utilization strategies of dioecious plant species under different N forms are not clear.
This study investigated the responsive mechanisms of dioecious Populus cathayana females and males based on P uptake and allocation to soil P supply under N deficiency, nitrate (NO3−) and ammonium (NH4+) supply.
Females had a greater biomass, root length density (RLD), specific root length (SRL) and shoot P concentration than males under normal P availability with two N supplies. NH4+ supply led to higher total root length, RLD and SRL but lower root tip number than NO3− supply under normal P supply. Under P deficiency, males showed a smaller root system but greater photosynthetic P availability and higher leaf P remobilization, exhibiting a better capacity to adaptation to P deficiency than females. Under P deficiency, NO3− supply increased leaf photosynthesis and P use efficiency (PUE) but reduced RLD and SRL in females while males had higher leaf P redistribution and photosynthetic PUE than NH4+ supply. Females had a better potentiality to cope with P deficiency under NO3− supply than NH4+ supply; the contrary was true for males. These results suggest that females may devote to increase in P uptake and shoot P allocation under normal P availability, especially under NO3− supply, while males adopt more efficient resource use and P remobilization to maximum their tolerance to P deficiency.
摘要
磷的吸收和利用效率对植物生长和产量尤为重要。然而,在不同氮形态下,雌雄异株植物对土壤磷的吸收和利用策略尚不清楚。本论文研究了雌雄青杨(Populus cathayana)在低氮、硝态氮和铵态氮下对 土壤磷的吸收和利用策略。研究结果表明,在较高的土壤供磷条件下,青杨雌株在两种氮形态下较雄株而言,均具有较高的生物量、根长密度、比根长和地上磷含量。此外,在正常供磷条件下,与硝态氮相比,青杨雌株在铵态氮的供应下具有更长的根系、更大的根长密度和比根长,而具有较少的根尖数。相比而言,在低磷条件下,青杨雄株在两种氮形态下均具有较小的根系、较大的叶片光合磷的利用效率以及较高的磷的再转运潜力。而且,青杨雌株在硝态氮条件下与铵态氮相比,具有较高的应对低磷潜力。在低磷条件下,铵态氮下青杨雄株叶片磷的光合利用效率和叶片磷再转运潜力明显高于硝态氮。这些结果表明,在正常供磷条件下,青杨雌株较雄株而言,具有更强的磷吸收能力及较高的生物量,尤其在硝态氮条件下;相比而言,青杨雄株在两种氮形态下较雌株而言,具有更有效的磷的利用效率,从而具有较高的对磷缺乏的忍耐能力。
INTRODUCTION
Phosphorus (P) and nitrogen (N) are critical macronutrient elements in plants. Phosphorus plays essential roles in photosynthesis, energy transfer, enzymatic activation and respiration, and is an essential component of the cell membrane (Gan et al. 2016; Shen et al. 2011; Vance et al. 2003; Zhang et al. 2019). Similarly, N is an important composition of proteins, photosynthetic apparatus, nucleic acids and metabolites in plants (Chen et al. 2019; Gu et al. 2018; Nascente et al. 2017; Tegeder and Masclaux-Daubresse 2018). However, plants often suffered from P deficiency due to the low solubility and high sorption of soils.
Adequate regulation of nitrogen fertilization is of increasing important to improve plant survival under P deficiency (Gan et al. 2016; Zhang et al. 2019). For example, Deng et al. (2016) suggested that N addition accelerated P mineralization and improved P uptake through regulation of the fungal and bacterial ratio. Cole et al. (1963) found that N application increased the translocation of root-to-shoot P uptake. Nitrate (NO3−) and ammonium (NH4+) are the principal forms of inorganic N for plants, which can affect the protective role of this element against P deficiency (Zeng et al. 2012). The uptake of NH4+ by plants induces net H+ efflux and soil acidification, with a potential increase in P availability in soils (Gahoonia and Nielsen 1992). Additionally, NH4+ supply was shown to increase plasma membrane H+-ATPase activity and concentration, which stimulated P uptake in rice roots (Zeng et al. 2012). A meta-analysis by Nkebiwe et al. (2016) found that a combination of soluble P and NH4+ supply was an effective approach for increasing yield in many crop types. Conversely, Niu et al. (2013a) suggested that NO3− supply enhanced the activity of acid phosphatases and stimulated internal P recycling between the root and shoots under elevated CO2 in Arabidopsis. NO3− could promote the coordinated utilization of P and N by activating the transduction of P signaling in rice (Hu et al. 2019). NO3−-inducible NIGT1 protein is also involved in P uptake and starvation signaling in Arabidopsis (Ueda and Yanagisawa 2019). These findings suggest that N forms may differently affect P homeostasis and plant growth, in a manner dependent on plant species.
To overcome P limitation, plants have evolved in a variety of mechanisms to maintain P homeostasis, including alteration of root architecture, induction of root hair development and the release of organic acids (Li et al. 2019; Walk et al. 2006; Wen et al. 2017). N form may also influence P uptake and allocation through changes in root morphology and plant growth. Root system architecture facilitates the effective acquisition of nutrients, which is highly plastic in terms of its developmental response under low P conditions (Maruyama et al. 2019; Wasaki et al. 2003; Xia et al. 2020; Zhu et al. 2005). N form was found to affect root system architecture (Jia et al. 2019; Jia and von Wirén 2020; Yang et al. 2019), which may contribute to the differences between N form and P availability in plants. Some studies have suggested that NH4+ application stimulated lateral root branching and inhibited root growth, resulting in a higher shoot:root ratio compared with NO3− in plants (Guo et al. 2002; Hawkins and Lewis 1993), while NO3− was shown to stimulate lateral root elongation and primary root growth in plants (Bloom et al. 1992; Naulin et al. 2020; Patterson et al. 2016; Zhang and Forde 2000). It is probable that changes in the root system architecture under both N forms were due to P uptake and availability in soils. Feng et al. (2017) found that overexpression of the rice NO3− transporter, OsNRT2.3b, increased root length root surface area, root biomass and the root:shoot ratio and P uptake in rice. Similarly, Ueda and Yanagisawa (2019) found that NO3− enhanced P starvation responses via the promotion of root hair growth and P uptake. Another study argued that the NH4+ and P supply modified root spatial distribution and increased the rates of P uptake in maize (Ma et al. 2014). Therefore, understanding the adaptive mechanism of P deficiency under two N forms in different species, and even among genotypes within the same species is critically important if aiming to develop a method to improve P availability.
Poplar is one of the examples of dioecious plants. Dioecious plants present sexual dimorphism in terms of sexual features, and in a series of vegetative and protective traits (Juvany and Munné-Bosch 2015; Liu et al. 2020a, 2020b; Randriamanana et al. 2014). Females usually invest more resources to reproduction and present lower tolerance to environmental stresses than male plants (Juvany and Munné-Bosch 2015; Randriamanana et al. 2014). Previous studies suggested that N deposition affects sexual dimorphism in photosynthesis, biomass allocation and leaf anatomical traits (Chen et al. 2011). Xia et al. (2020) suggested that sex-specific strategies in P acquisition are associated with the costs of root system architecture, root exudation and mycorrhizal symbioses in Populus cathayana. Moreover, Zhang et al. (2019) reported dimorphic responses to N and P deficiency. However, limited information is available regarding the effects of N forms on the differential responses to P deficiency in male and female P. cathayana. We hypothesized that: (i) females respond more positively to a high P availability than males, while males were less affected by P deficiency; (ii) females depend on root system architecture to elevate P acquisition; and that (iii) sex-specific P acquisition and availability strategies in response to P level showed the plasticity of morphological and functional traits.
MATERIALS AND METHODS
Plant material and experimental design
Cuttings of P. cathayana were collected from 90 different trees sampled from 15 populations (six adult trees per population) in Qinghai Province, China (30°67′ N, 104°06′ E) (Chen et al. 2016; Xia et al. 2020). Each cutting was obtained from the different individual parent tree to ensure the independence and randomness of the experimental treatments. Cutting with similar size and height were chosen for the experiment. The 15 populations covered the whole region of P. cathayana with similar water and soil nutrient conditions. Annual solar radiation, mean annual rainfall and annual temperature in this area are 4500 MJ m−2, 335 mm and 6.9 °C (maximum 38 °C, minimum −20 °C), respectively (Zhao et al. 2009). The cuttings were planted in March 2019 at the Hangzhou Normal University (China, 30.03′ N, 120.12′ E). The saplings were subsequently grown in a semi-controlled environment with a daytime temperature of 21–25 °C, a nighttime temperature of 15–18 °C, a photoperiod of 12–14 h and a relative humidity of 76%–81% throughout the growth period. Following growth for about 5 weeks, all healthy cutting (females and males) (~30–40 cm of height) selected were placed into 10 L plastic pots (one cutting per pot) with a 10 kg mixture of sand soil. The property of sandy soil was similar with Xia et al. (2020): 2.62 mg availability, 90.65 mg K, 0.28 g total N, 2.82 g soil organic matter and pH of 8.64. There are three factors i.e. sex (females, males), P application (deficiency, availability) and N application (NO3−, NH4+, deficiency) and their combinations. The experimental design was completely randomized. The treatment began in May 2019 and plants were harvested in September 2019. The plants were fertilized every 2 days with a 200 mL nutrient solution containing 3.75 mmol L−1 NH4+, or 3.75 mmol L−1 NO3− as the N source, or without N addition (Supplementary Table S1). In this experiment, half of all cuttings were supplied with or without P. For P availability, the final P concentration was up to 50 mg kg−1 growth substrate (Xia et al. 2020).
Plant harvesting and sampling
To ensure the randomization and accuracy, at the end of the experiment, we randomly selected four seedlings from six replicates per treatment to measure the gas exchange parameters and the afterward parameters including in this study. Afterwards, all seedlings (four replicates per treatment using to gas exchange parameters) were harvested, weighed and separated into roots, leaves (including leaf blades and petioles) and stems. Leaf and root samples made up of three and/or four subsamples were collected in each of the four replicate seedlings. Three subsamples (leaves and roots) were used to determine the dry weigh and element levels, reactive oxygen species (ROS) and antioxidative enzyme activities and P localization, respectively. Another root subsample was used to measure root traits. Stems samples were made up of two subsamples per plant. One subsample was used to estimate the total dry weigh. The other subsamples were separated into stems and woods, and used to measure the P levels.
Gas exchange measurements
At the end of the experiment, the third fully expanded and intact leaves from randomly selected seedlings were used to determine the photosynthetic gas exchange with a portable photosynthesis measuring system, equipped with an integrated leaf chamber fluorometer (LI-6400-40) from 09:00 to 16:30 h (LI-6400, Li-Cor, Inc., Lincoln, NE, USA) for each day. When the photosynthesis and gas conductance were significantly affected at 11:00–13:00, we did not perform the photosynthetic measurement. Net photosynthetic rate was measured as the follow conditions: the leaf temperature of 25 °C, saturating photon quantum flux density (PPFD) of 1500 µmol m−2 s−1 (with 90% red light and 10% blue light) (PAR), relative humidity was 75%, airflow rate was 500 µmol s−1 and CO2 concentration in the cuvette (Ca) of 400 µmol CO2 µmol mol−1 (Bi et al. 2020). After leaf gas exchange had stabilized, the steady-state fluorescence yield (Fs) and the maximum fluorescence yield in the light-adapted state () were measured according to the method of Delaney (2008). The settings of chlorophyll fluorescence measurements were as follows: the measuring beam intensity of 1 (on a scale of 1–10), measuring modulation of 20 kHz with a measuring filter of 1 Hz and a measuring gain of 10, the saturating flash with 0.8 s duration, flash intensity of 8000 µmol m−2 s−1, the flash modulation of 20 kHz with a flash filter of 50 Hz, the dark pulse involved blue/red actinic light and far red light on together for 1 s. The far red light was turned off for 1 s to estimate the leaf minimal fluorescence with a modulation of 250 Hz and a measuring filter of 1 Hz. Each treatment was replicated four times. Afterwards, the CO2 response curves were measured with Ca from 400 to 300, 200, 100 and 50 µmol mol−1, followed by an increase from 50 to 400, 600, 800 and 1000 µmol mol−1 at a constant PPFD of 1500 µmol m−2 s−1, with four replicates. For each photosynthetic parameter, we selected one plant per treatment to measure them as the first group, and then one plant per treatment as the secondary group, the third group and the fourth group. The photosynthetic P use efficiency (PPUE) was calculated as follows: , where SLA and [P]foliar are the specific leaf area and foliar P concentration, respectively (Gan et al. 2016). The photosynthetic N use efficiency (PNUE) was calculated as follows: (Gan et al. 2016), where SLA and [N]foliar are the specific leaf area and foliar N concentration, respectively. A is the net photosynthetic rate.
Estimation of mesophyll conductance (gm) by chlorophyll fluorescence and gas exchange
The gm was referred as the CO2 diffusive conductance from substomatal cavities to the sites of carboxylation inside the chloroplasts. gm was estimated by gas exchange and chlorophyll fluorescence. The photochemical efficiency of photosystem II (ΦPSII) was calculated as described by Genty et al. (1989):
The electron transport rate from chlorophyll fluorescence (J) was calculated as:
where the product αβ (β is the fraction of light absorbed by PSII and α is leaf absorptance) is obtained from the correlation between photosynthetic rate (A) and using the light response curve under nonphotorespiratory conditions ([O2] < 1.0%) (Yin et al. 2009). The light response curve under low [O2] was measured as described by Lu et al. (2016). Q is the photosynthetic quantum flux density.
CO2 response curves were used to estimate gm according to the variable J method proposed by Harley et al. (1992). gm was calculated as:
where Rd is the dark respiration rate continuing in light and Γ* is the hypothetical CO2 compensation point in the absence of Rd (42.9 µmol mol−1) (Bernacchi et al. 2001; Tosens et al. 2012). gm was further used to transform the A/Ci response curves into A/Cc response curves, as . The calculated Cc was used to calculate the maximum velocity of carboxylation and the photosynthetic electron transport, as described by Bernacchi et al. (2002). Each gm was replicated four times per treatment.
Measurements of growth and root traits
One-tenth of the fresh roots (w/w) was sampled and scanned using a 400 dpi Epson root scanner (Expression1600 pro, Model EU-35; Epson, Tokyo, Japan) due to the large root systems. One-tenth roots were sampled from the whole root per plant with four replicates per treatment. Epson root scanner (Expression1600 pro, Model EU-35; Epson, Tokyo, Japan). Root parameters were analyzed using the Win-RHIZO system (WINRHIZO PRO2004B software, v.5.0, Regent Instruments Inc., Quebec, QC, Canada) (Xia et al. 2020).
Determination of malondialdehyde, O2− and antioxidative enzyme activities
The concentrations of malondialdehyde (MDA) and superoxide radical (O2−), superoxide dismutase (SOD), peroxidase (POD), catalase (CAT) and glutathione (GR) in leaves and roots were measured as described by Chen et al. (2015). MDA contents were measured by thiobarbituric acid reaction (Chen et al. 2015). MDA was measured colorimetrically at 450, 320 and 600 nm. MDA was calculated: . The O2− was measured based on the nitrite formation from hydroxylamine (Sun et al. 2014). The POD, SOD, CAT and GR activities were measured based on the method of Chen et al. (2011). POD activities were measured in 3 mL 50 mmol L−1 potassium phosphate buffer (pH 6.5) containing 40 mmol L−1 guaiacol, 10 mmol L−1 H2O2 and 0.05 mL enzyme extract. SOD activity was measured based on the inhibition of photochemical reduction of nitroblue tetrazolium. For CAT, the enzyme solution was mixed with the reaction solution (100 mmol L−1 potassium phosphate buffer, pH 7.5, 10 mmol L−1 hydrogen peroxide). For GR, the enzyme extract was added to 3 mL of the reaction solution containing 50 mM potassium phosphate buffer (pH 7.8), 2 mmol L−1 EDTA, 0.5 mmol L−1 oxidized GR and 0.15 mmol L−1 NADPH. Proteins were determined by the Bradford method (Jones et al. 1989). There were four replicates per treatment for the determination.
Determination of P, N and P/N use efficiency
Fine powder (0.4 g DW) was digested with 3:1 (v/v) of HNO3 and HClO4. The P concentration was determined based on the absorbance at 700 nm (UV-2450, Shimadzu, Kyoto, Japan). N concentration was measured with a continuous flow analyzer (AA3, Bran-Luebbe, Hamburg, Germany) at 660 nm according to the method described by Gan et al. (2016). The P/N ratios in relevant tissues were calculated as the total P or N concentration. N/P use efficiency (NUE/PUE) was calculated as reported by Gan et al. (2016) and Li et al. (2012), There were four replicates per treatment for the determination of these parameters.
Phosphorus allocation among tissues
Leaf and root segments (fine roots, <2 mm) were taken from one leaf and root segment from each of four different plants. Samples were washed thoroughly with deionized water and then cut into thin sections. The hand sections were dried with a vacuum freeze dryer for 72 h. The freeze-dried samples were then gold-plated with vacuum sputtering and scanned with a scanning electron microscope (Zeiss Sigma 500, Germany) at 3 kV. The P signal intensities were measured with an energy-dispersive X-ray (EDX) (EDAX ELEMENT, Mahwah, USA) at 10 kV. The EDX spectra with P Kα (λ = 2.0134 for P) were acquired at a scanning rotation of 283.2°. Then, line scanning was conducted with EDX at 10 kV with a work distance of 8.5 mm. Measurements were made using different plants with four replicates per treatment. The spectra of P and S on the surface were analyzed with the SuperQuant program (EDAX). The method of element distribution in the cross-section was based on Sun et al. (2009) and He et al. (2013).
Measurement of acid phosphatase activity
The acid phosphatase activity in leaves was measured according to Niu et al. (2013a). About 0.2 g of fresh samples were frozen with liquid nitrogen and homogenized in a cold mortar. The powder was extracted with 0.2 mol L−1 glacial acetic acid–sodium acetate buffer (pH 5.8) and centrifuged at 12 000g for 10 min at 4 °C. The reaction mixtures contained 0.1 mL of enzyme extract, 0.4 mL of buffer solution and 4.5 mL of 5 mol L−1p-nitrophenyl phosphate were incubated at 30 °C for 30 min. The reaction was stopped with 2 mL 0.5 mol L−1 NaOH and determined at 405 nm with spectrophotometer.
Statistical analysis
Statistical analyses were performed using SPSS software (version 22.0). A three-way analysis of variance was performed after the data were checked for normality. We found these data were normally distributed among within group. Afterwards, we compared the mean values Duncan’s tests at a significance level of P < 0.05. Different letters indicate significant differences among treatments. The principal component analysis (PCA) was computed by the command procomp() in R (http://www.R-project.org/) according to Luo et al. (2019).
RESULTS
Plant growth traits and gas exchange
Under normal P availability, NH4+-fed males had a higher leaf photosynthetic rate (A) than females, while there was no significant difference in leaf A between sexes under NO3− supply (Fig. 1a). Under normal P availability, males had higher mesophyll conductance (gm) and photosynthetic electron transfer rate (ETR) but lower leaf area than females under both N form (Fig. 1b–d). Under P deficiency, leaf A, gm and ETR in females were reduced by 25%, 65% and 18%, respectively, under NO3− supply, by 35%, 36% and 33%, respectively, under NH4+ supply, when compared with males (Fig. 1a–d). Under P deficiency, NO3−-fed females had higher A and leaf area, but lower gm and similar ETR when compared with NH4+ supply (Fig. 1). In contrast, males exposed to P deficiency had higher leaf A, gm and ETR but lower leaf area under NH4+ supply than NO3− supply. The A, gm, ETR and leaf area were reduced by the combination of N and P deficiency in both sexes compared with normal N and P availability. Moreover, males had higher A, gm and ETR but lower leaf area than females under the combination of N and P deficiency (Fig. 1).
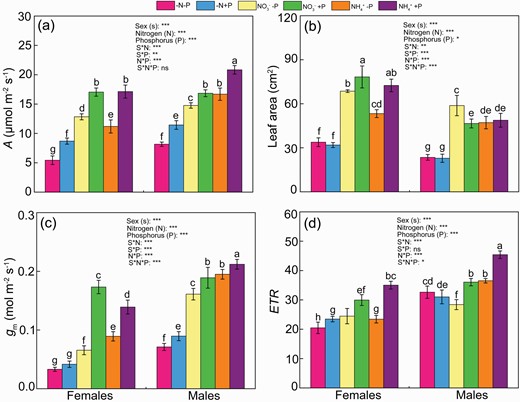
Photosynthesis (A) (a), leaf area (b), mesophyll conductance (gs) (c), photosynthetic electron transport rate (ETR) (d) of female and male Populus cathayana under nitrogen and phosphorus deficiency (−N−P), nitrate and P deficiency (NO3−−P), ammonium and P deficiency (NH4+−P), N deficiency and high P (−N+P), NO3− and high P (NO3−+P) and NH4+ and high P (NH4++P). Bars represent means ± standard error (SE; n = 4). Different letters above the bars indicate significant differences (P < 0.05; Duncan’ test).
Under normal P availability, root length density (RLD), root tip number, total root length, root surface, root dry weight and shoot dry weight were higher in females than males under both N forms (Fig. 2; Table 1). Under normal P and NO3− supply, females had lower specific root length (SRL) and higher leaf mass per area (LMA) than males. There was no significant difference in leaf acid phosphatase between sexes under both N forms (Fig. 2; Table 1). P deficiency decreased RLD, root tip number, the ratio of root to shoot, total root length, root dry weight and shoot weight by 36%, 39%, 80%, 8.0%, 33% and 12%, respectively, in NO3−-fed females, but did not affect these parameters in NO3−-fed males (except for the ratio of root to shoot and shoot dry weight) (Fig. 2; Table 1). There was no significant difference in SRL, LMA and leaf phosphatase activity between two P levels under NO3− supply for females (Fig. 2; Table 1). Under NH4+ supply, P deficiency decreased RLD, total root length, root surface, root diameter, root dry weight, shoot dry weight and LMA by 11%, 13%, 17%, 24%, 22%, 31% and 10%, respectively, in females when compared with normal P supply (Fig. 2; Table 1). In contrast, P deficiency increased total root length, root surface, root diameter and leaf acid phosphatase, decreased root tip number but did not affect RLD and LMA in NH4+-fed males. Under the combination of N and P deficiency, males had higher SRL and LMA, similar RLD, root tip number, total root length, root dry weight, shoot dry weight and leaf phosphatase activity, but lower the ratio of root to shoot, root surface and root diameter, when compared with females (Fig. 2; Table 1). P deficiency greatly increased the ratio of root to shoot and leaf acid phosphatase activities but did not affect SRL, RLD, root tip number, total root length, root diameter, shoot dry weight between two P levels under N deficiency for both sexes (Fig. 2; Table 1). P deficiency increased root surface and decreased LMA for females, but did not affect these two parameters for males under N deficiency.
Root total length, root surface area, root average diameter, root dry weight (DW), shoot DW, leaf mass per area (LMA) and leaf acid phosphatase in female and male of Populus cathayana under nitrogen and phosphorus deficiency (−N−P), nitrate and P deficiency (NO3−−P), ammonium and P deficiency (NH4+−P), N deficiency and high P (−N+P), NO3− and high P (NO3−+P) and NH4+ and high P (NH4++P)
| Sex | Treatment | Total root length (cm) | Root surface area (cm2) | Root diameter (mm) | Root DW (g) | Shoot DW (g) | LMA (g m−3) | Leaf acid phosphatase activity (g g−1 protein h−1) |
|---|---|---|---|---|---|---|---|---|
| Female | −N−P | 2240.1 ± 199.2f | 187.7 ± 22.4e | 0.403 ± 0.03cd | 2.84 ± 0.63e | 7.92 ± 1.40g | 37.0 ± 1.0cd | 8.68 ± 1.02ab |
| −N+P | 2210.1 ± 341.9f | 135.2 ± 11.8f | 0.402 ± 0.02cd | 3.87 ± 0.25e | 8.22 ± 0.45g | 44.8 ± 1.1a | 5.06 ± 0.30ef | |
| +NO3−−P | 3563.7 ± 139.9e | 221.9 ± 18.0d | 0.467 ± 0.01b | 7.43 ± 0.81b | 32.80 ± 1.82b | 34.8 ± 0.8de | 4.53 ± 0.53fg | |
| +NO3−+P | 4302.8 ± 256.5bc | 281.2 ± 12.5b | 0.473 ± 0.02b | 8.55 ± 0.41a | 37.38 ± 0.58a | 36.3 ± 0.8cde | 5.45 ± 0.79ef | |
| +NH4+−P | 4602.6 ± 214.6b | 283.9 ± 13.4b | 0.412 ± 0.03c | 5.97 ± 0.45c | 23.14 ± 1.33ef | 33.8 ± 1.1efg | 6.27 ± 0.51de | |
| +NH4++P | 5292.8 ± 287.9a | 340.8 ± 11.0a | 0.542 ± 0.02a | 7.61 ± 0.33b | 33.70 ± 1.41b | 37.7 ± 3.9c | 5.61 ± 1.13ef | |
| Male | −N−P | 2329.4 ± 168.8f | 145.1 ± 11.1f | 0.346 ± 0.01e | 2.86 ± 0.65e | 8.44 ± 0.56g | 42.5 ± 1.8ab | 9.79 ± 1.61a |
| −N+P | 2349.9 ± 78.6f | 159.6 ± 12.1ef | 0.373 ± 0.02de | 2.07 ± 0.39f | 9.24 ± 1.06g | 40.8 ± 1.2b | 3.71 ± 0.43g | |
| +NO3−−P | 3845.3 ± 114.3de | 260.4 ± 23.4bc | 0.383 ± 0.01cd | 4.06 ± 0.45d | 27.45 ± 0.77d | 31.3 ± 1.7fg | 7.23 ± 0.65cd | |
| +NO3−+P | 3553.7 ± 223.5e | 218.9 ± 20.5d | 0.398 ± 0.07cd | 4.04 ± 0.34d | 29.72 ± 1.22c | 31.9 ± 0.8g | 5.32 ± 0.70ef | |
| +NH4+−P | 4157.7 ± 215.1cd | 283.4 ± 10.5b | 0.462 ± 0.01b | 3.96 ± 0.45e | 22.19 ± 1.05f | 34.3 ± 1.6ef | 7.72 ± 0.69bc | |
| +NH4++P | 3568.5 ± 312.6e | 240.2 ± 25.4cd | 0.396 ± 0.01cd | 4.46 ± 0.23d | 24.20 ± 1.15e | 35.8 ± 1.5cde | 5.33 ± 0.60ef | |
| P values | Sex (S) | ** | *** | *** | *** | *** | * | * |
| Nitrogen (N) | *** | *** | *** | *** | *** | *** | *** | |
| Phosphorus (P) | ns | ns | ** | *** | *** | *** | *** | |
| S × N | *** | ** | * | *** | *** | *** | ns | |
| S × P | *** | *** | *** | *** | *** | *** | *** | |
| N × P | ns | ns | ns | * | *** | ns | *** | |
| S × N × P | * | *** | *** | ns | *** | ** | ns |
Bars represent means ± standard error (SE; n = 4). Different letters in the same column indicate significant differences (P < 0.05; Duncan’s test). The significance values of the three-way analysis of variance are shown as follows: ns = not significant; *0.01 < P ≤ 0.05; **0.001 < P ≤ 0.01; ***P ≤ 0.001.
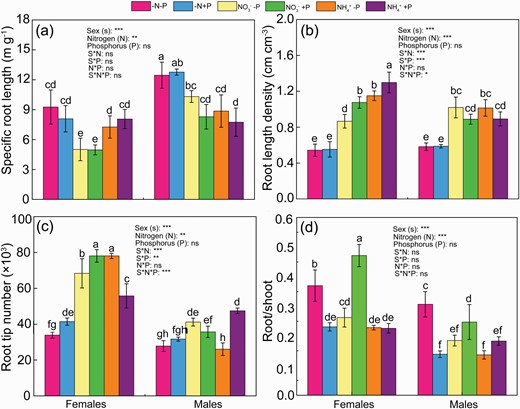
SRL (a), RLD (b), root tip number (c) and root/shoot (d) in Populus cathayana females and males under nitrogen and phosphorus deficiency (−N−P), nitrate and P deficiency (NO3−−P), ammonium and P deficiency (NH4+−P), N deficiency and high P availability (−N+P), NO3− and high P availability (NO3−+P) and NH4+ and high P availability (NH4++P). Bars represent means ± SE (n = 4). Different letters above the bars indicate significant differences (P < 0.05; Duncan’s test).
ROS, antioxidative enzymatic activities and antioxidants
Under normal P availability, females had higher leaf O2− than males under both N forms, whereas there was no difference in leaf MDA between sexes under both N forms (Table 2). P deficiency increased leaf O2− and MDA by 38% and 104%, respectively, under NO3− supply, by 89% and 89% under NH4+ supply in females (Table 2). For males, the leaf O2− and MDA were increased by 91% and 43%, respectively, under NO3− supply, by 155% and 53% under NH4+ supply under P deficiency (Table 2). Males had lower leaf MDA and O2− levels than females under the combination of N and P deficiency. Under N deficiency, P deficiency decreased leaf MDA but increased leaf O2− levels in females; and increased leaf O2− levels, but did not affected leaf MDA for males (Table 2).
Leaf CAT (U mg−1 protein), POD (U g−1 protein), SOD (U g−1 protein), GR (U mg−1), MDA (nmol g−1 FW) and superoxide radical (O2−, nmol g−1 FW), and root CAT and GR in female and male Populus cathayana under nitrogen and phosphorus deficiency (−N−P), nitrate and P deficiency (NO3−−P), ammonium and P deficiency (NH4+−P), N deficiency and high P (−N+P), NO3− and high P (NO3−+P) and NH4 and high P (NH4++P)
| Sex | Treatment | Leaf CAT | Leaf POD | Leaf SOD | Leaf GR | Root CAT | Root GR | Leaf MDA | Leaf O2− |
|---|---|---|---|---|---|---|---|---|---|
| Female | −N−P | 14.99 ± 1.4de | 27.12 ± 1.4e | 0.213 ± 0.02cd | 6.81 ± 1.1f | 0.482 ± 0.04cd | 35.51 ± 4.2b | 12.12 ± 1.24b | 16.32 ± 0.68a |
| −N+P | 21.80 ± 6.2cd | 36.01 ± 4.4e | 0.392 ± 0.06a | 6.83 ± 0.40f | 0.570 ± 0.04bc | 20.87 ± 3.0de | 15.44 ± 0.81a | 11.77 ± 1.59b | |
| +NO3−−P | 26.79 ± 2.1c | 15.86 ± 1.7e | 0.353 ± 0.03a | 11.00 ± 2.1e | 0.484 ± 0.02cd | 50.98 ± 3.1a | 6.59 ± 0.38de | 12.35 ± 1.66b | |
| +NO3−+P | 17.32 ± 2.5de | 19.63 ± 2.5e | 0.377 ± 0.04a | 10.40 ± 1.34e | 0.292 ± 0.05fg | 32.18 ± 2.2b | 4.78 ± 0.71fg | 6.05 ± 0.75d | |
| +NH4+−P | 73.1 ± 10.13a | 26.03 ± 4.5e | 0.269 ± 0.03bc | 17.49 ± 1.3c | 0.412 ± 0.06de | 26.42 ± 4.3c | 8.44 ± 0.43c | 8.94 ± 1.26c | |
| +NH4++P | 10.09 ± 1.1e | 19.90 ± 3.1e | 0.394 ± 0.04a | 14.53 ± 1.3d | 0.489 ± 0.07cd | 17.17 ± 2.1ef | 4.46 ± 1.10fg | 3.84 ± 0.56ef | |
| Male | −N−P | 56.03 ± 5.1b | 175.09 ± 12.9b | 0.414 ± 0.07a | 14.44 ± 0.8d | 0.354 ± 0.05ef | 16.51 ± 1.93ef | 7.38 ± 0.99cd | 11.96 ± 0.60b |
| −N+P | 29.78 ± 2.4c | 218.52 ± 28a | 0.284 ± 0.04b | 14.01 ± 0.93d | 0.599 ± 0.03b | 22.35 ± 2.6cd | 8.35 ± 1.39c | 8.76 ± 0.82c | |
| +NO3−−P | 58.98 ± 7.3b | 222.99 ± 24.6a | 0.286 ± 0.04b | 29.54 ± 3.7a | 0.410 ± 0.07de | 24.3 ± 2.6cd | 5.49 ± 0.29ef | 5.13 ± 0.53de | |
| +NO3−+P | 22.16 ± 3.1cd | 120.07 ± 9.7c | 0.192 ± 0.03d | 5.72 ± 1.69f | 0.245 ± 0.04g | 14.56 ± 0.8f | 3.83 ± 0.59g | 2.69 ± 0.64fg | |
| +NH4+−P | 77.87 ± 7.7a | 219.3 ± 36.1a | 0.384 ± 0.04a | 21.46 ± 2.6b | 0.707 ± 0.06a | 31.4 ± 3.9b | 6.46 ± 0.80de | 4.72 ± 0.68de | |
| +NH4++P | 21.66 ± 3.1cd | 79.57 ± 9.8d | 0.185 ± 0.02d | 0.789 ± 0.14g | 0.348 ± 0.1ef | 9.83 ± 1.8g | 4.24 ± 0.43fg | 1.85 ± 0.48g | |
| P values | Sex (S) | *** | *** | *** | *** | ns | *** | *** | *** |
| Nitrogen (N) | *** | ns | *** | *** | ** | *** | *** | *** | |
| Phosphorus (P) | *** | ns | *** | *** | *** | *** | *** | *** | |
| S × N | *** | *** | ** | *** | ** | *** | *** | * | |
| S × P | *** | *** | *** | *** | * | ** | ns | *** | |
| N × P | *** | ns | *** | *** | *** | *** | *** | ns | |
| S × N × P | *** | *** | *** | *** | *** | *** | ** | ns |
Bars represents means ± SE (n = 4). Different letters in the same column indicate significant differences (P < 0.05; Duncan’s test). The significance values of the three-way analysis of variance are shown as follows: ns = not significant; *0.01 < P ≤ 0.05; **0.001 < P ≤ 0.01; ***P ≤ 0.001.
Under normal P supply, NO3−-fed females had higher leaf SOD, leaf GR and root GR, but lower leaf POD than NO3−-fed males (Table 2). There was no difference in leaf and root CAT between sexes under NO3− supply and normal P supply. In contrast, NH4+-fed males had higher leaf CAT and leaf POD, but lower leaf SOD, leaf GR, root CAT and root GR than NH4+-fed females under normal P availability. P deficiency increased leaf CAT, root CAT and root GR by 55%, 66% and 58%, respectively, but had no significant effect on leaf CAT, leaf POD, leaf SOD and leaf GR in NO3−-fed females (Table 2). Under NH4+ supply, P deficiencies in females increased leaf CAT, leaf GR and root GR by 624%, 31% and 54%, respectively, reduced leaf SOD by 32%, and had no effect on leaf POD and root CAT. Conversely, P deficiency increased leaf CAT, leaf POD, leaf SOD, leaf GR, root CAT and GR by 166%, 86%, 49%, 416%, 67% and 67%, respectively, in NO3−-fed males (Table 2). NH4+-fed males under P deficiency had 2.6-, 1.8-, 1.1-, 21.7-, 1.0- and 2.2-fold higher leaf CAT, leaf POD, leaf SOD, leaf GR, root CAT and root GR than normal P availability. For females, leaf POD, SOD and GR under NO3− supply, leaf POD and root CAT under NH4+ supply were not affected by P levels (Table 2).
P status, PUE and PPUE
Under normal P availability, females had higher leaf and root P levels, lower bark P and similar root P, when compared with males under NO3− supply (Fig. 3a–d). Under NH4+ supply, the P levels in leaves, roots, barks and woods of females were higher than males with normal P availability (Fig. 3a–d). Both sexes had higher leaf and root P levels under NH4+ supply than NO3− supply (Fig. 3a and b). For females, there was no significant difference in bark and wood P levels between two N forms under P availability. In contrast, under normal P supply, NO3−-fed males had higher bark P but lower leaf, root and wood P levels than NH4+ feed (Fig. 3c and d). Under NO3− supply, P deficiency decreased P levels by 32%, 50%, 22% and 25% in leaves, roots, barks and woods, respectively, of females, and by 39%, 49% and 45% in roots, barks and woods, respectively, of males, compared with normal P availability (Fig. 3). Under NH4+ supply, P deficiency decreased P levels in leaves, roots and barks 58%, 35% and 14%, respectively, of females, and by 28%, 40% and 27% in males (Fig. 3a–d). Moreover, under P deficiency, NO3−-fed females had lower P levels in root, barks and woods, and similar leaf P levels, than NH4+ feed. Contrarily, males had higher leaf P, lower wood P, and similar bark and root P levels under NO3− supply than NH4+ supply. Under the combination of N and P deficiency, females had higher P levels in leaves and roots, and similar bark and wood P levels when compared with males (Fig. 3). Under normal P deficiency, PUE and PPUE in males were higher than females under both N supply, which were greater under NO3− supply than NH4+ supply in both sexes (Fig. 3e and f). P deficiency increased PUE and PPUE in both sexes, irrespective of N form (except for PPUE for females with NO3− supply). Females had greater PUE, but similar PPUE than males under the combination of N and P deficiency (Fig. 3e and f).
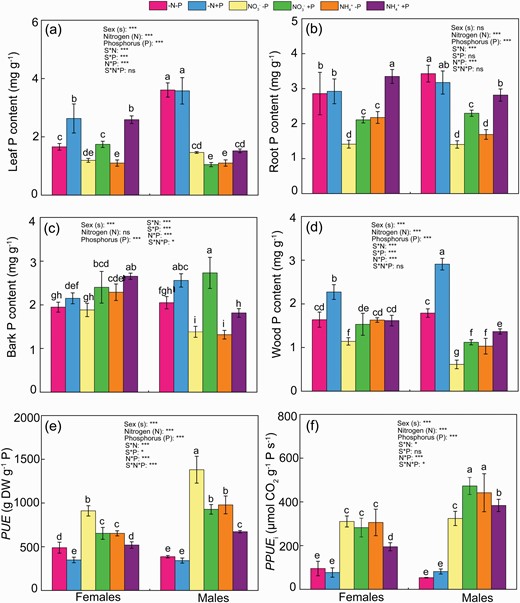
Phosphorus (P) levels in leaves (a), roots (b), barks (c) and woods (d), PUE (e) and PPUE (f) of female and male Populus cathayana under nitrogen and phosphorus deficiency (−N−P), nitrate and P deficiency (NO3−−P), ammonium and P deficiency (NH4+−P), N deficiency and high P (−N+P), NO3− and high P (NO3−+P) and NH4+ and high P (NH4++P). Bars represent means ± SE (n = 4). Different letters above the bars indicate significant differences (P < 0.05; Duncan’s test).
N status, NUE and PNUE
Under normal P supply, females had similar leaf and root N levels with males under two N supplies (except for leaf N under NO3− supply) (Fig. 4a and b). When exposed to normal P availability, females had higher NUE under both N forms but lower PNUE under NH4+ supply, and similar PNUE under NO3− supply (Fig. 4a and b). P deficiency decreased leaf N levels by 14% and 15%, respectively, in females and males under NO3− supply, but had no significant effect on root N in both sexes. Contrarily, for NH4+ supply, P deficiency increased leaf N levels in females but had no effect for males (Fig. 4a and b). Similarly, P status did not affect root N level in both sexes under NH4+ supply. P deficiency decreased NUE in females under both N forms, and in males under NO3− supply (Fig. 4c and d). The decreased PNUE by P deficiency was greater in females than males under both N forms. Under P deficiency, the NUE and PNUE were higher under NH4+ supply than NO3− supply in males, whereas there was no significant difference in NUE and PNUE for females between two N forms under P deficiency (Fig. 4c and d). Noticeably, there was no significant difference in leaf N and PNUE between sexes under the combination of N and P deficiency. Contrarily, females had greater NUE but lower root N than males under the combination of N and P deficiency. Moreover, P status did not affect the leaf N, root N, NUE and PNUE in females, but increased NUE and PNUE in males under N deficiency.
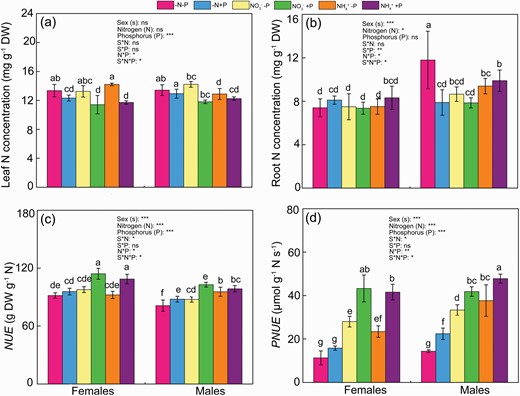
Nitrogen (N) levels in leaves (a) and roots (b), NUE (c) and PNUE (d) of female and male Populus cathayana under nitrogen and phosphorus deficiency (−N−P), nitrate and P deficiency (NO3−−P), ammonium and P deficiency (NH4+−P), N deficiency and high P (−N+P), NO3− and high P (NO3−+P) and NH4+ and high P (NH4++P). Bars represent means ± SE (n = 4). Different letters above the bars indicate significant differences (P < 0.05; Duncan’s test).
P allocation within organs
Under normal P availability, leaf P intensity was higher in females than in males under all N conditions, especially under NO3− supply, when compared with P deficiency. At normal P supply, females distributed more P to the leaf mesophyll tissues under NO3− supply, while more leaf P was distributed to epidermal and cortical tissues under NH4+ supply (Fig. 5). Moreover, in females, leaf P intensity was similar under both N supplies. Conversely, in males with normal P supply, more leaf P was allocated to the leaf mesophyll palisade tissues under NO3− supply, and to the mesophyll spongy tissues under NH4+ supply (Fig. 5). P deficiency significantly decreased P intensity in cross-sections of leaves in females, but did not affect the P intensity in males when compared with normal P supply under all N conditions (Fig. 5). The leaf P intensity was lower in females than in males under P deficiency; the contrary was true under normal P supply, irrespective of N form. P deficiency induced most P allocation in mesophyll spongy tissues, and secondarily allocation into vascular tissues of females under NO3− supply (Fig. 5). Under NH4+ supply, P deficiency induced more leaf P allocation to the epidermal and cortical tissues of females, while more P allocated into vascular tissues and mesophyll palisade tissues in males (Fig. 5).
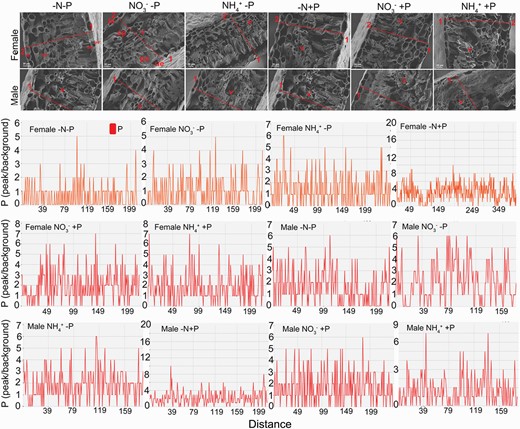
Phosphorus (P) distribution in cross-sections of leaf blades from female and male Populus cathayana under nitrogen and phosphorus deficiency (−N−P), nitrate and P deficiency (NO3−−P), ammonium and P deficiency (NH4+−P), N deficiency and high P (−N+P), NO3− and high P (NO3−+P) and NH4+ and high P (NH4++P). The location of P in the cross-sections was determined by EDX analysis and scanning electron microscope imaging. The x-axis indicates the distance between two points of the leaf blade cross-sections (red lines). The y-axis indicates the relative intensity of Cd distribution on the line connecting two points of cross-sections (red lines). Leaf mesophyll upper epidermis (ue), leaf mesophyll palisade tissue (pa), leaf spongy palisade tissue (sp), and leaf lower epidermis (le), vascular tissue (v). 1, the adaxial side of the leaf; 2, the abaxial side of the leaf.
Under the combination of NO3− and normal P supply, P intensity in the root cross-section was similar between sexes. P was mainly distributed in epidermis, cortical tissues and vascular tissues of female root cross-sections, and in vascular tissues of males under the combined NO3− and sufficient P supply (Fig. 6). In contrast, under the combination of P sufficiency and NH4+ supply, the P intensity was higher in females than in males; and P was mainly distributed in the vascular tissues of roots in both sexes. Under the combination of N deficiency and normal P supply, the P distribution in root cross-sections was higher in females than in males under N deficiency (Fig. 6). P intensity in root cross-sections was higher in males than in females under P deficiency, irrespective of N status (Fig. 6). P intensity was higher under high P treatment compared with P deficiency in females, while the converse was true for males. When exposed to P deficiency, NO3− supply increased P distribution in root cross-sections of females more than NH4+ supply; and P in the root vascular tissues was higher under NO3− than under NH4+ supply (Fig. 6). For males subjected to P deficiency, P was mainly distributed to root vascular tissues under NO3− supply, and to epidermal and cortical tissues under NH4+ supply.
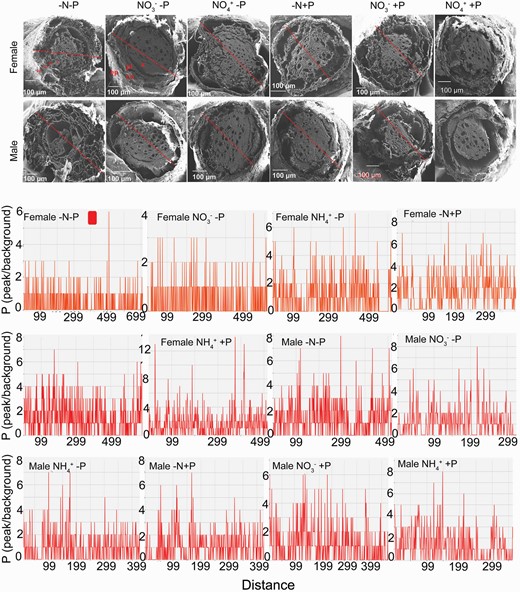
Phosphorus (P) distribution in root cross-sections of female and male Populus cathayana under nitrogen and phosphorus deficiency (−N−P), nitrate and P deficiency (NO3−−P), ammonium and P deficiency (NH4+−P), N deficiency and high P (−N+P), NO3− and high P (NO3−+P) and NH4+ and high P (NH4++P). The location of P in the cross-sections was determined by EDX analysis and scanning electron microscope imaging. The x-axis indicates the distance between two points of the root cross-sections (red lines). The y-axis indicates the relative intensity of P distribution on the line connecting two points of cross-sections (red lines). Epidermis (ep), cortices (co), phloem (pl), xylem (x).
DISCUSSION
The present study supported our hypothesis that females responded positively to high P availability largely depending on the captive ability of root system, while males adopted more efficient resource utilization and P remobilization to maximum P deficiency tolerance. Meanwhile, this study suggested that N form affected sex-specific P acquisition and utilization, which might cause the imbalance in the inputs of N and P to forest ecosystem. Previous study suggested that the preference of poplar females and males was shifted by the stressful factors (Chen et al. 2014), which in turn affected the P acquisition, utilization and in both sexes. Therefore, understanding the responsive strategies to P availability under different N forms facilitated to improve planted forest productivity and fitness, and also predict the sex-specific resource utilization patterns and sex-ratio bias under the continual anthropogenic N deposition.
Sexual dimorphic response to different P availability under NO3− and NH4+ supply
Poplar is one of the examples of dioecious plants. The sex-specific tradeoffs among growth, reproduction and defense determined the sexual dimorphism in resource acquisition and allocation on plants (Juvany and Munné-Bosch 2015; Liu et al. 2021). In this study, we found that sexual differences in the growth rates largely depended on soil P availability. The growth rate in plants largely relied on the adequate nutrient supply in soils (Hayes et al. 2017; Zhou et al. 2017). Females exhibited higher resources uptake by specializing secondary traits to satisfy the faster growth under high-resource conditions (Xia et al. 2020). Indeed, females had greater P uptake and grew better than males under P availability irrespective of N forms (Figs 1 and 3; Table 1). By contrast, males usually had more conservative nutrient utilization strategies and greater resource use efficiency in dioecious plants due to the difference in reproductive cost (Hultine et al. 2016; Juvany and Munné-Bosch 2015; Zhang et al. 2014). The conservation and efficiency of nutrient utilization in males’ plants could maximum stress tolerance and mating opportunities in low-resource habitats (Hultine et al. 2016). Indeed, we found that males were less impacted by P deficiency compared with females under both N forms (Supplementary Fig. S1). Both N and P deficiency disturbed antioxidant systems and redox balance in plants (Kováčik and Bačkor 2007; Tewari et al. 2007). The capacity for ROS scavenging plays a critical role in mitigating oxidative stress when plants suffered from N and/or P deficiency (Zhang et al. 2014). Herein, the lower reaction oxygen damage but higher antioxidative activities further suggested that males were more tolerance in response to P deficiency than females.
Furthermore, this study found that the better adaptation to P deficiency for males than females largely depended on the root system architecture and shoot P availability. According to the theory of ‘functional equilibrium’, plants would allocate more biomass to roots if the growth-limiting factors were below ground (Brouwer 1963; Poorter et al. 2012; Stangoulis 2019). Indeed, females had higher root biomass accumulation than males under P deficiency (Fig. 2). The higher root tips, root length density, total root length, root surface and root diameter in females under P deficiency facilitated to produce more absorptive roots and increased P uptake than males. However, the roots with higher biomass investment tend to have short lifespans (Xia et al. 2020). The increased resource investment in the roots of females was not a good adaptive strategy in a long term, although these root traits in females increased the potential to acquire P in the fertile soils. Importantly, the P captured via roots from P-limited soils did not meet the large P demand for females which required more P to maintain growth and reproduction. Moreover, the plasticity of root morphology represents a high-cost process in response to the harsh environments (Jaleel et al. 2009). The higher root construction costs and the weaker ability of P capture in P deficiency soils may cause more sensitive phenotypes in females than males. By contrast, P deficiency did not affect SRL and RLD in males under both N forms.
Besides, the efficient P redistribution and high P utilization in plants improved plant tolerance to P deficiency (Aziz et al. 2014; Gianquinto et al. 2000). Plants tend to remobilize at least 50% of P from senescing leaves (Aerts 1996; Veneklaas et al. 2012). Indeed, the leaf vascular P intensity and leaf P levels were higher in males than females under P deficiency, irrespective of N form (Fig. 5). High P distribution in leaf vascular tissues may facilitate P remobilization from senescing tissues, and therefore, maintain high P in young leaves, fueling growth (Veneklaas et al. 2012). Interestingly, when soil P was sufficient, the sexual difference in leaf vascular tissues disappeared (Zhang et al. 2014, 2019). This could be explained by the efficient leaf P remobilization in the shoot of males under P deficiency, which enhanced leaf P levels in males under both N forms. Moreover, the increased acid phosphatase activity in plants is one of the main mechanisms to improve the adaptive response to P deficiency (Niu et al. 2013a; Wu et al. 2018). The activation of leaf acid phosphatase facilitated the P translocation from the old leaves to new leaves (Kouas et al. 2009; Niu et al. 2013b). Indeed, the leaf acid phosphatase activities were higher in males than females under P deficiency and both N forms, which facilitated to P redistribution in leaves of males. Moreover, the greater PUE and PNUE in leaves of males than females under P deficiency further demonstrated the greater capacity for nutrient availability in males (Fig. 3). Males had higher P retranslocation and more efficient PUE than females, which thereby had a better ability to cope with P deficiency.
Additionally, the combination of N and P deficiency significantly decreased plant growth and photosynthetic rate in both sexes (Fig. 1; Table 1), consistent with previous studies (Zhang et al. 2014, 2019). Males usually exhibited a higher tolerance to stress and a higher ability to survive under the resource-limiting conditions (Xia et al. 2020; Zhang et al. 2014). Consistently, this study found that males had higher A, gm and ETR than females under the combination of N and P deficiencies. The better growth performs in males were probably associated with the P accumulation in leaves and root, and the increased antioxidative capacity when compared with females under the combination of N and P deficiencies (Fig. 3; Table 1). However, this study found that there were no significant differences in PNUE and PPUE between sexes, inconsistent with other studies. Zhang et al. (2014) suggested that males had higher PPUE and PNUE than females under the combination of N and P deficiencies in P. cathayana. Such differences could be explained by the exposure duration and cultural conditions. Moreover, PCA results suggested that the difference between N deficiency and normal N supply (NO3− or NH4+) was attributable to A, shoot biomass, photosynthetic N and P use efficiency in both sexes. The antioxidative enzymatic activities, leaf acid phosphatase and bark P levels were associated with the adaptation to P deficiency, especially in males (Fig. 7; Supplementary Table S2).
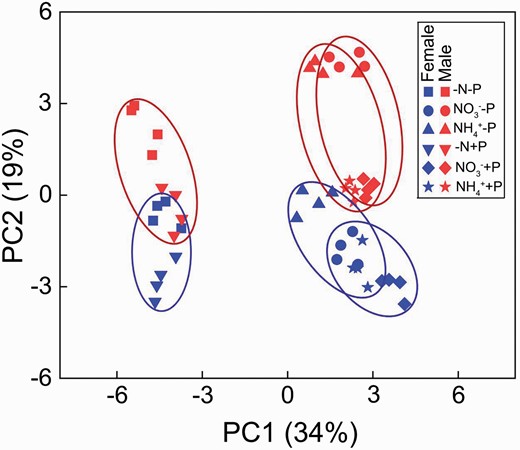
PCA plots of physiological parameters of Populus cathayana females and males under nitrogen and phosphorus deficiency (−N−P), nitrate and P deficiency (NO3−−P), ammonium and P deficiency (NH4+−P), N deficiency and high P (−N+P), NO3− and high P (NO3−+P) and NH4+ and high P (NH4++P).
Effects of N form on the sexually differential response to P deficiency
Nitrogen (N) is a significant factor affecting plant P acquisition and utilization (Jin et al. 2014; Long et al. 2016). NO3− and NH4+ are the principal inorganic N sources in plants. Consistently, we found that N forms affected P absorption and utilization in both sexes under normal P availability. Previous studies suggested that NH4+ uptake resulted in the acidification of the rhizosphere, which potentially increased the P availability in plants (Jing et al. 2010). Moreover, the induction of lateral root proliferation by NH4+ could improve P-uptake efficiency (Ruan et al. 2000). Consistently, NH4+-fed females had greater total length, surface area and average diameter of roots to acquire more P from soil compared with NO3− supply under P availability (Fig. 3; Table 1). Interestingly, NH4+-fed females had similar photosynthetic rates, leaf expansion and biomass to NO3− supply under normal P availability (Fig. 1). Take into consideration of the higher P levels in NH4+-fed females, NO3−-fed females may have other strategies to maintain fast growth. Indeed, NO3−-fed females had more biomass allocation to roots, root tip number and PPUE than NH4+ supply under P availability (Fig. 3; Table 1). For males, the differential growth between NO3− and NH4+ supply was attributable to the P availability in the shoots as their similar root architectures to normal P availability (Fig. 2). NO3− supply facilitates growth better than NH4+ supply in males since their higher biomass accumulation and PPUE under adequate P supply (Fig. 3; Table 1).
Effects of N form on P uptake and utilization in both sexes were more significant under P deficiency than normal P supply. The root spatial configuration is highly plastic in response to P-limiting soils (Brown et al. 2013; Niu et al. 2013b; Waddell et al. 2017). NH4+ supply improved plant growth and nutrient availability by stimulating root proliferation and rhizospheric acidification under P deficiency (Gahoonia and Nielsen 1992; Meier et al. 2020). Consistently, NH4+-fed females had greater root tip number, RLD, SRL, total root length and root surface area (Fig. 2; Table 1), which increased the potential to capture P under P deficiency. However, the P acquisition via the roots was quite limited for females suffered from P deficiency under NH4+ supply. At the same time, the resource investment using to root architecture construction may lead to the waste of resources for males under NH4+ supply. Likewise, NH4+-fed plants had higher carbon losses through the respiration of roots and leaves, absorption and assimilation, which also increased the sensitivity to stresses (Guo et al. 2007; Peuke and Jeschke 1993). By contrast, NO3−-fed females had higher A and PUE to cope with P deficiency than NH4+ supply (Fig. 1). Therefore, NO3−-fed females mainly adopted the increased P utilization, while NH4+-fed females preferred to construct root architecture to improve the potential to capture limited P, when exposed to P deficiency.
Regulation of N form on males’ adaptive response was different from females. Given the similar root traits between NO3− and NH4+ and the limited soil P levels under P deficiency for males (Table 1), the P redistribution and utilization efficiency may determine the adaptive response to P deficiency in males. NH4+-fed plants had higher P absorption and better growth than NO3−-fed plants (Jing et al. 2010; Riley and Barber 1971). Consistently, NH4+-fed males appeared to have a better ability to cope with P deficiency than NO3− feed since NH4+-fed males still maintained higher A, gm, ETR and PPUE under P deficiency (Figs 1 and 3). Moreover, we found that the higher photosynthesis and PPUE were probably associated with the increased leaf P retranslation in NH4+-fed males (Fig. 5; Table 1). However, it worth noted that NO3−-fed males had higher biomass and leaf PUE than NH4+-fed males under P deficiency, as well as normal P availability. That is to say, the discrepancy between photosynthesis and biomass may not be attributable to P application but affected by N itself form and availability. Previous studies suggested that NH4+-fed plants had a smaller leaf area, low leaf area ratio and higher specific leaf weight, which may result in low carbon accumulation (Guo et al. 2007). Moreover, NH4+-fed plants had higher carbon losses through root and leaf respiration, assimilation and transportation than NO3−-fed plants (Bloom et al. 1992; Guo et al. 2007; Peuke and Jeschke 1993). The lower leaf areas in males may result in lower carbon accumulation. Moreover, the higher carbon losses under NH4+ supply in males may also explain the lower biomass and higher photosynthesis, which need to be further explored in the future. Therefore, the higher photosynthesis and photosynthetic rates supplemented the carbon losses in NH4+-fed males. Noticeably, N levels in both sexes were less affected by N forms and/or P availability. The similar total N levels in roots and plants might suggested that the supply NO3− and NH4+ in females and males met the whole demand of plants, and the effect of N form in this study did not depend on the difference in N levels of both sexes.
In conclusion, this study uncovered the sex-specific consequences to cope with P deficiency in dioecious P. cathayana. Females had larger root architecture and leaf area, which increased soil exploration and P acquisition under P availability and N forms. In contrast, males had a better ability to regulate physiological processes and P mobilization, and therefore less sensitive to P deficiency. NH4+-fed females were more sensitive to P deficiency than NO3− supply, whereas males had a good ability to cope with P deficiency under both N forms, especially for NH4+ supply. The results of this study help to predict the changes in dioecious P. cathayana populations affected by climate change, allowing effective action to balance the relationship between trees species and nutrient availability.
Supplementary Material
Supplementary material is available at Journal of Plant Ecology online.
Figure S1: The shoot biomass difference (dry weight) between phosphorus (P) deficiency and P availability in Populus cathayana under nitrate (NO3−) and ammonium (NH4+) supply.
Table S1: The composition of nutrient solution.
Table S2: Results of principal component analysis (PCA) based on oxidants, antioxidants, photosynthesis parameters, pigments and biomass in roots and leaves of Populus cathayana females and males as affected by cadmium stress, N deficiency and their combination.
Funding
This work was supported by the Talent Program of the Hangzhou Normal University (2016QDL020).
Conflict of interest statement. The authors declare that they have no conflict of interest.
Authors’ Contributions
Xiucheng Liu had the main responsibility for data collection, analysis and writing, Yuting Wang and Shuangri Liu contributed to data analysis and Miao Liu (the corresponding author) had the overall responsibility for experimental design and project management.


