


Abstract
Adaptive evolution of invasive species is both particularly exciting for the evolutionary biologist and worrisome for those interested in controlling or halting spread. Invasive species often have a distinct timeline and well-recorded population expansion. As invaders encounter new environments, they undergo rapid adaptive evolution. Our aim in this study was to measure variation of floral size in the invasive shrub Cytisus scoparius (Scotch broom) and measure natural selection by pollinators on that trait. Past research has found that this invasive plant is pollinator limited in Washington State and that declines in pollinator populations can contribute to local extinction in another invaded range (New Zealand). This plant is pollinated by both native and introduced species of bees, representing a broad range of pollinator sizes. Cytisus scoparius has a flower structure that is highly conducive to studies on pollinator choice, even in the absence of direct pollinator observations.
We surveyed urban and rural sites in and around the city of Olympia in Washington State. Measuring banner width, we were able to show that flower size varies substantially between plants but minimally within plants. By measuring the proportion of flowers that were ‘tripped’, we could determine pollinator visitation rates and thus determine the level of selection due to pollinator choice alone.
We found that C. scoparius is under natural selection by pollinators for increased flower size. However, such positive natural selection was only seen in urban populations although it was consistent across two flowering seasons. Rural populations of Scotch broom do not appear to be under selection on flower size. The natural selection by pollinators on broom flowers could result in adaptive evolution into a new pollination niche by an invading species. A higher level of variation in broom flowers seen here than seen in previous works in native regions suggests that C. scoparius may be highly diverse and primed for adaptive evolution.
INTRODUCTION
Invasive plant species provide a unique and valuable opportunity to study rapid adaptive evolution. Expanding outside their native range, in which they have co-evolved with other members of their ecosystem, they are met with a different set of niches and interactions. Man-made disturbances can create novel habitats, which may be inhospitable to natives (Parker et al. 1993) while being similar to the home habitats of many invasive plants. These novel habitats bring new niches that (in addition to any empty niches) are particularly exploitable by invaders (Simberloff 1995). Frequent disturbance, high light and low competition are all aspects of niches created during human disturbances and are excellent for weedy species. The range expansion of the human species has therefore been an excellent catalyst for the spread of many invasive species. Whether the most noxious weeds are simply fortunate enough to have human assistance or if they are inherently invasive (Baker 1974) is subject to some debate, but such debate is often post hoc rather than preventative. Some traits that aid in invasion are early reproduction, high population density and clonal reproduction (Baker 1974). These traits aid in the rapid exploitation of any empty or man-made niches (Simberloff 1995). Another competitive advantage may come in the form of allelopathic compounds or other weapons that give invasive species superiority over naive natives (Callaway and Aschehoug 2000). As human disturbances also remove many native enemies, invasives may gain from an open niche, naive natives and reduced herbivory, a perfect environment for a weed.
Many introduced species never become invasive (Mack et al. 1996); however, for species that do, it is often due in part to the evolution of traits that enable invasiveness or increase reproduction (Li et al. 2015; Sakai et al. 2001). Well-known and well-documented examples of the evolution of increased competitive abilities demonstrate that superior competitive strength can result from or lead to invasiveness (Blossey and Notzold 1995; Dlugosch and Parker 2008a, 2008b; Sakai et al. 2001). The novel weapons hypothesis (Callaway and Aschehoug 2000) posits that inherently competitive traits may enable invasion and that positive natural selection leads to the enhancement of such traits (Callaway and Ridenour 2004; Ridenour et al. 2008). Evolution through natural selection requires variability, which may be inadequate in early-introduced populations, as founder populations are unlikely to represent the genetic variability of the native population (but see also Dlugosch and Parker 2008a). Invasive Scotch broom (Cytisus scoparius L. Link) was first introduced to the Pacific Northwest of America as three individuals brought to Vancouver Island in 1850 (Pojar and Mackinnon 1994), and only after repeated introductions of more individuals added more alleles into the gene pool (Dlugosch and Parker 2008b; Kang et al. 2007), could Scotch broom become the invasive weed that it is today. It is certain that Scotch broom did not hybridize with native congeners, as related species are not found in the region to provide an additional source of genetic diversity (Ellstrand and Schierenbeck 2000). It has been suggested instead that repeated introductions from the UK, continental France and Corsica (and possibly other sources) have resulted in a genetic diversity similar to native populations (Kang et al. 2007). This follows the pattern of similar plants [Spanish broom (Spartium junceum), Portuguese broom (Cytisus striatus) and gorse (Ulex europaeus)] from disparate European regions that have been introduced to and have become invasive in the same region.
The diversity allowed by repeated introductions, under natural selection by local forces, competitors and human interactions has given the highest fitness to the most invasive organisms (Blossey and Notzold 1995; Prentis et al. 2008), as seen in seed size variability between native and invasive populations (Buckley et al. 2013). The wide variety inherent in repeated introductions of locally adapted plants to new environments may allow them to gain a ‘home field advantage’ in a novel environment with similar selective pressures (Colautti and Barrett 2013). In a native environment, traits that make a plant more competitive may be under balancing selection due to other community effects. For instance, increased competitive ability may come at a cost of chemical defenses, and a release from herbivores may cause increased competitive ability even if plant chemistry changes only minimally (Bode and Kessler 2012). In Scotch broom, larger seeds, which make more competitive seedlings, are under balancing selection by seed-eating beetles (Paynter et al. 2015). Released from seed-eaters, populations of Scotch broom evolve larger seeds (Buckley et al. 2003), but when seed-eaters are reintroduced, seed size decreases (Paynter et al. 2015).
If Scotch broom would be predicted to perform better in the absence of a predator, it could be predicted to perform worse in the absence of a mutualist (Baker 1965; Zhang and Lou 2015). Indeed, broom is pollinator limited in its invaded range (Parker 1997) and a reduction in pollinator abundance has negative consequences for broom (Paynter et al. 2010). Scotch broom is pollinated by introduced honeybees as well as several Bombus species in the Pacific Northwest (Gillespie et al. 2017; Parker 1997; Table 1), but the pollinator community varies between sites (Bode and Linhart, in preparation). Specifically, we expect that bees are not evenly distributed along an urban to rural gradient, as arthropods are limited by urban structures (Bang and Faeth 2011; Bates et al. 2011; Bode and Maciejewski 2014; Ewers and Didham 2006; Faeth and Kane 1978; Geslin et al. 2016; Parker 2000; Saari et al. 2016, but see Fortel et al. 2014). This creates complex interactions when invasive plants and their arthropod communities interact along an urban gradient (Parker 2000). Invasive plants may find an urban center easy to colonize and free of antagonists, but may be limited by a lack of mutualists, even more than invasives normally are (Baker 1965; Richardson et al. 2000). The different interactions in a city may present different selective pressures, and urban invasive plants may be under far different selection regimes than plants of the same species in their native habitat or even a nearby rural area.
species identity (when confirmed), number collected, relative frequency, mean thorax width and mean mass
| Species | Number found | Relative frequency | Mass (mg) | Width (mm) |
|---|---|---|---|---|
| Bombus vosnesenskii | 51 | 0.380597 | 147.2917 | 4.673864 |
| Bombus sitkensis | 37 | 0.276119 | 124.1667 | 4.495833 |
| Apis mellifera | 16 | 0.119403 | 92.5 | 3.5125 |
| Bombus melanopygus | 15 | 0.11194 | 151.3333 | 4.833333 |
| Bombus occidentalis | 3 | 0.022388 | 180 | 4.7 |
| Bombus griseocolis | 2 | 0.014925 | 145 | 4.55 |
| Bombus mixtus | 2 | 0.014925 | 110 | 4.475 |
| Morphospecies 5 | 2 | 0.014925 | 90 | 4.4 |
| Bombus flavifrons | 1 | 0.007463 | 150 | 4.75 |
| Lasioglossum olympiae | 1 | 0.007463 | 30 | 3.1 |
| Morphospecies 1 | 1 | 0.007463 | 320 | 5.6 |
| Morphospecies 2 | 1 | 0.007463 | 50 | 3 |
| Morphospecies 3 | 1 | 0.007463 | 160 | 4.5 |
| Morphospecies 4 | 1 | 0.007463 | 90 | 4.05 |
Thus, although the anthropogenic disturbance of an urban habitat may be perfect for the invasive plant, attracting pollinators may become a limiting step in population growth. Under conditions of limited pollination, pollinator choice may drive evolution, as not all plants would get pollinated. Such limitation should be visible as a selection gradient, with the most attractive plants getting the lion’s share of the pollinator’s contribution to fitness. This is specifically true in the Scotch broom system, where flowers visited once are unlikely to be visited again (Parker 1997; Suzuki 2003, but see Stout 2000). When pollinators are more numerous, even less attractive plants will be visited, albeit later. Invasive species are especially good for evolutionary studies, since multiple introductions into one invasive populations may represent genetic material from multiple native populations (Mack et al. 1996). Thus, invasive populations may have more variability than native ones, and natural selection can be seen acting on a wide range of traits in a small region. Since humans have an eye for floral displays, and enjoy diversity, they may introduce more genetic variability in floral displays than in other traits. Urban ecosystems add to the complexity by changing the pollinator community, thus changing natural selection in escaped populations. In urban populations of Scotch broom, there should be a distinct pattern of natural selection on floral traits. We specifically predicted (i) plants with larger flowers would be pollinated more frequently and (ii) the selection coefficients relating flower size to visitation rate would differ between urban and rural broom populations.
METHODS AND MATERIALS
Study system
Scotch broom (C. scoparius Link) is an invasive woody legume in the Pacific Northwest of the USA. In its native range of western and central Europe (Scotland to Spain, Portugal to Poland), it is found in sunny disturbed sites. It grows up to 4 m tall and generally lives for 10–15 years (Peterson and Prasad 1998), producing large blooms annually. Flowers have the same structure as other leguminous plants, with two wings, a keel and a large banner. Flower size and color vary widely (Gavini and Farji-Brener 2015), with several cultivars having pink, purple, white or red flowers. However, yellow was by far the most common in our populations. Flower size varies between individuals and can be measured most directly by measuring banner width (Malo et al. 1995). Scotch broom is pollinated by a variety of Bombus and Apis species (Gillespie et al. 2017; Parker 1997; Stout 2000; Suzuki 2003), both native to the Pacific Northwest and introduced. Pollinators must be large enough to ‘trip’ a Scotch broom flower to be effective. This occurs when the pollinator lands on the keel and the style and stamens curl inward to deposit pollen on the pollinator’s dorsal surface. The floral parts remain in this configuration, leaving a ‘tripped’ flower. Thus, pollinated flowers can be easily distinguished from non-pollinated ones. Pollinators visiting flowers that have been tripped do not contact the stigma (Parker 1997).
Sites
In February 2015, 18 sites along Martin Way (which forms an East to West transect through the city of Lacey-Olympia in Washington State) were found. A site was defined as 20 or more mature plants (as defined by Parker 2000) separated by at least a 30 m from another site. Thirteen of these sites were within Lacey-Olympia city limits and were classified as ‘urban’, while five were outside of Lacey-Olympia and were classified as ‘rural’. Although this definition of rural and urban has functioned for many studies (e.g. McDonnell and Pickett 1990; Medley et al. 1995), we deemed it too arbitrary and replaced it with a definition more closely fitting a rigorous model (Giannotti 2016) in 2016.
In April 2016, when Scotch broom plants had flowers on all branches and had flowers being tripped by pollinators (full floral display), nine sites were chosen along Martin Way. These sites were part of 18 discovered in February 2015, but we only looked at sites that were surrounded by at least 75% developed land and were 250 m away from another site. Sites also had to be non-contiguous with any woodland or undeveloped lot. Due to urban development, two of the sites were new to this second survey. Nine new rural sites were also added, this time much farther outside of the city limits. These sites were both east and west of city limits, at similar elevations, but not bordered by developed lots. Most were roadside patches on rural routes, but were at least a quarter kilometer away from any other site.
Flower measures
In 2015, between 28 March and 6 April, when all plants had full floral displays, flower size was measured as the width of the banner to the nearest millimeter. Peak flowering was determined by watching how many new flower buds were maturing compared to how many flowers were senescing. This varied from plant to plant, but the surveys captured many plants at their largest displays. Ten flowers were measured per plant, and 15 plants were measured per site. For each plant, five tripped and five untripped flowers were measured, to control for the possibility that pollination correlated with flower size within a plant. Although we have not seen changes in floral size as flowers age, we controlled for flower age by only measuring recently opened flowers with fully expanded banners. Flowers were collected from multiple branches to ensure capturing all variation. The banner of a Scotch broom flower can be slightly convex or concave. Such slight flexing may be due to water relations and certainly varies within flower age and by time of day. To control for this variation, flowers were removed and the banners folded over a caliper. All measurements were conducted within 30 s of removing the flower from the plant to avoid wilting.
In 2016, to eliminate any phenotypic variation caused by phenological or meteorological effects, all plants were measured in a single day, 16 April. Flower size was measured as the width of the banner to the nearest millimeter. Previous measures of flowers showed that a sample size of 6 flowers per plant and 13 plants per site would be sufficient. Ten flowers were measured per plant, and 16 plants were measured per site.
Pollinator identity
To confirm that the pollinator species seen in Parker (1997) and Muir and Vamosi (2015) were present for our study, we surveyed pollinators at field sites 25 km or more from Olympia (far-rural). At these field sites, pollinators were more frequent than in the urban or rural sites surveyed for pollination rates. This could be an artifact of site size, as urban patches of broom do not cover several hectares, and we kept our rural patches similar-sized to make a suitable comparison. Far-rural sites were also presumed to have the full complement of bee species available in the region. For each captured bee, we first directly observed it tripping a Scotch broom flower. A number of flies were observed landing on banner or wings and then departing without searching for nectar or pollen or tripping the flowers, they were ignored. Bees were captured in small glass vials and kept on ice. They were brought to Saint Martin’s University, weighed, measured in both length and thorax width and identified to species using two local guides. Since both Bombus vosnesenskii and Apis mellifera workers had similar lengths, we used thorax widths as the size measurement. Bees were returned to the field site at which they were collected after measurements. Voucher specimens were kept for each species.
Pollination measures and selection coefficients
During both years, while flowers were being measured, 50 flowers per plant at each of the 15 plants per site were counted as tripped or untripped. The proportion of flowers that were tripped was taken as a measure of how successful the plant had been at attracting pollinators. Since flowers cannot be tripped by wind or age, and since flowers will not set seed without pollination (Parker 1997), the measure of proportion of flowers tripped is indicative of the pollinator contribution to fitness. The selection measured here was only the pollinator contribution to fitness. As seed set varies based on pollen source (Parker 1997), and seed viability will vary based on local conditions, herbivory (Rees and Paynter 1997) and bruchid beetle attack (Paynter et al. 2015; Prider et al. 2011), we did not include seed set or seed viability measures. By not waiting for seed maturation, additional stochastic effects between pollination and seed maturity (e.g. aphids, temperature extremes, human impacts and a regional drought) were excluded from this study.
Pollinator selection on floral size was measured by selection differentials on the proportion of flowers tripped for each plant. Selection differentials (S) measure total selection on a trait and were calculated as the regression coefficient of the relative fitness (proportion tripped/population mean) as a function of standardized banner width [mean of zero, standard deviation (SD) of one]. Regression coefficients were calculated by running a linear model on each population using R (R Development Core Team 2009).
Statistics
The relationships between flower size and proportion tripped were analyzed using a linear regression model (R Development Core Team 2009). Differences between urban and rural selection differentials and between flower sizes at urban and rural sites were analyzed using Welch’s t-test (R Development Core Team 2009).
RESULTS
Floral traits
Although the focus of this study was on floral size, we did see plants with several types of flower color. While all plants included as data had strictly yellow flowers, one rural site (Site R6), had many plants with red, purple and white winged flowers interspersed among the surveyed plants (all with yellow flowers). This site was excluded from the experiment.
Floral size varied visibly and widely, with flowers having banners as small as 17 mm and as large as 25 mm. Within plant, average SD was 0.69 mm. Banner width did not correlate with stem width (n = 18, r = 0.1122, P = 0.66). In 2015, banner width was measured at both early flowers (data not shown) and flowers produced when plants were at peak flowering to test whether it varied phenologically at these sites. Such variation was not detected when comparing within a year although other authors have suggested that banner width may vary between years (Malo et al. 1995). We did not see floral sizes differ between urban and rural populations in 2015 (Welch’s t-test, n = 18, P = 0.202) or in 2016 (Welch’s t-test, n = 18, P = 0.065).
Plants began flowering in Olympia in February and continued until June in 2015 and from early March until mid-May in 2016. Peak flowering occurred during late March and early April in 2015 and early April to early May in 2016. The 2015 flowering season was slightly longer than most years, likely due to a warm winter and early spring. A few plants flowered in October 2015, but with a minimal (<20 flowers) display and no seeds seen later. A few plants were observed to flower in August 2016, with seeds set in late October. This is not unusual for Scotch broom in its native range (Parnell 1966).
Pollination
Although flower size varied between flowers on the same plant, we did not find any indication that pollination correlated with floral size between flowers on the same plant or that floral size changed after the flower was tripped (until the flower senesced). Observations of pollinators in far-rural sites saw bees visiting several plants in sequence and avoiding tripped flowers. Pollinators would move away if an observer got within 1 m unless they were actively engaged with a flower.
In 2015, the overall regional trend was for plants with larger flowers to have higher proportions of tripped flowers (Fig. 1A; n = 227 plants, r = 0.144, P = 0.03). This was true in 2016 as well (Fig. 1B; n = 256 plants, r = 0.199, P = 0.001). Since urban arthropod communities may differ in species composition and abundance (Bode and Maciejewski 2014), it was not assumed that all sites were under the same selection. These individual trends represented pollinator choice between nearby plants, likely by the same pollinator community. Two representative selection coefficients from 2015 are shown in Fig. 2, representing one urban (Fig. 2A) and one rural (Fig. 2B) site. The remainder of the regression coefficients from 2015 and 2016 sites can be seen in online supplementary Table 1.
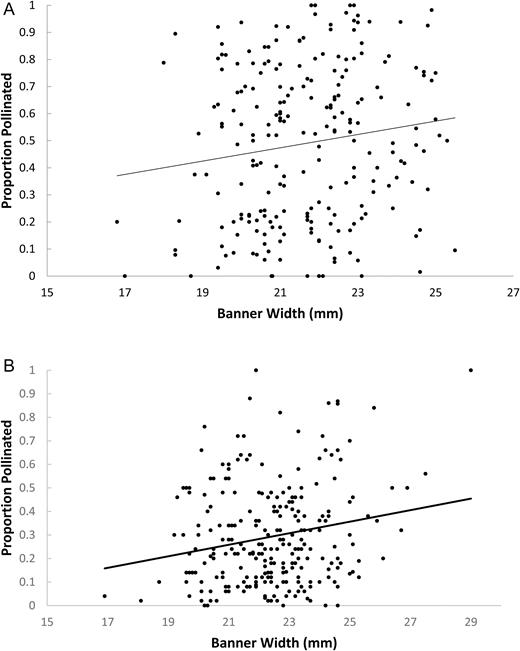
relationship between proportion pollinated and banner width for all plants surveyed at all sites in the Olympia region for 2015 (A) and 2016 (B).
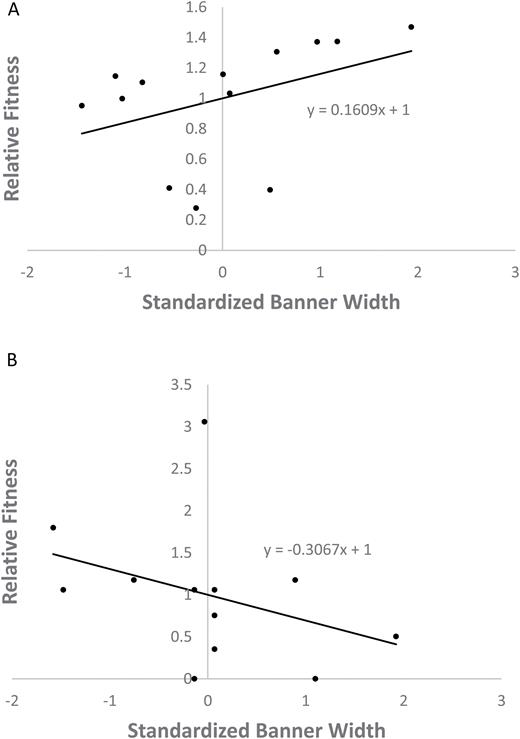
relative fitness as a function of banner width, with linear fit. The regression coefficients were used as selection coefficients in an urban (A) and rural (B) patch of Scotch broom.
Pollinators
In 2015, only two bees were seen pollinating flowers during all surveys. Both were B. melanopygus, a native bee previously noted as a pollinator of Scotch broom (Gillespie et al. 2017; Parker 1997). In 2016, only one bee was seen visiting broom flowers during the 9 h of surveys, it was not identified, but was not B. vosnesenskii, B. melanopygus, B. sitkensis or Bombus flavifrons, and was not Apis mellifera or Lasioglossum olympiae. Although previous data has shown greater pollination rates in urban sites (Parker 1996), pollinator encounters were uncommon (78 encounters in 116 h; Parker 1997). This was likely an artifact of our small site size, and visits to far-rural sites that were hectares in area yielded a higher pollinator encounter rate. Our surveys to rural sites 25 km outside of Olympia yielded better collection rates, as seen in Table 1. Pollinator identity largely confirmed Parker (1997) and later Gillespie et al. (2017). Bombus bees were the most common two species, with Apis a third most common. We found one Lasioglossum bee (Gillespie et al. 2017; Paynter et al. 2010). The second most common species was B. sitkensis, which has not been noted as pollinating Scotch broom before. Five species could not be identified and were found at most twice.
Selection
The regression coefficient of relative fitness as a function of standardized flower size (mean of 0, SD of 1) at each site was taken as the selection coefficient, representing the pollinator contribution to fitness in the absence of other contributions or factors. Selection coefficients in urban sites were positive, representing larger flowered plants attracting more pollinators. The opposite was true in rural sites in 2015, with no detectable trend in 2016. A one-tailed Welch’s t-test was used, showing significance in 2015 (Fig. 3A; n = 18, t = 3.11, P = 0.007) and 2016 (Fig. 3B; n = 18, t = 1.85, P = 0.044), indicating a difference in selection between urban and rural sites across 2 years. The consistency in selection patterns between years strongly suggests that larger flowers are favored by pollinators in urban areas although there was variability in pollinator preference in rural sites.
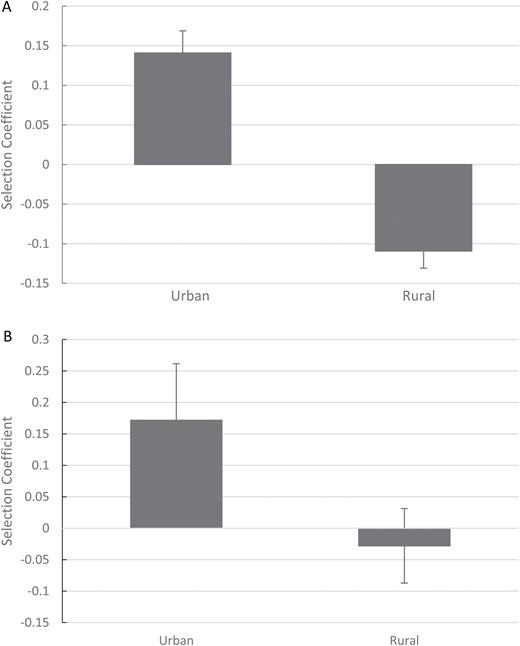
mean selection coefficients with standard errors of all patches in urban and rural sites for 2015 (A) and 2016 (B).
In 2015, an interesting exception to our trend was seen; one of the ‘urban’ sites exists in a large field between the aligned portions of Olympia and Lacey (although within Olympia city limits). The relationship between flower size and proportion pollinated here was more similar to that of rural sites. Another site exists just outside Olympia city limits, but was undergoing development. Here, there was a positive relationship between flower size and proportion pollinated, as for urban sites. These exceptions were among several reasons why the rural and urban classification and many sites were changed for 2016. Both of these sites were excluded in 2016.
DISCUSSION
If invasive plant species represent an opportunity to study rapid adaptive evolution, we must be able to find highly variable populations under different selective pressures, preferably in a relatively limited geographical area. In and around Olympia, Washington State, Scotch broom (C. scoparius) exhibits these characteristics and is thus a useful system to study the evolution of a flowering plant into a new niche. Scotch broom flowers exhibit strong variation in banner width, a reliable way of measuring floral size (Malo et al. 1995). Banner width varied from 17 to 25 mm in this region, which is more variance than found in the broom population in the Sierra de Guadarrama, where even along an altitude difference of 600 m, banner width varied only from 18 to 22 mm (Malo and Baonza 2002). It is also more variance seen in England (Stout 2000), where flower size varies from 16 to 20 mm, or in a similar species (Cytisus striatus) in Southern Spain (Rodriguez-Riaño et al. 1999) with floral sizes of 24.9 ± 0.25 mm. Such variation in our population, where altitude varied <100 m, suggests that repeated introductions of broom (Kang et al. 2007) have led to a more variable population here than would be found in native ranges, as predicted by Ellstrand and Schierenbeck (2000). The heritability of flower size in Scotch broom has not yet been investigated, but given that flower size varies little within plant (0.69 mm) and date of first flower opening varies by plant more than by site (R Bode personal observations), it is likely at least somewhat genetic and thus able to be a target for natural selection.
Natural selection on invasive plants has been shown repeatedly to lead to rapid adaptive evolution (Dlugosch and Parker 2008a, 2008b; Li et al. 2015; Prentis et al. 2008). Founder effects exist, but the genetic limit that they represent may only be temporary. The repeated introduction of new genetic material gave Scotch broom a deeper gene pool to overcome founder effects and find its ecological niche in the Pacific Northwest. While genetic material from many European locations (Kang et al. 2007) has likely increased variability for many traits, selection may allow broom to gain a ‘home field advantage’ when alleles specific to one native latitude or environment are introduced into a corresponding invaded latitude or environment (Colautti and Barrett 2013). Assuming that linkage does not prevent free association of beneficial alleles, Scotch broom could increase its’ niche breadth in the invaded environment through the adaptive evolution that comes on the heels of such high genetic variation (Colautti et al. 2017). It appears that broom is expanding the floral size niche beyond that of any native populations, given the range of flower sizes seen in this study. Two pollinators it co-evolved with in Europe (Bombus terrestris and Bombus lapidarius) are not present in the Pacific Northwest. However, broom attracts pollinators from at least 14 species, including Bombus, Apis and Lasioglossum, as has been confirmed by (Gillespie et al. 2017; Parker 1997; Paynter et al. 2010) in this and other invasive habitats. The list of species presented in Table 1 represents the highest species richness of any survey of broom pollinators, although the ~90% of pollinators were of four species. Bees from 30 to 320 mg were observed tripping the flowers, and bee width varied from 3 to 5.6 mm, although 88% of pollinators were between 90 and 151 mg and 3.5- and 4.8-mm wide. Such niche expansion has allowed Scotch broom to compete for pollinators with several different native plant species, although without noticeably affecting their fitness (Muir and Vamosi 2015).
Indeed, local pollinators appear to visit broom, and we saw different rates of pollination between plants with different sized flowers (Fig. 1). Given that at the survey time, multiple genera of pollinators were out, and floral sizes varied as much within a site as between sites, we looked at pollination rate within sites rather than overall for the region. Surveys of pollinator communities are likely to vary widely between sites, with most pollinators represented by four species, but occasional representations of 10 others. Pollinators are known to vary with seasonal patterns, with queens coming out first, followed by workers of smaller size. It was for these reasons, as well as the incredibly low encounter rate, that we did not survey pollinator communities at each site multiple times through the season. Although smaller bees have been hypothesized to be the most efficient pollinators of Scotch broom (Stout 2000), the wild bumblebee communities could be highly efficient in this urban area (Hausmann et al. 2015). We have seen Bombus species in urban sites on several other plant species, and these larger bees (Table 1) may be more represented than Apis or Lasioglossum species in urban settings (Ewers and Didham 2006; Fortel et al. 2014; Geslin et al. 2016). When comparing flowers within a site, we believe that the flowers are exposed to the same pollinators and that when we saw a selection for larger flowers (Fig. 2A), it would be due to the net choices of the entire local pollinator guild (Galen 1989). Noting that there could be different selective pressures across years (Grant and Grant 2002), we measured natural selection for 2 years, although we were more stringent in defining rural/urban classifications during the second year. We saw the same trend across both years. This does not, however, rule out that a third, fourth or eighth year could show different pressures, which could maintain genetic diversity at the sites.
Pollinators should vary between urban and rural environments, as pollination rates vary between these environments (Parker 1997) and arthropod types vary between sites in an urban setting (Bode and Maciejewski 2014). Pollinator size may be a driving force behind the different selective pressures shown in Fig. 3. Larger pollinators are more common at high elevation (Galen 1989; Malo and Baonza 2002), at least in part because of their body size. Larger pollinators may not travel as well into an urban setting due to their body size (Ewers and Didham 2006) or (as in the case with cavity nesting species) may find more environments due to nesting preferences and urban flowers (Fortel et al. 2014; Hausmann et al. 2015). In rural locations, there may be more small pollinators due to a wider diversity of non-cavity nesting sites. Local farms could attract more A. mellifera bees, which may prefer smaller flowers to accommodate their smaller size. However, since the selection for smaller flowers was only present in 1 year (and was not significantly different from 0), it is possible that a variable pollinator community may cause long-term balancing selection on floral size.
Long-term balancing selection on floral size would be one potential reason we did not see any significant difference in mean flower sizes between urban and rural sites, but would require reversals of selection gradients (Grant and Grant 2002). A more likely reason that variability in flower size has been maintained is that gene flow has been strong along the gradient we used. All sites were close to roads, and vehicles may move seeds. While our study shows a distinct urban signature for natural selection on flower size, future studies into gene flow could investigate how well this selection would result in adaptive evolution. Previous studies into Scotch broom genetics and gene movement between continents (Kang et al. 2007) should be applied to smaller scale movement.
Although this study was limited to looking at flower size, the strength of the urban signature of natural selection suggests that Scotch broom is a candidate for adaptive evolution in its invasive population. The repeated introductions (Kang et al. 2007) should lead to a gene pool more variable than any single founder population (Ellstrand and Schierenbeck 2000), which could rapidly evolve (Dlugosch and Parker 2008b) in response to local conditions, perhaps even locally adapting into differentiated populations (Colautti and Barrett 2013; Li et al. 2015). Future work should investigate gene flow as a counter to local adaptations, and understanding gene flow of an invasive, noxious weed could yield dividends in reducing spread. A study comparing populations across a latitudinal or elevation gradient, specifically including sites where pollinators are more common, would answer questions about the effects of native and introduced bees on selection gradients, pollination rates and the stability of a pollinator community in the face of extinction events (Paynter et al. 2015; Stout 2000; Suzuki 2003).
SUPPLEMENTARY DATA
Supplementary data are available at Journal of Plant Ecology online.
FUNDING
This project was funded through research start-up funds given by Saint Martin’s University and by the Murdock Charitable Trust grant number 2015277.
ACKNOWLEDGEMENTS
We thank Saint Martin’s University for the use of their facilities, equipment and fields. We also thank Nathan Krueger and Emily Prall for helping us with flower measurements in 2016 and data entry. We additionally thank the Murdock Foundation for funding two summer researchers, Emily Prall and Danner Linhart, who caught, weighed and measured bees without being stung a single time.
Conflict of interest statement. None declared.


