


Abstract
Precipitation pulses and different land use practices (such as grazing) play important roles in regulating soil respiration and carbon balance of semiarid steppe ecosystems in Inner Mongolia. However, the interactive effects of grazing and rain event magnitude on soil respiration of steppe ecosystems are still unknown. We conducted a manipulative experiment with simulated precipitation pulses in Inner Mongolia steppe to study the possible responses of soil respiration to different precipitation pulse sizes and to examine how grazing may affect the responses of soil respiration to precipitation pulses.
Six water treatments with different precipitation pulse sizes (0, 5, 10, 25, 50 and 100 mm) were conducted in the ungrazed and grazed sites, respectively. Variation patterns of soil respiration of each treatment were determined continuously after the water addition treatments.
Rapid and substantial increases in soil respiration occurred 1 day after the water treatments in both sites, and the magnitude and duration of the increase in soil respiration depended on pulse size. Significantly positive relationships between the soil respiration and soil moisture in both sites suggested that soil moisture was the most important factor responsible for soil respiration rate during rain pulse events. The ungrazed site maintained significantly higher soil moisture for a longer time, which was the reason that the soil respiration in the ungrazed site was maintained relatively higher rate and longer period than that in the grazed site after a rain event. The significant exponential relationship between soil temperature and soil respiration was found only in the plots with the high water addition treatments (50 and 100 mm). Lower capacity of soil water holding and lower temperature sensitivity of soil respiration in the grazed site indicated that degraded steppe due to grazing might release less CO2 to the atmosphere through soil respiration under future precipitation and temperature scenarios.
INTRODUCTION
Over two-thirds of terrestrial carbon is stored belowground and a significant amount of the atmospheric CO2 fixed by plants is respired by roots and microbes in terrestrial soils, so soil respiration is a key process driving the terrestrial carbon cycle (Ekblad et al. 2005; Hibbard et al. 2005). Soil temperature and soil moisture content are the principal driving variables for soil CO2 efflux at the global scale (Boone et al. 1998; Conant et al. 2004; Lloyd and Taylor 1994; Raich and Potter 1995; Raich and Schlesinger 1992; Smart and Peñuelas 2005). More attentions have been paid on the factors associated with changing climate, including temperature and precipitation, which control soil respiration and would affect exchange of carbon between terrestrial ecosystems and the atmosphere (Davidson et al. 1998).
In arid and semiarid regions, precipitation often falls as infrequent pulse events, which have been suggested to play an important role in regulating carbon balance of arid and semiarid ecosystems (Huxman et al. 2004; Xu et al. 2004). Pulses of CO2 production following wetting of dry soils have been recognized for many years (Birch 1958; Kieft et al. 1987; Liu et al. 2002), but how soil respiration responds to precipitation pulse events is still not well understood (Huxman et al. 2004; Xu et al. 2004). Neglecting such significant quantities of soil CO2 released from soils following precipitation may result in underestimates of soil respiration, particularly for arid and semiarid ecosystems where there are relatively short growing seasons (Liu et al. 2002; Luo et al. 1996; Smart and Peñuelas 2005). Generally, the response of soil respiration to precipitation events is rapid and lasts for short-time period, especially to small size rain events. Therefore, many studies on soil respiration often missed the CO2 emission pulses due to the infrequency of field sampling (Savage and Davidson 2003). In this study, a manipulative experiment was conducted to capture the rapid responses of soil respiration to precipitation events.
Inner Mongolia steppe belongs to arid and semiarid area and is sensitive to climate variation, particularly precipitation. In recent decades, the grasslands in Northern China underwent severe degradation and desertification due to intense human activities, such as overgrazing, mowing, crop cultivation, etc. (Zhou et al. 2002; Christensen et al. 2004). Grazing may impact the responses of soil respiration to a precipitation pulse, and thus affect ecosystem carbon balance, by affecting physical (bulk density, pore capacity), chemical (soil C and N concentration) and biotic (rooting depth and biomass, microbial biomass and composition) factors of soil (Jia et al. 2005; Neff et al. 2005; Stark and Kytöviita 2006; Zhou et al. 2002). However, the interactive effects of grazing and variation in rainfall event magnitude are still unknown. Therefore, it is necessary to improve our understanding how different grazing practices affect the responses of grassland ecosystems to rainfall pulses.
In this study, six water treatments with different simulated precipitation pulse sizes were conducted in the ungrazed and grazed sites in Inner Mongolia steppe. The soil respiration rate, soil temperature and soil moisture of the ungrazed and grazed sites were measured continually after the water treatments. Our objectives were to study the responses of soil respiration of typical semiarid steppe to different precipitation pulse sizes and to examine whether and how grazing affect the response of soil respiration to precipitation pulses.
MATERIALS AND METHODS
Site description
Our study was conducted in the Xilingol steppe (43° 26′ N−44° 29′ N, 115° 32′ E −117° 12′ E, 1 400 m above sea level), located in the northeastern part of Inner Mongolia, China. The Xilingol steppe is typical semiarid grassland. The dominant soil type of Xilingol steppe is chestnut soil. The mean annual temperature is 0.6°C with the highest mean monthly temperature 18.7°C and the lowest mean monthly temperature −21.4°C. The total annual precipitation is 350 mm and >70% of annual precipitation occurs during July to September (Chen and Wang 2000). Average frequency and precipitation amount of rain pulses with different sizes in recent 5 years were shown in Table 1. The most frequency of rain pulse was <5 mm, however, the rain pulse with the most precipitation amount was 10–25 mm rain event. The number and precipitation of large rain events (>50 mm) were seldom (Table 1).
average frequency and precipitation of different sizes of rain pulses during recent 5 years (2001–05) in Xilingol steppe, Inner Mongolia, China
| Size of rain pulses | Frequency (%) | Precipitation (mm) |
| P ≤ 5 mm | 66.4 ± 13.5 | 78.2 ± 18.4 |
| 5 < P ≤ 10 mm | 7.0 ± 2.1 | 48.3 ± 12.5 |
| 10 < P ≤ 25 mm | 8.2 ± 3.2 | 123.1 ± 53.3 |
| 25 < P ≤ 50 mm | 0.6 ± 0.9 | 19.7 ± 29.7 |
| 50 < P ≤ 100 mm | 0.2 ± 0.4 | 12.1 ± 27.1 |
| Size of rain pulses | Frequency (%) | Precipitation (mm) |
| P ≤ 5 mm | 66.4 ± 13.5 | 78.2 ± 18.4 |
| 5 < P ≤ 10 mm | 7.0 ± 2.1 | 48.3 ± 12.5 |
| 10 < P ≤ 25 mm | 8.2 ± 3.2 | 123.1 ± 53.3 |
| 25 < P ≤ 50 mm | 0.6 ± 0.9 | 19.7 ± 29.7 |
| 50 < P ≤ 100 mm | 0.2 ± 0.4 | 12.1 ± 27.1 |
Data in column were mean ± standard deviation. Data were provided by Inner Mongolia Grassland Ecosystem Research Station of the Chinese Academy of Sciences.
One ungrazed site and one grazed site were selected in our study. The ungrazed site (500 × 500 m) was used as grazing pasture for long time and fenced as a permanent research site from 1999. After ∼6-year restoration, the vegetation recovered and was dominated by Leymus chinensis, Stipa grandis, Achnatherum sibiricum and Carex korshinskyi in the ungrazed site. The grazed site, nearby the ungrazed site, had similar soil and vegetation conditions with the ungrazed site before 1999. However, heavily grazing (about four sheeps per ha) resulted in severe degradation in recent years. The dominated species in the grazed site was S. grandis, Agropyron cristatum, C. korshinskyi and Cleistogenes polyphylla.
Plot design and water treatments
We conducted the same precipitation pulse experiment identically both in the ungrazed and grazed sites. In each site, a random block design was used in the experiment, with three blocks (1 m space between blocks) as replicates. In each block, six plots (1 × 1 m) were randomly arranged with 1 m spaces between plots. Six water treatments were applied to the plots within one block to simulate different precipitation pulse sizes (0, 5, 10, 25, 50 and 100 mm). Water treatments were carried out in the morning and finished at the noon of 11 June 2005. Water was pumped into a tank from the Xilin River near the plots and then applied into the plots using hand sprinklers. In order to reduce runoff of water, only 5 kg water was applied into the plots each time and the amount of water was determined from mass by a mass balance. A plastic shelter was installed to prevent natural rainfall from entering the experimental plots and used to cover the plots only during the storm events.
Soil respiration measurements
Before the water treatments, a PVC soil collar (80 cm2 in area and 5 cm in height) was installed in the center of each plot, usually leaving 2 cm above ground, for measurement of soil respiration. Soil respiration was measured using a LI-6400 portable photosynthesis system attached with a LI-6400-09 soil CO2 flux chamber (LI-COR Inc., Lincoln, USA). Soil respiration was determined the day before water treatment and everyday afterward for a period of 11 days, expect for the forth and fifth day. All soil respiration measurements were made in the afternoon (15:00–17:30 pm). At the same time when the soil respiration was measured, soil temperature was measured at the 10 cm depth with a thermocouple connected to the LI-6400 system. Volumetric water content (VWC) of the 0- to 12-cm soil layer in each plot was determined with a TDR-200 soil moisture probe (Spectrum Technologies Inc., USA)
Soil and vegetation sampling and analysis
Five quadrats (1 × 1 m in size) were sampled from the adjacent area of the water treatment experiment plots in the ungrazed and grazed sites to determine the aboveground biomass of plants. In each quadrat, the aboveground parts of each species were collected and taken back to the laboratory. Fresh samples of each plant species were oven dried at 70°C for ∼48 h, and then weighed. After clipping the aboveground parts of plants, root samples of 0–20 cm were sampled with a soil core sampler (8 cm in diameter) and put into nylon bags. To measure root biomass, loose soil and organic matter were washed out of the samples in the laboratory. Rinse water was passed through a 0.5-mm sieve and root fragments on the sieves were collected. Root samples were oven dried at 70°C for ∼48 h, and then weighed. We used root biomass of the 0- to 20-cm soil layer to represent the belowground biomass of the community, as this contributes >80% belowground biomass in our study site (Chen and Wang 2000).
Soil samples of 0–10 cm were collected using a soil core sampler (5 cm in diameter) nearby to our study plots and five replicates were sampled in each site. The soil samples were air dried, and ground to pass a 100-mesh screen for soil nitrogen and organic carbon content analysis. Soil nitrogen content was determined by the Auto-Kjeldahl method (Kjektec System 1026 Distilling Unit, Sweden). Organic carbon was determined using the sulfuric acid and aqueous potassium dichromate (K2Cr2O7) mixture with external heating (Nelson and Sommers 1982). Those measurements were conducted at the Research Center of Plant Ecology, Institute of Botany, Chinese Academy of Sciences.
Statistical analysis
Statistical analyses were performed using SPSS 13.0. The significance of differences in plant height, aboveground biomass, belowground biomass, etc., of the ungrazed and grazed sites was tested by t-test. The effects of three factors (site, date and precipitation pulse size) and their interactions on soil respiration, soil moisture and temperature were analysed by repeated measures multivariate test. The significance of the differences in soil water content, temperature and respiration among water treatments were detected by repeated measures analysis of variance (ANOVA). Binary linear and exponent regressions were made between soil respiration and either soil moisture or temperature of two sites, respectively. The significances of regression coefficients were tested by ANOVA.
In this study, the ungrazed site was a permanent experiment plot fenced by the Inner Mongolia Grassland Ecosystem Research Station in 1999 and no replicate plot was designed. It is impossible to find other similar plots in this region due to heavily overgrazing. The grazed site was the area that is outside of the fence of the ungrazed site. In the strict sense, the ungrazed and grazed sites did not have real replicates. However, both of the ungrazed and grazed sites were very large (>25 and 100 ha, respectively) and relative flat (<10 degree). The vegetation and soil of both sites were homogeneous. The two sites selected in our study can represent typical un-degraded and degraded steppe ecosystems in the Xilingol steppe. Therefore, we designed the manipulative experiment plots in both sites and believed the results should be representative of Xilingol steppe. However, because of the limitation, we have to be cautious when we extrapolate our results to larger spatial scale.
RESULTS
Vegetation and soil characteristics of the study sites
There were no significant differences in the aboveground biomass between the ungrazed and grazed sites (Table 2). The belowground biomass of the ungrazed site was significantly higher than that of the grazed site. The root/shoot ratio of the ungrazed site was about twice as that of the grazed site. There were substantial litter and dead standing biomass in the ungrazed site, but the quantity of litter in the grazed site was much less than in the ungrazed site and almost no dead standing biomass was presented in the grazed site (Table 2). The ungrazed site had significantly lower soil bulk density and higher soil carbon and nitrogen content than the grazed site (Table 2).
characteristics of soil and vegetation in the ungrazed and grazed sites in Xilingol steppe, Inner Mongolia
| Parameters | Ungrazed site | Grazed site |
| Soil bulk density (g cm−3) | 1.21 ± 0.09a | 1.33 ± 0.05b |
| Soil carbon content (g kg−1) | 19.11 ± 0.96a | 16.13 ± 1.29b |
| Soil nitrogen content (g kg−1) | 1.69 ± 0.11a | 1.51 ± 0.11b |
| Plant height (cm) | 29.1 ± 5.5a | 19.1 ± 3.0b |
| Aboveground biomass (DW g m−2) | 95.4 ± 12.2a | 92.9 ± 10.6a |
| Belowground biomass (DW g m−2) | 366.1±103.1a | 198.8 ± 37.9b |
| Root/shoot ratio | 3.9 ± 1.1a | 2.1 ± 0.2b |
| Litter (DW g m−2) | 212.3 ± 35.8a | 53.9 ± 9.5b |
| Dead standing (DW g m−2) | 98.5 ± 18.1 | − |
Data in column were mean ± standard deviation (n = 5) and the significance level for the difference in each parameter between the ungrazed and grazed site was analysed by t-test. Different letters mean significant differences between two sites at P < 0.05, whereas the same letters mean that the difference between two sites is not significant (P < 0.05). Soil bulk density, soil carbon and nitrogen content and belowground biomass were the mean for the 0- to 20-cm soil layer. Because almost no dead standing was remained, so we did not collected the dead standing samples in grazed site. DW, dry weight.
Variations in soil water content and temperature after water treatments
The soil VWC did not change significantly in the control plots both in the ungrazed and grazed sites during the entire experimental period (P > 0.05), except for a decrease of VWC in the grazed site on Day 11 (Fig. 1). VWC of both sites increased rapidly after the simulated precipitation pulse addition and followed by gradual decreases. The magnitude and duration of the VWC increase depended on the pulse size (Table 3). VWC decreased to the control level on 2 days after the addition with 5 mm water, 6 days with 10 mm and 9 days with 25 mm. However, in the plots with 50 and 100 mm water addition, VWC maintained significantly higher than that of the control plots at the end of the experiment in both sites (P < 0.05). The average VWC of the ungrazed site was significantly higher than that of the grazed site, expect for the 50 and 100 mm treatment (Table 3). Site (grazing), date and pulse size each showed significant effect on VWC in both sites but no significant interactions were found among three factors (Table 4).
Mean values of soil VWC, soil temperature (Ts) and soil respiration of different water addition treatments in the grazed and ungrazed sites, Inner Mongolia
| VWC (%) | Ts (°C) | Soil respiration (μmol m−2 s−1) | ||||
| Ungrazed site | Grazed site | Ungrazed site | Grazed site | Ungrazed site | Grazed site | |
| 0 mm | 2.97 ± 0.56d | 2.17 ± 0.96d ** | 19.34 ± 1.95a | 24.68 ± 4.11ab *** | 1.55 ± 1.02e | 1.39 ± 1.07d ns |
| 5 mm | 3.30 ± 0.79d | 2.47 ± 0.90d ** | 19.88 ± 2.82a | 25.60 ± 4.74a *** | 2.11 ± 1.53de | 1.37 ± 0.75d * |
| 10 mm | 4.74 ± 1.76d | 3.84 ± 1.28d * | 19.09 ± 2.21a | 24.69 ± 4.45ab *** | 2.94 ± 1.37cd | 2.69 ± 1.69c ns |
| 25 mm | 7.77 ± 3.53c | 5.57 ± 2.86c * | 19.26 ± 2.42a | 24.07 ± 4.65ab *** | 3.58 ± 1.81bc | 3.48 ± 1.89b ns |
| 50 mm | 10.31 ± 4.27b | 9.21 ± 4.12b ns | 18.89 ± 2.34a | 23.11 ± 4.52ab *** | 4.17 ± 1.80ab | 5.12 ± 1.45a * |
| 100 mm | 12.69 ± 4.71a | 11.14 ± 4.89a ns | 18.56 ± 1.97a | 22.794 ± 4.38b *** | 4.82 ± 1.51a | 4.63 ± 1.13a ns |
The measurements on the day before water treatments were not included in the calculation of mean values of different parameters. The significance of effects of water treatments on soil respiration, VWC and Ts were determined by repeated measures ANOVA. The same letter means no significant differences among the water treatments, whereas different letters mean significant differences among treatments. The significances of the differences between the ungrazed and grazed sites were detected by t-test. *P < 0.05, **P < 0.01, ***P < 0.001, ns: no significance.
Multivariate test results for the effects of site (grazing), date and precipitation pulse size on soil respiration, soil VWC and soil temperature (Ts) in Xilingol steppe, Inner Mongolia
| VWC | Ts | Soil respiration | |||||||
| df | F | P | df | F | P | df | F | P | |
| Site (grazing) | 1 | 27.44 | <0.001 | 1 | 498.93 | <0.001 | 1 | 0.01 | 0.947 |
| Date | 9 | 274.08 | <0.001 | 9 | 423.25 | <0.001 | 9 | 138.73 | <0.001 |
| Pulse size | 5 | 183.32 | <0.001 | 5 | 10.45 | <0.001 | 5 | 52.04 | <0.001 |
| Site × date | 9 | 10.96 | <0.001 | 9 | 58.61 | <0.001 | 9 | 5.41 | <0.001 |
| Site × pulse size | 5 | 1.11 | 0.388 | 5 | 1.40 | 0.268 | 5 | 1.57 | 0.213 |
| Date × pulse size | 45 | 1.69 | 0.023 | 45 | 2.13 | 0.002 | 9 | 10.47 | <0.001 |
| Site × date × pulse size | 45 | 0.832 | 0.742 | 45 | 1.37 | 0.110 | 45 | 1.93 | 0.001 |
The significance of effects of site, date, pulse size and their interactions on soil respiration, VWC and Ts were determined by repeated measures multivariate test. df, degrees of freedom.
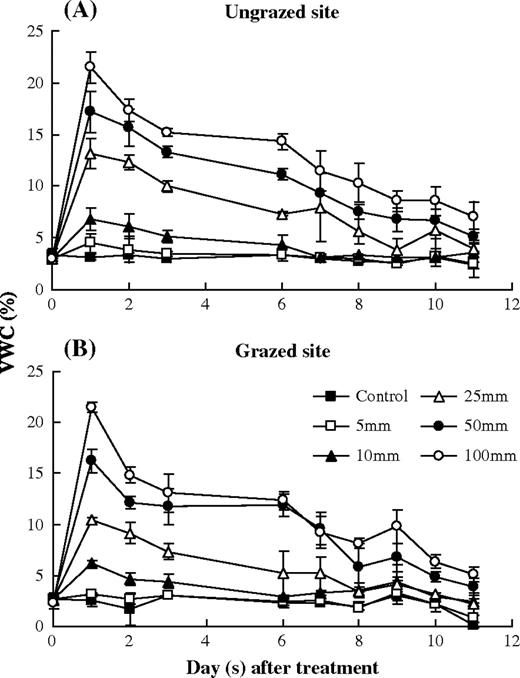
change in the of soil VWC and soil water potential of 0–12 cm soil layer affected by simulated precipitation pulses in the ungrazed and grazed sites during the rain pulse treatment period. Error bars were 1 SD.
The time courses of soil temperature (Ts) showed similar patterns with the changes in air temperature (Ta) during the water treatment period in both sites. However, Ts in the grazed site was closer to Ta than that in the ungrazed site (Fig. 2). Site, date and pulse size had significant effects on Ts in both sites (Table 4). The average Ts in the ungrazed site was significantly lower than that in the grazed site during the entire treatment period (Table 3). Pulse size significantly decreased the Ts in the grazed site, but no effects on Ts in the ungrazed site (Table 3).
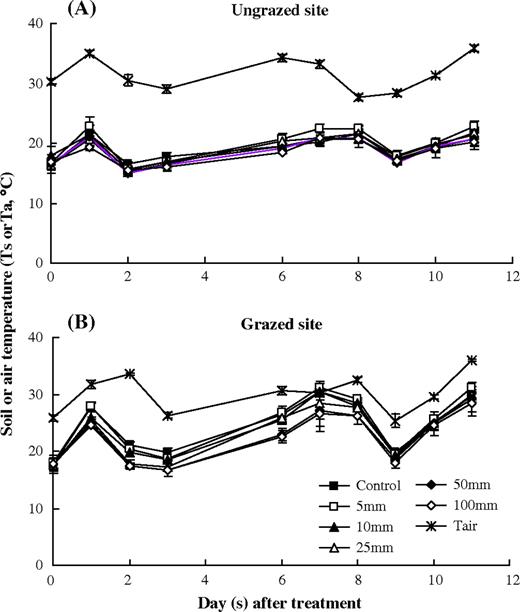
change in the soil temperature (Ts) of 0–10 cm soil layer affected by simulated precipitation pulses in the ungrazed and grazed sites during rain pulse treatment period. Error bars were 1 SD.
Responses of soil respiration to different precipitation pulse sizes
Soil respiration varied significantly with pulse size and date (P < 0.001), but no significant differences in soil respiration were observed between the two sites (Tables 3 and 4). The interactions between date and site or between date and pulse size were significant (P < 0.001). That is, both the grazing and date after water treatments showed significant effects on the responses of soil respiration to different pulse sizes.
In the control plots of both sites, the rates of soil respiration were relatively low (Fig. 3). The mean CO2 efflux rate was 1.29 ± 0.29 μmol m−2 s−1 for the ungrazed site and 1.11 ± 0.27 μmol m−2 s−1 for the grazed site, respectively. Water addition stimulated soil respiration in all treatment plots of both sites. Temporal variations of soil respiration in the two sites were similar (Fig. 3). Soil respiration increased rapidly and remarkably after the water addition, reached a peak value and then decreased. The peak rate of soil respiration was the highest (8.69 ± 1.40 μmol m−2 s−1 in the ungrazed site and 7.96 ± 0.41 μmol m−2 s−1 in the grazed site) with the 50-mm water addition, and the lowest (4.95 ± 1.69 μmol m−2 s−1 in the ungrazed site and 3.22 ± 0.28 μmol m−2 s−1 in the grazed site) with the 5-mm addition. In the ungrazed site, the peak rate of soil respiration increased significantly with precipitation pulse size, while the maximal rate of soil respiration decreased remarkably at the 100-mm water addition treatment in the grazed site (Fig. 4). The response of soil respiration to the 100-mm water addition at the first day after the treatments in the ungrazed site was significantly stronger than that in the grazed site (increasing 10.3 ± 4.0 and 4.3 ± 2.0 times than the rate of soil respiration at the day before treatment in the ungrazed and grazed sites, respectively) (P < 0.05). While, for other water addition treatments, there were no significant differences in the magnitude of increase in soil respiration between the two sites (Fig. 4). After reaching the peak, soil respiration rates rapidly decreased >50% of the peak values on the second day after water treatments in both sites (Fig. 3). The rates of soil respiration with the 5, 10 and 25 mm water additions went back to the level before the water treatments on 2, 6 and 8 days, respectively. For the 50 and 100 mm treatments, soil respiration rates at the end of experiment in both study sites stayed significantly higher than those before the water addition treatments.
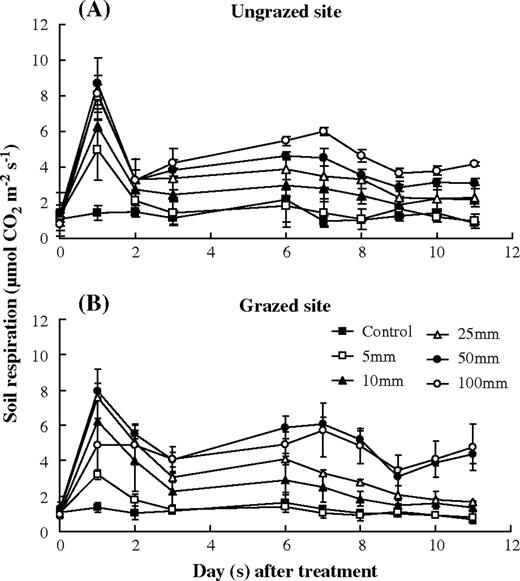
response of soil respiration to simulated precipitation pulses in the ungrazed and grazed sites. Error bars were 1 SD.
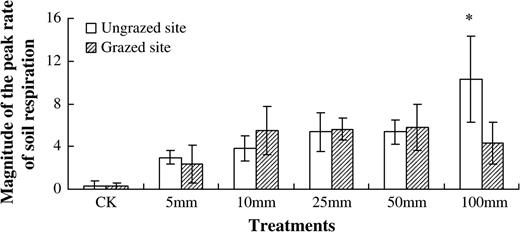
the magnitude of variations in the peak of soil respiration rate after different precipitation pulses comparing with the day before the precipitation treatment. The values of bars were calculated by (SR1 − SR0)/SR0 (SR0 and SR1 mean the rate of soil respiration in the day before treatment and 1 day after treatment, respectively). Error bars were 1 SD. Significant differences between the two sites were analysed by t-test (*P < 0.05).
Relationships of soil respiration to soil VWC and soil temperature
We pooled individual data of all of plots during the entire experimental period and found significant logarithmic relationships between soil respiration and VWC of surface soil layer in the two sites (Fig. 5). The response sensitivity (indicated by the slope of the regression formula) of soil respiration to VWC in the grazed site was similar to that in the ungrazed site. No significant relationship existed between soil respiration and soil temperature (Ts) when we pooled the data of all of plots in each site (Fig. 6). Significant exponential curves, however, could be established between soil respiration and Ts for the high water addition treatments (50 and 100 mm) in both sites (P < 0.05). Temperature sensitivity (indicated by Q10 value) of soil respiration in the ungrazed site (Q10 = 3.29) was almost twice of that in the grazed site (Q10 = 1.68). The results of binary regression analysis showed that both soil moisture and temperature can explain ∼75.2 and 66.7% (indicated by r2 values) variations of soil respiration in the ungrazed and grazed sites (Table 5).
![relationships between soil respiration and VWC in the ungrazed and grazed sites. Solid and dashed lines are the regressive curve of the grazed site [y = (1.93 ± 0.19) ln(x) + (0.16 ± 0.310), r2 = 0.63, P < 0.001] and ungrazed site [y = (2.45 ± 0.22) ln(x) + (1.17 ± 0.39), r2 = 0.69, P < 0.001], respectively. The coefficients of the equations were estimated value ± standard error.](https://oup.silverchair-cdn.com/oup/backfile/Content_public/Journal/jpe/1/4/10.1093/jpe/rtn020/2/m_jpertn020f05_lw.jpeg?Expires=1748485873&Signature=MhgbO8ypMXKgdqZmk-qclnr~ofEjD2N3Dv9z6KK3uHaf9axp4oFXFHZiCSseaLVoO2m1BWOvttk7wwYs~qAg6TPIA2Mt9z1w7cnpT9HSv4LNwZ0qkIboP-gEB-fqVaaZ9Cpb7kLQrsasHJHDyvVigClFLVJ~e0OEU~1Y~rdUcTfFpBYjDyLWmgDH~3p8OdOH3u9dcN1FL8wv5Z5bbKcVaDLrR3vHbO3Cd-hhrtTQn1hoS4tPh~fQeHNUIwSzQagvT-RxEDIZqj0JTqhLANCFUYALBKSMiT7b1cG~K-wpouC53KI-ZwX~kLrCVlQi-3ZIklQdad-putDiaklUZ3h~pA__&Key-Pair-Id=APKAIE5G5CRDK6RD3PGA)
relationships between soil respiration and VWC in the ungrazed and grazed sites. Solid and dashed lines are the regressive curve of the grazed site [y = (1.93 ± 0.19) ln(x) + (0.16 ± 0.310), r2 = 0.63, P < 0.001] and ungrazed site [y = (2.45 ± 0.22) ln(x) + (1.17 ± 0.39), r2 = 0.69, P < 0.001], respectively. The coefficients of the equations were estimated value ± standard error.
![relationships between soil respiration and soil temperature (Ts) of the 10-cm soil layer in the ungrazed and grazed sites. HW: higher water addition treatments (with 50 and 100 mm); LW: lower water addition treatments (with 0, 5, 10 and 25 mm). The equation y = a × ebx was used to descript the relations between soil temperature and soil respiration. Solid and dashed lines are the regressive curve of the grazed site [y = (1.209 ± 0.650) e(0.055 ± 0.024)x, r2 = 0.23, P = 0.03, Q10 = 1.68] and ungrazed site [y = (0.408 ± 0.409) e(0.119 ± 0.054)x, r2 = 0.21, P = 0.04, Q10 = 3.29] with higher water addition treatments, respectively. The coefficients of the equations were estimated value ± standard error.](https://oup.silverchair-cdn.com/oup/backfile/Content_public/Journal/jpe/1/4/10.1093/jpe/rtn020/2/m_jpertn020f06_lw.jpeg?Expires=1748485873&Signature=xmr8k4RzSKEUgeEP4RwAjpY3fm33cUVcY23Orx5LyVs4nvCbNEb~kTVS8eOKmHfRArZ-g7O5eKNiwbSIhAlQeZsQ6gg5Grm7MAdhz3cB2T1RsEda4EHMzyLvSVuDuVdgbKFNvx2s-Vdsa6Wv4KH1pFpJjivyIzUnBYirD~EOOI10q4juXxiCo8hF12KpsO8v7jmlIHf~gh6Qawh1frTRhUmLMpgIvmvXrdtWhGoHbgcArSFytggu1SfCXZWsy6Q3hqUb8lE9d3TTOKEBgPy9SkGTUEae1BF8bmZ19HmKKnmKZdFjAl3aOLlg-jGdKPNybApvWsfVaK2ooQy25p2VGw__&Key-Pair-Id=APKAIE5G5CRDK6RD3PGA)
relationships between soil respiration and soil temperature (Ts) of the 10-cm soil layer in the ungrazed and grazed sites. HW: higher water addition treatments (with 50 and 100 mm); LW: lower water addition treatments (with 0, 5, 10 and 25 mm). The equation y = a × ebx was used to descript the relations between soil temperature and soil respiration. Solid and dashed lines are the regressive curve of the grazed site [y = (1.209 ± 0.650) e(0.055 ± 0.024)x, r2 = 0.23, P = 0.03, Q10 = 1.68] and ungrazed site [y = (0.408 ± 0.409) e(0.119 ± 0.054)x, r2 = 0.21, P = 0.04, Q10 = 3.29] with higher water addition treatments, respectively. The coefficients of the equations were estimated value ± standard error.
DISCUSSION
Responses of soil respiration to simulated precipitation pulse
Rapid and substantial increases in soil respiration occurred on 1 day after the simulated precipitation pulses both in the ungrazed and grazed sites, and then decreased gradually. The magnitude and duration of increase in soil respiration depended on the actual pulse sizes. Our results were consistent with previous studies conducted in the semiarid grasslands (Liu et al. 2002; Maestre and Cortina 2003). The rapid changes in soil respiration may have been caused by multiple factors in rhizosphere carbon cycle processes. Firstly, significant increase in soil respiration following a rain event could be a result of degassing, i.e., water displacement of soil pore space gas with high CO2 concentration. This process is the fastest response, usually happens within seconds or minutes of water addition, and may last up to a few hours. However, degassing did not be considered as soil respiration, because it is a release of stored CO2 from past microbial and plant CO2 efflux (Liu et al. 2002). Smart and Peñuelas (2005) detected ∼15 times CO2 efflux from the soil just after 4 h wet-up in a greenhouse experiment, but very short duration (∼12 min). In this study, soil respiration was measured ∼24 h after the water addition, so this instantaneous emission of CO2 was likely missed. Secondly, precipitation pulses can activate microbial metabolism, resulting in an increase of soil CO2 efflux. The activation of microbial respiration might take several hours to days (Steenwerth et al. 2005). Thirdly, addition of water to an extremely dry soil could increase access to microbial substrate (Huxman et al. 2004). As the carbon source for CO2 released from soils, carbohydrate substrate quantity and quality play a critical role in controlling soil respiration (Wan and Luo 2003). Prior to the wetting event, the soil surface layer in our study sites was extremely dry because of the long-term drought between January to May 2005 (only 21 mm rainfall occurred during this period). Drying and rapid rewetting of soil could increase availability of labile organic substrates through microbial death and cell lysis or by destabilizing soil aggregates making physically protected soil organic matter accessible to microbes (Fierer and Schimel 2003; Harper et al. 2005). Thus, the pulses of CO2 released from soil in our sites were likely caused by triggering of microbial activity and enhancing mineralization of organic constituents after the prolonged dry conditions and rapid rewetting events.
Several previous studies showed that grazing significantly reduced soil respiration rate due to low belowground biomass, less quantity and activity of microbes and changes in soil physical and chemical properties (Cao et al. 2004; Jia et al. 2005; Johnson and Matchett 2001). In our study, grazing also decreased belowground biomass, soil nitrogen and organic carbon content (Table 2), but no significant differences were found in soil CO2 efflux rates between the ungrazed and grazed sites (Table 4). A recent investigation about soil carbon and nitrogen storage conducted in the same area with our study also showed that the soil carbon and nitrogen storage (1 m soil layer) of the grazed site were 16.4 and 13.4% lower than those of the ungrazed site, respectively (Bai 2008). A study on L. chinensis community in Xilingol steppe reported that the contribution of root respiration to soil respiration ranged from 10 to 50% depending on root biomass (Jia et al. 2006). According to their model, root respiration in the ungrazed and grazed sites accounted for 42 and 27% of total soil respiration, respectively. Root (autotrophic) respiration was less sensitive and need longer response time than microbial (heterotrophic) respiration to precipitation pulse (Huxman et al. 2004; Liu et al. 2002). Therefore, higher contribution of root respiration to soil respiration may be a reason to explain why no significantly higher soil respiration occurred in the ungrazed site than the grazed site after precipitation pulses. Scott-Denton et al. (2003) reported that heterotrophic respiration may be responsible for most of the respiration rate depression observed in dry years in a subalpine forest due to its higher sensitivity to drought. Huang and Nobel (1993) found that desert plants initialized new root growth at 7 days after rewet. Alternatively, higher soil temperature in the grazed site was in favor of higher rate of microbial decomposition and soil heterotrophic respiration. Additionally, vegetation development, penology and initial water condition would affect the responses of soil respiration to rain pulse (Huxman et al. 2004). Therefore, long-term and further studies are needed to explain the potential mechanisms of lack of differences in responses of soil respiration to rain pulse in the grazed and ungrazed sites. The highest values of soil water content of plots with 100 mm water addition in the ungrazed and grazed sites were 23 and 22%, respectively, which approached the capacity of filed holding water (∼24%) of this area reported by Li (1985). Therefore, the lower peak of soil respiration for the 100-mm precipitation pulse treatment in the grazed site maybe due to oxygen limitation in the soil, whereas lots of litter and dead standing can absorbed excessive water to prevent oxygen limitation in the ungrazed site.
Effect of grazing on the response sensitivity of soil respiration to soil moisture and temperature
Soil temperature and moisture are the main factors driving soil respiration in semiarid ecosystems, but their relative importance is still controversial (Huxman et al. 2003). In the previous studies, the relationship between soil respiration and soil moisture was determined by several functions including linear (Leirós et al. 1999), exponential and logarithmic (Davidson et al. 1998), asymptotic (Liu et al. 2002) and polynomial (Wan and Luo 2003) functions. In our study, the significant logarithmic relationships between the rate of soil respiration and VWC suggested that soil moisture was the most limiting factor for carbon decomposition during rain pulse events (Fig. 5). Liu et al. (2002) found that the lasting period of relatively higher soil CO2 emission after a rain pulse appeared to be controlled by the soil moisture content during and after the wetting event in semiarid grassland. Significant differences in VWC of the two sites on 10 and 11 days after water addition (the last 2 days of our experiment) showed that the ungrazed site could maintain relatively higher soil moisture for a longer period due to its higher coverage of vegetation, litter and dead standing. In addition, lower surface soil temperature in the ungrazed site might also reduce the loss of water. Therefore, soil respiration in the ungrazed site could be maintained relatively higher rate for longer period than the grazed site after a rain event. The differences in the regression slopes of the ungrazed and grazed sites may be attributable to the different pool sizes of liable and recalcitrant carbon at the soil surface layers (Xu et al. 2004). The significantly higher belowground biomass and soil organic carbon content in the ungrazed site supported this argument.
The temperature sensitivity of soil respiration is often indicated by the Q10, which describes the response of soil CO2 efflux to elevated temperature (Lloyd and Taylor 1994). Q10 varies with soil temperature, soil moisture and the seasons (Conant et al. 2004; Davidson et al. 2006; Scott-Denton et al. 2003). Soil moisture can influence soil respiration and its temperature sensitivity in arid and semiarid ecosystems by limiting microbial contact with available substrate and dormancy and/or death of microorganisms at low soil water potentials (Conant et al. 2004; Davidson et al. 2006). Our results showed that soil moisture could explain ∼69 and 63% variations of soil respiration in the ungrazed and grazed sites, respectively (Fig. 5), whereas soil temperature accounted <10% variations of soil respiration (Table 5). Significant exponential relationships between soil temperature and soil respiration were found only in the plots with the 50- and 100-mm water addition (Fig. 6), which indicated that soil moisture was a major limiting factor for soil respiration in plots with the 25-mm or less water additions.
Coefficients of the binary linear regression of soil respiration with soil water content and soil temperature
| a | b | c | r2 | P | |
| Ungrazed site | 0.346 ± 0.027 | 0.274 ± 0.055 | −4.547 ± 1.108 | 0.752 | <0.001 |
| Grazed site | 0.379 ± 0.035 | 0.092 ± 0.033 | −1.363 ± 0.855 | 0.667 | <0.001 |
| a | b | c | r2 | P | |
| Ungrazed site | 0.346 ± 0.027 | 0.274 ± 0.055 | −4.547 ± 1.108 | 0.752 | <0.001 |
| Grazed site | 0.379 ± 0.035 | 0.092 ± 0.033 | −1.363 ± 0.855 | 0.667 | <0.001 |
The equation is SR = a × VWC + b × Ts + c. SR means soil respiration; VWC means soil water content; Ts means soil temperature; a, b and c are the coefficients of the regression equation, respectively. The values in the columns are estimate values ± standard error.
The respiratory Q10 in the ungrazed and grazed sites with higher soil moisture condition were 3.29 and 1.68, respectively. Substrate limitation might be one of the important reasons for the significant reduction in the Q10 value of soil respiration in the grazed site. Wan and Luo (2003) reported that clipping obviously decreased Q10 of soil respiration and attributed that to decreasing substrate availability in tallgrass prairie in America. In addition to the limited substrate availability, there were other three reasons that might explain the differences in Q10 between the ungrazed and grazed sites. The first one was the higher soil temperature in the grazed site due to short of coverage of litter and dead standing in the soil surface. It is generally believed that soil respiration is more sensitive to variation in soil temperature at low temperature, while at higher temperatures it is more sensitive to changes of soil moisture (Ekblad et al. 2005). The second reason is the higher root respiration contribution to soil respiration in the ungrazed site than in the grazed site. Recent studies of temperature sensitivity of root and microbial respiration processes indicated that root respiration was more sensitive to temperature than microbial respiration (Boone et al. 1998; Smith and Johnson 2004). Thus, soil respiration in the ungrazed site was more sensitive to soil temperature changes than that in the grazed site. Third, a decrease in soil moisture content would decrease the temperature sensitivity of soil respiration (Qi et al. 2002). Although VWC in the ungrazed site was significantly higher than that in the grazed site before the water addition, the difference was very small (only 0.4%) due to prolonged drought. VWC in the grazed site, however, decreased more quickly because of the absence of plant and litter coverage. Qi et al. (2002) showed that the 1% decrease in soil volumetric moisture will reduce the Q10 value by ∼0.08.
In conclusion, rain pulse >10 mm could significantly increase the CO2 efflux from soil in Xilingol steppe, and the grazing did not significantly affect the response patterns of soil respiration to rain pulses. Liu et al. (2005) reported a significant trend of the increasing proportion of precipitation delivered by heavy rainfall events and the decreasing of light precipitation events in the arid and semiarid areas of north China based on the precipitation data of recent 40 years. Increasing rain pulse size could result in more CO2 release of soil, while the photosynthetic activity of plants would be triggered at the same time. Ecosystem carbon balance is the consequences of carbon assimilation and carbon release. Our another study found that rain pulse >25 mm could increase the carbon sequestration of a Stipa steppe in Inner Mongolia (unpublished data). Additionally, lower capacity of soil water holding and lower temperature sensitivity of soil respiration in the grazed site in relation to the ungrazed site indicated that degraded steppe due to grazing might release less CO2 to atmosphere through soil respiration under future precipitation pattern and temperature in the future. However, caution must be taken when extrapolating our results to long-term (such as whole growing season or whole year) responses of soil respiration to precipitation change. Long-term responses of soil respiration to rainfall would depend more on plant phenology and micrometeorological conditions. Therefore, further studies are needed to investigate the effects of grazing on the seasonal patterns of responses of soil respiration to precipitation pulses.
FUNDING
The National Natural Science Foundation of China (90511001 and 30521002); an Action Plan for the Development of Western China of Chinese Academy of Science (KZCX2-XB2-01-04) and a Knowledge Innovation Project of Chinese Academy of Sciences (KSCX2-SW-127).
We thank Shiqiang Wan for his constructive suggestions on the early version of the manuscript. Conflict of interest statement. None declared.


