


Abstract
Human speech has many complex spectral and temporal features traditionally thought to be absent in the vocalizations of other primates. Recent explorations of the vocal capabilities of non-human primates are challenging this view. Here, we continue this trend by exploring the spectro-temporal properties of gelada (Theropithecus gelada) vocalizations. First, we made cross-species comparisons of geladas, chacma baboons, and human vowel space area. We found that adult male and female gelada exhaled grunts–a call type shared with baboons—have formant profiles that overlap more with human vowel space than do baboon grunts. These gelada grunts also contained more modulation of fundamental and formant frequencies than did baboon grunts. Second, we compared formant profiles and modulation of exhaled grunts to the derived call types (those not shared with baboons) produced by gelada males. These derived calls contained divergent formant profiles, and a subset of them, notably wobbles and vocalized yawns, were more modulated than grunts. Third, we investigated the rhythmic patterns of wobbles, a call type shown previously to contain cycles that match the 3–8 Hz tempo of speech. We use a larger dataset to show that the wobble rhythm overlaps more with speech rhythm than previously thought. We also found that variation in cycle duration depends on the production modality; specifically, exhaled wobbles were produced at a slower tempo than inhaled wobbles. Moreover, the variability in cycle duration within wobbles aligns with a linguistic property known as ‘Menzerath’s law’ in that there was a negative association between cycle duration and wobble size (i.e. the number of cycles). Taken together, our results add to growing evidence that non-human primates are anatomically capable of producing modulated sounds. Our results also support and expand on current hypotheses of speech evolution, including the ‘neural hypothesis’ and the ‘bimodal speech rhythm hypothesis’.
1. Introduction
Human speech is a complex trait encompassing both spectral and temporal features that are argued to be unique among primates (Fitch 2000, 2010; Ghazanfar 2013). Knowing the extent to which these ‘unique’ acoustic features of speech are due to special physical and mechanical adaptations (in addition to a behavioral and neurobiological ones), however, requires a clear understanding of the physical limitations of our non-human primate relatives. To better differentiate the features that are truly unique to human speech from those which are shared, explorations of the vocal limitations of monkeys and apes are becoming increasingly common (Fitch et al. 2016; Boë et al. 2017). Here, we summarize contemporary views on spectral and temporal features thought to be evolutionarily derived—or ‘unique’—acoustic features of speech compared to the vocal capacities of other primates. For each of these unique acoustic features, we briefly review current findings from non-human primate studies that put the ‘uniqueness’ of each feature into question. Additionally, we further test the boundaries of what makes human speech unique by providing new analyses of the spectro-temporal vocal capacities of the gelada (Theropithecus gelada), a monkey known for its dynamic vocal behavior (Richman 1976, 1987; Aich et al. 1990; Gustison et al. 2012; Bergman 2013; Benítez et al. 2016; Gustison et al. 2016).
1.1 Spectral features of vocal production in humans and other primates
Source-filter theory is a well-established framework used to understand spectral components of vocal signal production in humans and other terrestrial vertebrates (Chiba and Kajiyama 1941; Fant 1960; Taylor and Reby 2010; Fitch and Suthers 2016; Taylor et al. 2016). This theory describes vocal signal production as a two-step process in which specific parts of the vocal apparatus contribute in independent ways to the final vocal signal. The ‘source’ signal, or ‘glottal wave’, is created by vibrations in the vocal folds that result in a series of frequency components known as the fundamental frequency (f0) and its harmonic overtones (Titze et al. 2015). The ‘filter’ signal, is the result of the source signal being molded by the resonance properties of the supralaryngeal vocal tract. These resonance properties are dictated by the shape of the oral and nasal cavities which results in emphasized frequencies, or ‘formants’, denoted by Fn (Titze et al. 2015). Humans appear to be the only primates able to flexibly control the formants of their vocal signals, primarily through the modification of articulators (e.g. tongue, lips, velum, and lower jaw); the relationships between the first three formants make up distinct vowels (Lieberman et al. 1969; Fitch 2000; Ghazanfar and Rendall 2008). The five monophthong vowels most common across languages are /α/, /i/, /ɛ/, /o/, and/u/, and many of these make up the extreme corners of vowel space area (VSA) (Maddieson 1984). English VSA, for example, ranges between/i/as in ‘beet’ with a low-frequency F1 and high-frequency F2, /u/ as in ‘boot’ with a low-frequency F1 and a low-frequency F2, and /a /or /ɑ /as in ‘boss’ with a high-frequency F1 and a moderate-frequency F2 (Fitch and Hauser 1995).
A widely accepted hypothesis about why non-human primates lack control of their formant profiles is that they are limited by the anatomical design of their vocal tracts. Referred to as the ‘peripheral hypothesis’ (Fitch et al. 2016), this hypothesis originally gained traction in the 1960s when Lieberman and colleagues (Lieberman et al. 1969) simulated the formants of a rhesus macaque based on vocal tract shape variation in an anesthetized monkey to conclude that rhesus macaques have a physically constrained range of acoustic variability. This hypothesis was supported by a similar study on chimpanzees (Lieberman et al. 1972) and remains the prevailing hypothesis to explain why humans appear to have the unique ability to flexibly modulate the spectral properties of their vocalizations (Crystal 2003; Yule, 2006; Raphael et al. 2007).
An alternative hypothesis is that non-human primates have the anatomical capacity to modulate their vocal system in a speech-like way, but lack the brain mechanisms needed to do so (Hockett 1960). Referred to as the ‘neural hypothesis’ (Fitch et al. 2016), this hypothesis is gaining attention as emerging research on monkey and ape vocal systems challenge the peripheral hypothesis. Case studies on captive gorillas (Gorilla gorilla) and orangutans (Pongo abelii) suggest that great apes can control their vocal tract enough to acquire new vocalizations with vowel- or consonant-like properties (Lameira et al. 2014; Perlman and Clark 2015; Lameira et al. 2016). Moreover, old world monkeys like chacma baboons (Papio ursinus), hamadryas baboons (Papio hamadryas), and rhesus macaques (Macaca mulatta) produce short vocalizations—often referred to as ‘grunts’—that have formant profiles that align closely with human vowels (Andrew 1976; Fitch 1997; Owren et al. 1997; Rendall 2003; Rendall et al. 2005; Pfefferle and Fischer 2006; Ghazanfar et al. 2007; Boë et al. 2017). Recently, Fitch and colleagues (Fitch et al. 2016) found that rhesus macaque vocal tract configurations were highly diverse during natural behaviors (i.e. vocalizing, facial displays, and feeding). They concluded that macaques have the capacity to vocalize in a large formant space but lack the neural mechanisms for doing so. In addition, a recent study looking across the vocal repertoire of baboons found that they produce a broad range of sounds indicating extensive articulatory control (Boë et al. 2017). Together, these findings suggest that non-human primates’ ability to modulate the spectral properties of vocalizations may not be as constrained as predicted by the peripheral hypothesis (Owren et al. 1997; Fitch et al. 2016). Still lacking is a comparative understanding of the limits of non-human primates in their ability to modulate f0 and formant profiles, particularly within single vocalizations (Pisanski et al. 2016).
1.2 Temporal features of vocal production in humans and other primates
The human ability to modulate sound extends beyond the spectral domain to the temporal domain. Among the ‘unique’ temporal features of human speech are the ∼5 Hz (3–8 Hz range) rhythm in the production rate of small meaningful units like syllables and phonemes bounded by consonants; this speaking rhythm (i.e. 3–8 syllables per second) is facilitated by the controlled movement of facial articulators (e.g. tongue and lips) and breathing (Malécot et al. 1972; Crystal and House 1982; MacLarnon and Hewitt 1999; Greenberg et al. 2003; Crystal et al. 2008; Chandrasekaran et al. 2009). The 3–8 Hz rhythm is thought to be a universal characteristic of human speech and exists in all languages studied to date, including British English, American English and French (Chandrasekaran et al. 2009). Disrupting the natural speaking rhythm reduces intelligibility (Drullman 1994; Shannon et al. 1995; Saberi and Perrott 1999; Smith et al. 2002; Elliott and Theunissen 2009). This reduction occurs, in part, because the human auditory cortex appears designed to entrain to a speech rhythm in the approximate range of 3–8 Hz (Schroeder et al. 2008; Peelle and Davis 2012; Gross et al. 2013).
Furthermore, the variation in human speech rhythm abides by Menzerath’s law, which states ‘the greater the whole, the smaller its constituents’ (Menzerath 1954; Malécot et al. 1972; Altmann 1980; Köhler 2012). Originally, this law was used to characterize structural properties of written text (Altmann 1980; Teupenhayn and Altmann 1984), and it has since been applied to a wide range of complex systems including music and genomic structures (Boroda and Altmann 1991; Ferrer-i-Cancho and Forns 2010). Menzerath’s law applies to spoken language in that syllable duration decreases (and syllable rate increases) with increasing phrase or utterance lengths (Grégoire 1899; Lindblom 1968; Crystal and House 1990; Malécot et al. 1972; Nakatani et al. 1981; Quené 2008; Schwab and Avanzi 2015). Better understanding of the levels at which Menzerath’s law operates will help us gain insight into the role of self-organization (Köhler 1987) and compression of information (Cramer 2005; Köhler 2012) in the evolution of complex vocal systems.
It has been presumed that humans can vocalize at rates 10 times faster than any non-human primate (Lieberman et al. 1992), and this was thought to be because non-human primates are highly constrained by their breathing and facial articulator abilities (Lieberman 1968; MacLarnon and Hewitt 1999; Ghazanfar and Rendall 2008). Current research challenges these presumptions, however, and a model—the bimodal speech rhythm hypothesis—proposes that rhythmic facial expressions, like lip-smacking, characterized our ancestral primates and set the stage for the fast paced vocalizations that would later become speech (Ghazanfar 2013; Ghazanfar and Takahashi 2014). Data from studies on monkey lip-smacking supports this hypothesis by showing that, like humans, rhesus macaques (Macaca mulata) move their mouths in a 3–8 Hz rhythm, and this range is preferred by observer monkeys over faster or slower rhythms (Ghazanfar et al 2012, 2013). Since then, data on the ‘faux-speech’ calls of Sumatran orangutans (Pongo abelii) and the ‘wobble’ calls of geladas (Theropithecus gelada) show that non-human primates can even go one step further; both species move their lips in a ∼3–8 Hz rhythm while vocalizing (Bergman 2013; Lameira et al. 2015, 2016, 2014). These findings extend the biomodal speech rhythm hypothesis by demonstrating that the coupling of voice to rhythmic facial expressions may not be as complex an evolutionary process as previously thought (Ghazanfar and Takahashi 2014).
We still lack enough data to build an understanding of the processes shaping rhythm variability in primate vocalizations. In other words, what determines when a primate vocalization will be produced at 3 Hz compared to 8 Hz rhythm? The data on gelada ‘wobbles’, for example, were limited to wobbles produced on an inhale. This is significant because it is known from human research that vocal tract anatomy operates differently during exhaled and inhaled speech, which results in slower voice-onset times in exhaled speech (Ng et al. 2011; Moerman et al. 2016; Vanhecke et al. 2016). As such, a gelada wobble produced on an exhale may have a rhythm that overlaps more or even less with the 3–8 Hz of human speech compared to inhaled wobbles (which range from 5.0–7.5 Hz according to Bergman (2013)). The number of wobbles cycles might also make a difference in dictating rhythm. Similar to how Menzerath’s law applies to speaking rates in human speech, geladas produce sequences of calls at rates that increase as the sequence size gets larger (Gustison et al. 2016). Yet, even the longest of these call sequences (a 26-call sequence) are produced at the relatively low rate of 3.018 calls per second. It remains to be seen whether the lip movement rhythm of single vocalizations, notably wobbles, gets faster as wobble size increases. Data on how production mode (inhale and exhale) and wobble size (number of lip smacks) influence rhythm will help refine our application of the bimodal rhythm speech hypothesis to human speech evolution.
1.3 A gelada case study
Our goal is to test the boundaries of what makes human speech unique by further exploring the spectro-temporal properties of gelada vocalizations. Geladas, a monkey endemic to the Ethiopian highlands, have been a prime example of a vocally complex non-human primate since studies on them began in the 1970s (Richman 1976, 1987; Gustison et al. 2012; Bergman 2013). Early research used case studies to illustrate that gelada calls have distinct vowel qualities, which implies that geladas control the resonance chambers of their vocal tract (Richman 1976). Recent studies show that geladas and baboons share a homologous call type (i.e. exhaled grunts) and that gelada males produce phylogenetically ‘derived’ calls which have acoustic properties (e.g. long duration, larger F1 bandwidth, higher F1 coefficient of variance) that make them more salient than exhaled grunts (Gustison et al. 2012; Gustison and Bergman 2016). These derived calls are produced almost exclusively by males (Gustison et al. 2012). Research also shows that geladas use quick changes in pitch and consonantal onsets to produce rhythmic units of sound (Richman 1987). One of the derived gelada calls, the ‘wobble’, is a form of vocalized lip-smacking that has a speech-like rhythm ranging from 6 to 9 Hz (Bergman 2013). This call is made almost exclusively by males and is the only call with a speech-like rhythm. Due to previous small sample sizes, however, it is unclear whether the periodicity of gelada wobbles follows the temporal organization pattern predicted by Menzerath’s law, although this law has emerged in larger units of gelada communication like call sequences (Gustison et al. 2016).
Here, we investigate the modulation of spectro-temporal properties in discrete gelada vocalizations. First, we measure the formant space areas and contours of gelada calls to better understand their vowel-like qualities. We do this by comparing the F1–F2, F1–F3 and F1–F4 formant space of male and female gelada exhaled grunts to chacma baboons and human vowel space area, and by testing the degree to which geladas vary their f0 and F1–F4 contours relative to baboons. Then, we compare the formant profiles and modulation of the five derived male gelada call types (inhaled grunts, exhaled moans, inhaled moans, wobbles and yawns) to exhaled grunts. These calls are used in the similar context of non-competitive social interactions. Second, we test for evidence of Menzerath’s law in the temporal organization of wobble calls to better understand the levels at which this universal principle operates. We do this by associating the cycle duration (i.e. time from mouth closed to mouth closed) with the number of cycles in each wobble. A negative association would support Menzerath’s law. We also test whether cycle duration depends on the production mode of wobbles (inhaled versus exhaled). Finally, we put the findings on gelada spectro-temporal modulation into context by integrating our conclusions with the neural hypothesis and bimodal speech rhythm hypothesis.
2. Methods
2.1 Study sites and animals
Data for this study come from three different bands in one community of wild geladas (about 1,200 individuals) living in the Sankaber area of the Simien Mountains National Park, Ethiopia (2008–2014) and a single group of chacma baboons (group C) living in the Moremi Game Reserve in the Okavango Delta of Botswana (2001–2002). The gelada units were comprised of one leader male, 0–3 follower males, and 1–11 females and their immature offspring. The chacma baboon group ranged from 82 to 91 individuals, including 9–11 adult males, 29–31 adult females and their immature offspring. All subjects were habituated to humans on foot up to 3-5 m and could be identified by unique body markings (e.g. ear tears and coloration). Research was approved by the University Committee on Use and Care of Animals (UCUCA) at the University of Michigan, the Institutional Animal Care and Use Committee (IACUC) at the University of Pennsylvania, and was carried out in accordance with the laws and approved guidelines of the Ethiopian government.
2.2 Acoustic recordings and processing
We opportunistically recorded vocalizations from 25 adult male and 32 adult female geladas (February 2008–June 2014) and 9 adult male and 15 adult female chacma baboons (April 2001–May 2002) with a Sennheiser ME66 directional microphone connected to a digital stereo recorder (Marantz PMD 660 and 661 Digital Recorder for geladas; Sony VW-D6 Professional Walkman for chacma baboons). Call recordings were chosen for spectro-temporal analyses if they were free of background noise (e.g., wind and other animal calls). A subset of these recordings have been used in other papers for different types of analyses (Gustison et al. 2012, 2016; Bergman 2013). The call types and contexts of all vocalizations were described at the time of recording. Our analyses focused on chacma baboon and gelada exhaled grunts, as well as gelada male derived calls (inhaled grunts, exhaled moans, inhaled moans, wobbles, and yawns); these are the call types that occurred repeatedly during affiliative interactions and foraging (Fig. 1). Previous studies show that these call types have a high inter-observer reliability of 96% (Gustison et al. 2012). Because gelada grunts and moans (an elongated version of a grunt) grade into each other somewhat, density plots of call durations (log-transformed) for exhaled and inhaled grunts/moans were used to determine thresholds to distinguish between grunt and moan call types (Gustison et al. 2016). These density plots show bimodal distributions. The threshold (lowest point between the two peaks) between exhaled grunts and moans was 0.768 s and the threshold between inhaled grunts and moans was 0.513 s.
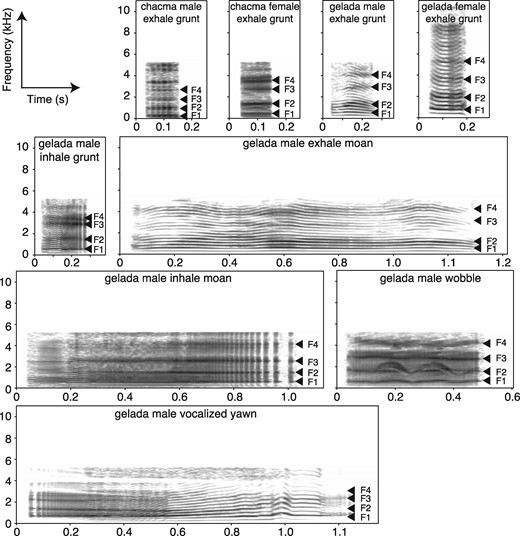
Spectrograms (Hanning window of 25 ms) of adult male and female chacma baboon and gelada exhale grunts, as well as a gelada male derived call types (inhaled grunt, exhaled moan, inhaled moan, wobble, and yawn). These are call types produced during affiliative contexts. Mean formant (1–4) frequencies are denoted by arrows. Spectrograms were made in Praat. Audio files are available for these spectrograms (Audio Files S01-09).
2.3 Spectro-temporal parameters
Extraction of spectro-temporal parameters was performed using Praat© acoustic software (version 6.0.23) on the Macintosh OX operating system (Boersma and Weenink 2011). First, we made comparisons of fundamental frequency (f0) and formant profiles (F1–F4) across species and gelada male call types. To obtain f0 contours, we used a custom Praat script that applied Praat’s autocorrelation algorithm to extract points every 6.25 ms. We set a broad search range of 25–500 Hz for chacma baboon grunts and gelada grunts, moans and wobbles. We set a search range of 25–1,000 Hz for gelada yawns since they covered a larger f0 range. All call recordings were set to a 11,025 Hz sampling frequency with no filters using Avisoft SAS Pro 5.2 (R. Specht, Berlin, Germany). f0 contours were checked manually for outliers and any artificial pitch jumps. Then, edited f0 contours were used to calculate the mean f0 frequency and f0 bandwidth (maximum f0 frequency minus minimum f0 frequency) for each call.
We identified formant contours (F1–F4) with linear predictive coding (LPC) using the burg method in Praat. We define formants as peaks in the frequency spectrum. LPC estimates the frequency values of formants based on the assumption that the vocal signal is produced by a buzz generated at the glottis or source and is shaped into resonances as it passes through the vocal tract filter (throat, mouth, and nose) (Owren and Bernacki 1998; Taylor et al. 2016). Without anatomical measurements of the vocal tract, however, it is important to note that we cannot say that these identified formants are precise estimates of vocal tract resonances. For further discussion on the definitions of formants and vocal tract resonances, please see Titze et al. (2015). Before carrying out LPC analyses, we reduced the sampling frequencies to 11,025 Hz (the nyquist frequency) so that the corresponding frequency range would be 5,512.5 Hz. The only exception to this were gelada females, for which we used sampling frequencies of 22,050 Hz. This sampling frequency was higher because female gelada grunts sometimes had harmonics that ranged beyond 5,512.5Hz. We used a 50 Hz high-pass IIR (Infinite Impulse Response) filter to dampen any lingering low-frequency background noise. Sampling frequency conversion and filtering was carried out with Avisoft SASLab Pro. This frequency range was chosen because it was the highest frequency found in the majority of gelada and chacma baboon recordings in our dataset, and it is a standard range used for studies of formants in baboons (Rendall et al. 2005; Pfefferle and Fischer 2006).
We used a Praat to extract data from LPC spectrum slices every 6.25 ms with a frequency analysis window of 25 ms and coefficient settings ranging from 14–18. We identified the first four formants (F1–F4) per slice by locating the peaks in the LPC spectra across the 0–5,512.5 Hz range. Two methods were used to check the goodness of fit of formants predicted by the LPC slices. First, LPC spectra were overlaid on three independently derived Fast Fourier Transform (FFT) spectra (512-point Hanning window with a pre-emphasis filter) at one-, two- and three-quarters of the way through each call (512-point Hanning window). Second, the formant contours were compared with the actual call spectrograms (512-point Hanning window). All recordings used in the following analyses had at least three detectable formant contours. Any outliers (i.e. points outside of the formant median ± 2 SEM) in the formant contours were removed so that there were no artificial frequency jumps. Then, edited F1–F4 contours were used to calculate the mean formant frequencies and bandwidths (maximum formant frequency minus minimum formant frequency) for each call.
Durations of inhaled wobble and exhaled wobble cycles were measured with Praat (Fig. 2a–b). A cycle corresponds to an opening and closing of the mouth. For a visual example of a wobble, see the supplementary movie published in (Bergman 2013). To quantify cycle duration, we created ‘intensity tiers’ (Bergman 2013) from a wobble using a minimum frequency of 100 Hz. Local amplitude minimums in these intensity contours were identified manually (Fig. 2c). Cycle durations were then calculated as the time between local amplitude minimums (the start of a wobble was counted as a local amplitude minimum).

A gelada male wobble: (a) spectrogram (Hanning window of 25 ms), (b) waveform, and (c) intensity contours used to extract cycles start/end times (i.e. the local amplitude minimums of intensity tiers). Images were produced in Praat. An audio file is available for this wobble (Audio File S10).
2.4 Data analysis
Formant space was determined for each formant pair (F1–F2, F1–F3, F1–F4) by calculating the ellipse of the 95% confidence region that was formed with the ‘dataEllipse’ function in the R software package ‘car’ (Fox and Weisberg 2011). These formant space areas were compared across gelada and chacma baboon exhaled grunts and human English vowels. Vowel formant frequencies in men and women were obtained from Table 5 in Hillenbrand et al. (1995). Then, two-way ANOVAs were used to compare f0, F1, F2, F3, and F4 mean frequencies and mean bandwidths across species (chacma baboon and gelada), sex and the interaction between species and sex. Linear Mixed Models (LMM) were used to compare f0, F1, F2, F3, and F4 mean frequencies and mean bandwidths across gelada male call types. In these comparisons, call type (exhaled grunt, inhaled grunt, exhaled grunt, exhaled moan, wobble, yawn) was the fixed effect. We investigated differences between call types using pairwise comparisons based on the LMM output. For the above analyses, we combined inhaled and exhaled wobble recordings into one ‘wobble’ category due to low sample size of high-quality wobble recordings.
To investigate the temporal dynamics of wobble calls, we first used Spearman rank correlation tests, a method introduced to examine Menzerath’s law and remain objective about the exact functional dependency between variables (Baixeries et al. 2013; Ferrer-i-Cancho et al. 2014; Nikolaou 2014). In these tests, cycle durations were correlated with the size (number of total cycles) of their associated wobble. If Menzerath’s law applies to wobbles, then there should be a negative association between cycle duration and wobble size. We also tried this analysis for each production mode (exhaled or inhaled) separately because it is not yet known whether the cycle length depends on the way in which a wobble is vocalized. Previous research focused on inhaled wobbles (Bergman 2013). Although use of Spearman rank correlations can help to avoid potential problems of previous research on Menzerath’s law (Ferrer-i-Cancho et al. 2014), we recognize that its application with our dataset involves pseudo-replication. Therefore, we used a LMM to test whether the variation in cycle duration corresponds to production mode (exhaled or inhaled) or wobble size (number of cycles in a wobble) while controlling for the position of the cycle within a wobble (first, second, third, etc.), the wobble recording, and caller identity. In this LMM, cycle duration was the dependent variable, wobble size and production mode (exhaled or inhaled) were fixed effects, and cycle position, wobble recording, and caller identity were random effects.
We ran the LMMs using the function ‘lmer’ of the R package ‘lme4’ (Bates et al. 2012). The ‘lmerTest’ package was implemented to determine the significance of the LMM coefficients (Kuznetsova et al. 2013). We used the ‘difflsmeans’ function in the lmerTest package to make pairwise comparisons between call types. Unless noted otherwise, all calculations and statistical tests were carried out in R 3.3.0 (R Development Core Team 2016). Critical values were set at alpha = 0.05, and all tests were two-tailed.
3. Results
3.1 Comparison of spectral properties across species
The following analyses are based on the f0 and formant measurements of 280 exhaled grunts from 73 individuals (Table 1). The formant space of adult gelada exhaled grunts covered higher frequencies compared to chacma baboons and overlapped to a large degree with human vowel space (Table 1; Fig. 3a–c). ANOVAs revealed that mean formant frequencies differed across species and sex. Geladas had higher mean f0 (F1,69 = 528.98, P < 0.0001), F1 (F1,69 = 227.98, P < 0.0001), F2 (F1,69 = 69.37, P < 0.0001), F3 (F1,69 = 104.49, P < 0.0001), and F4(F1,69 = 210.71, P < 0.0001) frequencies compared to chacma baboons. Females had higher mean f0 (F1,69 = 97.52, P < 0.0001), F1 (F1,69 = 30.43, P < 0.0001), F2 (F1,69 = 36.78, P < 0.0001), F3 (F1,69 = 82.55, P < 0.0001), and F4 (F1,69 = 116.78, P < 0.0001) frequencies compared to males. No species-sex interactions were found for mean f0 (F1,69 = 3.37, P = 0.0709), F1 (F1,69 = 0.24, P = 0.6233), F2 (F1,69 = 2.12, P = 0.1503) or F3 (F1,69 = 2.51, P = 0.1176) frequencies. There was an interaction for mean F4 in that gelada and chacma females were more different from each other than were males (F1,69 = 17.50, P = 0.0001).
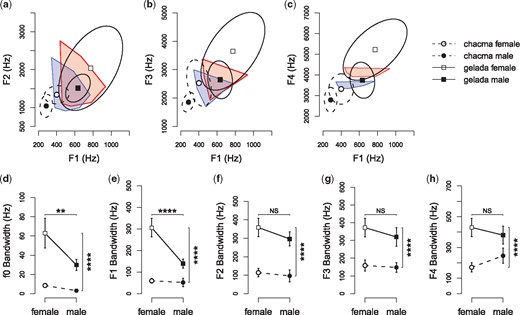
Between-species comparisons of (a–c) formant space, (d) fundamental frequency (f0) modulation and (e–h) formant modulation. Formant space comparisons were made for (a) F1–F2 space, (b) F1–F3 space, and (c) F1–F4 space in chacma baboon and gelada exhaled grunts and in human English vowels. Circle symbols and dotted lines (chacma baboons) and squares and solid lines (geladas) represent the mean formant frequencies surrounded by the 95% confidence interval ellipses. Open symbols represent females and solid symbols represent males. Human vowels (red—women; blue—men) are represented by convex hulls determined from published vowel formant frequencies (Hillenbrand et al., 1995). f0 and formant bandwidths are used to characterize modulation (d–h) in chacma baboon and gelada exhaled grunts. Points and whiskers indicate mean ± 2 SEM. To make comparisons, ANOVAs included species, sex and the species*sex interaction as fixed effects. * P < 0.05, ** P < 0.01, *** P < 0.001, **** P < 0.0001. Sample sizes (each data point representing a single individual) are reported in Table 1.
Fundamental frequency (f0), formant frequencies (F1–F4), formant dispersion (Df), and estimated vocal tract length (est. VTL) measured from the exhaled grunts of adult chacma baboons and geladas. Values listed as mean [SEM].
| Species | Sex | Subjects (# per subject) | f0 (Hz) | F1 (Hz) | F2 (Hz) | F3 (Hz) | F4 (Hz) | Df (Hz) | est. VTL (cm) |
|---|---|---|---|---|---|---|---|---|---|
| Chacma | Male | 9 (2–15) | 55.442 | 285.041 | 1,041.743 | 1,855.466 | 2,786.111 | 833.69 | 21.121 |
| [3.033] | [7.716] | [34.095] | [37.803] | [67.944] | [22.795] | [0.594] | |||
| Chacma | Female | 15 (1–5) | 130.61 | 400.38 | 1,339.255 | 2,528.91 | 3,315.737 | 971.786 | 18.148 |
| [5.553] | [12.827] | [22.534] | [77.114] | [69.447] | [23.467] | [0.416] | |||
| Gelada | Male | 17 (1–23) | 268.605 | 633.419 | 1,512.539 | 2,644.149 | 3,739.164 | 1,035.248 | 17.118 |
| [7.945] | [12.212] | [33.355] | [60.05] | [78.711] | [27.013] | [0.519] | |||
| Gelada | Female | 32 (1–6) | 383.772 | 773.731 | 2,037.829 | 3,646.951 | 5,220.054 | 1,482.108 | 11.965 |
| [9.946] | [24.192] | [76.625] | [94.151] | [101.858] | [30.07] | [0.255] |
ANOVAs also showed that f0 and formant modulation, as measured by bandwidth for each call per formant, differed across species and sex (Figure 3d–h). Geladas had larger mean bandwidths of f0 (F1,69 = 36.23, P < 0.0001), F1 (F1,69 = 79.12, P < 0.0001), F2 (F1,69 = 76.62, P < 0.0001), F3 (F1,69 = 46.84, P < 0.0001), and F4 (F1,69 = 42.49, P < 0.0001) compared to chacma baboons. Compared to males, females had larger mean bandwidths for f0 (F1,69 = 10.50, P = 0.0018) and F1 (F1,69 = 28.80, P < 0.0001), but there were no clear sex differences for F2 (F1,69 = 3.33, P = 0.0725), F3 (F1,69 = 1.82, P = 0.182) or F4(F1,69 = 0.06, P = 0.808). No species-sex interactions were found for bandwidths of f0 (F1,69 = 3.17, P = 0.0793), F2 (F1,69 = 0.66, P = 0.4199), F3 (F1,69 = 0.47, P = 0.4949), or F4 (F1,69 = 3.38, P = 0.0702). There was an interaction for F1 bandwidth in that gelada and chacma females were more different from each other than were males (F1,69 = 12.69, P = 0.0007).
3.2 Comparison of spectral properties across gelada calls
The following analyses are based on the f0 and formant measurements of exhaled grunts (n = 107 calls), inhaled grunts (n= 66 calls), exhaled moans (n = 14 calls), inhaled moans (n = 32 calls), wobbles (n = 15 calls), and yawns (n = 19 calls) made by 25 gelada males (Tables 1–2). LMMs revealed that exhaled grunts and derived calls had different formant profiles (Table 3; Fig. 4a,c,e,g,i) and levels of within-call modulation (Table 4; Fig. 4c,d,f,h,j). There was no evidence that mean frequencies and bandwidths differed between exhaled and inhaled grunts. Exhaled moans had higher mean F2 frequencies than exhaled grunts. Inhaled moans had lower mean f0 and F1 frequencies than exhaled grunts. Wobbles had lower mean F2–F4 frequencies and larger F1–F3 bandwidths than exhaled grunts. Yawns had higher mean f0 and F1 frequencies, lower mean F2-F4 frequencies, and larger f0 and F1–F4 bandwidths than exhaled grunts.
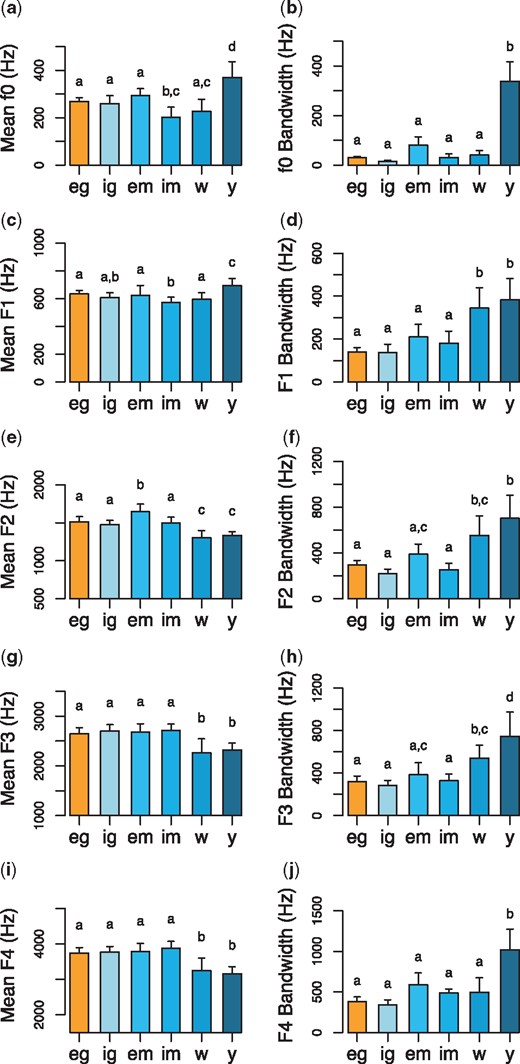
Comparisons of the mean frequencies and bandwidths of (a–b) f0, (c–d) F1, (e–f) F2, (g–h) F3, and (i–j) F4 frequencies of gelada male exhaled grunts (orange) and derived call types (shade of blue). The six call types include exhaled grunts (‘eg’), inhaled grunts (‘ig’), exhaled moans (‘em’), inhaled moans (‘im’), wobbles (‘w’), and yawns (‘y’). Bars and whiskers indicate mean ± 2 SEM. To make comparisons, LMMs included f0 and F1–F4 means or bandwidths as the dependent variable, call type as the fixed effect, and caller identity as the random effect. Letters above the bars represent the outcome of pairwise comparisons between the call types. Calls that do not share a letter differed from each other at the level of P < 0.05. Sample sizes (each data point representing a single individual) are reported in Tables 1 and 2.
Fundamental frequency (f0) and formant frequencies (F1–F4) measured from the derived calls of adult male geladas. Values listed as mean [SEM].
| Call type | Subjects (# per subject) | f0 (Hz) | F1 (Hz) | F2 (Hz) | F3 (Hz) | F4 (Hz) |
|---|---|---|---|---|---|---|
| Inhaled grunt | 14 (1–19) | 259.694 | 607.69 | 1,473.629 | 2,701.323 | 3,766.168 |
| [16.64] | [16.746] | [28.858] | [62.49] | [78.262] | ||
| Exhaled moan | 8 (1–6) | 294.225 | 624.123 | 1,644.51 | 2,676.738 | 3,778.811 |
| [14.119] | [34.747] | [50.437] | [85.385] | [115.865] | ||
| Inhaled moan | 15 (1–8) | 202.027 | 570.885 | 1,494.908 | 2,707.291 | 3,873.213 |
| [21.293] | [19.799] | [38.862] | [66.193] | [99.126] | ||
| Wobble | 9 (1–5) | 226.81 | 593.682 | 1,305.587 | 2261.6 | 3,246.065 |
| [25.475] | [24.32] | [46.38] | [140.619] | [176.438] | ||
| Yawn | 17 (1–2) | 369.45 | 693.313 | 1,333.182 | 2,320.329 | 3,156.244 |
| [33.448] | [25.637] | [23.775] | [67.317] | [101.521] |
Results of five LMMs used to test for differences in mean fundamental (f0) and formant (F1–F4) frequencies (Hz) between exhaled grunts and all derived call types. Each column represents a single LMM.
| Derived call type | f0 | F1 | F2 | F3 | F4 | ||||||||||
|---|---|---|---|---|---|---|---|---|---|---|---|---|---|---|---|
| Estimate [SEM] | t | P* | Estimate [SEM] | t | P* | Estimate [SEM] | t | P* | Estimate [SEM] | t | P* | Estimate [SEM] | t | P* | |
| Inhaled grunts | –5.12 | 0.18 | 0.8564 | –25.68 | 0.96 | 0.3435 | –38.91 | 0.84 | 0.4043 | 66.65 | 0.70 | 0.4899 | 50.09 | 0.38 | 0.7026 |
| [28.15] | [26.85] | ||||||||||||||
| [130.45] | |||||||||||||||
| [95.89] | |||||||||||||||
| [46.39] | |||||||||||||||
| Exhaled moans | 17.89 | 0.53 | 0.6006 | –14.44 | 0.45 | 0.6573 | 131.97 | 2.40 | 0.0192 | 42.02 | 0.37 | 0.7164 | 32.67 | 0.208 | 0.8358 |
| [34.00] | |||||||||||||||
| [156.92] | |||||||||||||||
| [55.11] | [115.15] | ||||||||||||||
| [32.38] | |||||||||||||||
| Inhaled moans | –69.30 | 2.49 | 0.0155 | –63.54 | 2.40 | 0.0201 | –17.63 | 0.39 | 0.6997 | 65.00 | 0.69 | 0.4942 | 144.52 | 1.12 | 0.2662 |
| [128.64] | |||||||||||||||
| [27.81] | [26.51] | [45.53] | [94.49] | ||||||||||||
| Wobbles | –44.75 | 1.35 | 0.1824 | –39.94 | 1.27 | 0.2104 | –206.95 | 3.91 | 0.0002 | –383.58 | 3.43 | 0.0010 | –488.94 | 3.21 | 0.0021 |
| [31.58] | |||||||||||||||
| [52.98] | |||||||||||||||
| [152.54] | |||||||||||||||
| [111.72] | |||||||||||||||
| [33.23] | |||||||||||||||
| Yawns | 99.33] | 3.69 | 0.0005 | 57.96 | 2.26 | 0.0280 | –179.36 | 4.07 | 0.0001 | –316.42 | 3.46 | 0.0010 | –571.43 | 4.59 | < 0.0001 |
| [26.92 | [25.66] | [124.51] | |||||||||||||
| [44.08] | |||||||||||||||
| [91.46] | |||||||||||||||
Bolded values indicate P < 0.05.
Results of five LMMs used to test for differences in the bandwidth of fundamental (f0) and formant (F1–F4) frequencies (Hz) between exhaled grunts and all derived call types. Each column represents a single LMM.
| Call type | f0 | F1 | F2 | F3 | F4 | ||||||||||
|---|---|---|---|---|---|---|---|---|---|---|---|---|---|---|---|
| Estimate [SEM] | t | P* | Estimate [SEM] | t | P* | Estimate [SEM] | t | P* | Estimate [SEM] | t | P* | Estimate [SEM] | t | P* | |
| Inhaled grunts | –11.61 | 0.43 | 0.6681 | –0.81 | 0.02 | 0.9856 | –75.427 | 0.94 | 0.3521 | –40.37 | 0.46 | 0.6460 | -41.73 | 0.43 | 0.6708 |
| [26.94] | |||||||||||||||
| [87.48] | |||||||||||||||
| [97.68] | |||||||||||||||
| [44.87] | [80.54] | ||||||||||||||
| Exhaled moans | 40.81 | 1.26 | 0.2126 | 70.55 | 1.32 | 0.1898 | 92.16 | 0.96 | 0.3386 | 55.66 | 0.53 | 0.5961 | 192.28 | 1.64 | 0.1055 |
| [32.41] | |||||||||||||||
| [104.51] | |||||||||||||||
| [95.68] | [117.12] | ||||||||||||||
| [53.31] | |||||||||||||||
| Inhaled moans | 1.25 | 0.05 | 0.9625 | 42.29 | 0.96 | 0.3401 | –42.07 | 0.53 | 0.5963 | 7.13 | 0.08 | 0.9342 | 108.47 | 1.13 | 0.2639 |
| [96.20] | |||||||||||||||
| [26.57] | [44.05] | [79.06] | |||||||||||||
| [86.03] | |||||||||||||||
| Wobbles | 3.77 | 0.12 | 0.9051 | 205.46 | 4.01 | 0.0001 | 255.99 | 2.78 | 0.0068 | 216.48 | 2.15 | 0.0354 | 112.05 | 0.99 | 0.3268 |
| [31.52] | [51.26] | [100.89] | [113.45] | ||||||||||||
| [92.00] | |||||||||||||||
| Yawns | 308.87 | 12.01 | < 0.0001 | 243.90 | 5.72 | < 0.0001 | 406.03 | 5.30 | < 0.0001 | 425.91 | 5.11 | < 0.0001 | 643.97 | 6.92 | < 0.0001 |
| [25.71] | |||||||||||||||
| [76.55] | [83.28] | [93.11] | |||||||||||||
| [42.65] | |||||||||||||||
Bolded values indicate P < 0.05.
3.3 Temporal properties of gelada wobble calls
We analyzed 28 inhaled and 25 exhaled wobble recordings (composed of a total of 239 cycles) recorded from 25 study males (1–14 wobble recordings per male). The wobbles ranged between 2 and 17 cycles and a total duration of 0.376–2.763 seconds. Cycle duration averaged 0.204 ± 0.006 seconds (4.912 Hz) and ranged from 0.555 to 0.056 seconds (1.802–17.857 Hz) (Fig. 5). Inhaled wobbles ranged between 2 and 7 cycles (mean duration of 0.180 ± 0.007 seconds (5.569 Hz) and range of 0.555–0.080 seconds (1.802–12.500 Hz). Exhaled wobbles ranged between 2 and 17 cycles (mean duration of 0.221 ± 0.008 seconds (4.522 Hz) and range of 0.544–0.056 seconds (1.838–17.857 Hz).
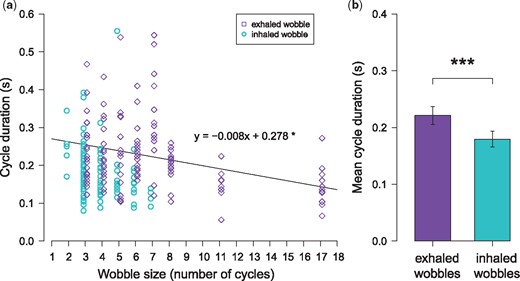
Associations between cycle duration and (a) wobble size and (b) production mode. Cyan circles represent individual cycles from inhaled wobbles and purple diamonds represent individual cycles from exhaled wobbles. Points and whiskers in plot (b) indicate mean ± 2 SEM. To make comparisons, LMMs included cycle duration as the dependent variable, wobble size and production mode as fixed effects, and wobble recording, cycle position, male identity as random effects. * P < 0.05, ** P < 0.01, *** P < 0.001, **** P < 0.0001.
We first used Spearman rank correlations to test how the durations of wobble cycles were related to the size (number of cycles) of their corresponding wobbles. We found a negative correlation between cycle duration and wobble size (rho = –0.156, P = 0.0156; Fig. 5a). This negative association was also characteristic of exhaled wobbles only (rho = –0.330, P < 0.0001) and inhaled wobbles only (rho = –0.410, P < 0.0001). We then used a LMM to investigate how variability in cycle duration was associated with both wobble size and production mode (exhaled and inhaled) while including cycle position, caller identity, and wobble recording as random effects. Corroborating the findings of the Spearman correlation, the LMM showed a negative association between cycle duration and wobble size (Estimate ± SEM = –0.008 ± 0.003, t = 2.731, P = 0.0138; Fig. 5A). Cycles were shorter in inhaled compared to exhaled wobbles (Estimate ± SEM = –0.065 ± 0.016, t = 3.951, P = 0.003; Fig. 5b). To test whether the slopes between wobble size and cycle duration differed based on wobble type, we ran a separate model to investigate whether there was an interaction between wobble type and size. We found no evidence that this was the case (Estimate ± SEM = –0.010 ± 0.009, t = 1.112, P = 0.2721).
4. Discussion
Gelada vocalizations exhibited spectro-temporal dynamics that had several similarities to the modulatory capacity of human speech as compared to the vocalizations of their baboon relatives. We found that gelada exhaled grunts covered a formant space area that overlapped more with human vowel space area (VSA) than did chacma baboon grunts. The f0 and first four formants were more modulated in gelada grunts than in chacma baboon grunts. Also, the exhaled grunts and derived calls showed diverse formant profiles. Wobbles and yawns had particularly high levels of f0 and formant modulation. We also found that wobbles, vocalized lip-smacking with a speech-like rhythm, has a rhythm that overlaps more with human speech than previously thought. Wobble rhythm depends on the production mode (inhaled versus exhaled) of the call and the size (number of cycles in a wobble). Following Menzerath’s law, wobble cycle duration was shorter if the corresponding wobble size was larger. Together, these findings suggest that geladas have a significant capacity to modulate the spectro-temporal dynamics of their vocalizations, which in turn, has important implications for proposed hypotheses on the evolution of a speech-like ability in primates.
Previous research on the vocal capabilities of our non-human primate relatives has supported one of two hypotheses, the ‘peripheral’ hypothesis or the ‘neural’ hypothesis. The neural hypothesis advocates that non-human primates have the anatomical capacity but lack the neural mechanisms to flexibly control how they modulate their sounds (Hockett 1960; Fitch et al. 2016). The present study falls in line with several other recent studies on apes and old world monkeys supporting the neural hypothesis (Fitch et al. 2016; Lameira et al. 2016, 2014; Boë et al. 2017). Our findings support the neural hypothesis in three ways. First, our cross-species comparison suggests that geladas have a greater ability to control the spectral properties of grunt calls than do baboons, whose grunts were already thought to cover a substantial degree of formant space (Owren et al. 1997; Rendall et al. 2005; Boë et al. 2017). The formant space of gelada grunts overlapped more with human VSA than baboon grunts. Specifically, gelada male formant space fell in the VSA shared by men and women, and female geladas covered most of women’s VSA. Moreover, gelada males and females varied the formant (and f0) frequencies within individual grunts to a level that exceeded the relatively unmodulated grunts made by chacma baboons. One potential caveat of the present study is that formants were measured by finding peaks in spectrum rather than vocal tract resonances, and so, there are limits to comparisons that can be made with human VSA. Modeling research on the vocal anatomy of modern humans, Neanderthals and rhesus macaques suggests that a combination of physical traits can result in larger formant space: a lower larynx, increased pharynx size, and enhanced gestures of the tongue body (lips and jaw) (Lieberman et al. 1969; Lieberman and Crelin 1971; Boë et al. 2002). Recent studies in macaques and baboons suggest that human-like anatomy is not necessary for producing calls that cover a wide formant space (Fitch et al. 2016; Boë et al. 2017). However, without morphological data on gelada vocal tract anatomy, we do not know what, if any, anatomical adaptations underlie their diverse vocalizations. Regardless, the current findings still suggest that geladas have a greater tendency to vary the spectral properties of their calls than do chacma baboons.
The second way in which our data support the neural hypothesis is through comparisons of the homologous and derived call types produced by gelada males. Exhaled grunts (the homologous call type shared with baboons) had a similar degree of f0 and formant modulation as inhaled grunts and inhaled/exhaled moans, but they were less modulated than wobbles and yawns. Additionally, the exhaled grunts and most of the derived calls had unique formant profiles. The only call types that had similar formant profiles were exhaled and inhaled grunts. The diversity in formant profiles across these six call types is important because these are the calls used to form call sequences (Gustison et al. 2016). Thus, a given vocal sequence will contain enhanced spectral modulation if it combines derived call types with exhaled/inhaled grunts. Presumably, geladas must exhibit some control over their supralaryngeal vocal tract so they can flexibly filter sound across a single call or call sequence. Furthermore, the variability that we describe is almost certainly underestimating the capabilities of geladas as we focus on only those calls used in the same contexts (affiliative social interactions) as grunts. Including more acoustically divergent calls such as alarm calls, screams, and display calls, would likely expand the formant space covered by geladas as it does in baboons (Boë et al. 2017).
The third way in which our data support the neural hypothesis is through the speech-like rhythmic capacity of gelada male wobble calls. We replicated previous findings showing that gelada males move their facial articulators (e.g. mouth) during wobbles in a similar rhythm to human speech. By using a larger dataset than previous research (Bergman 2013), we show that the rhythm of this vocalized lip-smacking overlaps more with human speech rhythm than previously thought. In the present study, wobble rhythm ranged from 2 to 15 Hz, which overlaps entirely with the 3–8 Hz rhythm of speech (Chandrasekaran et al. 2009). Moreover, this wobble rhythm depends on the production mode, with exhaled wobbles having longer cycles on average than inhaled wobbles. Furthermore, we found evidence that the variation in wobble rhythm abides by Menzerath’s law (Grégoire 1899; Quené 2008) in that there is a negative association between wobble cycle length and wobble size. In other words, wobble tempo got faster as wobble size got larger. Menzerath’s law also applied to inhaled and exhaled wobbles separately, although it should be noted that it is unclear the degree to which this pattern in exhaled wobbles is driven by the cycle durations of an unusually large 17-cycle wobble (Fig. 5). The presence of Menzerath’s law in gelada vocalizations also has been discovered at the level of call sequences in that calls from larger sequences had shorter durations than calls from smaller sequences (Gustison et al. 2016). Our current findings therefore demonstrate that Menzerath’s law, and by extension the compression of vocal signals, operates at multiple levels of gelada communication. Additionally, these speech-like patterns of rhythm modulation in gelada calls support the neural hypothesis and expand on the bimodal speech rhythm hypothesis. The bimodal speech rhythm hypothesis proposes that primate rhythmic facial expressions set the stage for fast paced vocalizations (Ghazanfar 2013). The current findings expand on this hypothesis by showing that geladas not only have the capacity to couple vocalization to rhythmic facial expression, but that ‘linguistic’ laws of compression predict the variability in this rhythm. Thus, the coupling of voice to facial movement is not an adaptation specific to human speech.
Our findings have implications for research on the selective pressures driving derived vocal traits in humans and geladas. In humans, listeners have a difficult time understanding speech that has smaller vowel space, reduced articulation, and abnormal speech tempos (Bradlow et al. 1996; Neel 2008). These speech deficits are characteristic of people with dysarthria, Parkinson’s, depression, and PTSD (Post-Traumatic Stress Disorder), for example (Volkmann et al. 1992; Skodda et al. 2012; Whitfield and Goberman 2014; Levy et al. 2015; Scherer et al. 2016). Thus, expanded VSA and moderately paced syllable rates are crucial for the effective transfer of complex information. It does not appear that the expanded formant space and speech-like rhythm in the gelada male vocal system has led to enhanced referential information transfer. Rather, social functions appear more important. A playback study showed that gelada females appear to pay more attention to male utterances that included derived call types with the greatest formant modulation—exhaled moans, wobbles and yawns (Gustison and Bergman 2016). Considering that there is a sex-bias in the production of these call types, it is likely that sexual selection played a role in driving the morphological and/or behavioral traits needed to produce complex sounds (Gustison et al. 2012). These findings align with human studies showing that men tend to use a larger and more unique vocabulary around women, and women tend to prefer men with a larger vocabulary (Rosenberg and Tunney 2008; Prokosch et al. 2009).
There is notable debate over which traits of speech are unique to humans (Boë et al. 2002; MacLarnon and Hewitt 2004; Ghazanfar and Rendall 2008; Fitch 2010). Our findings on the spectro-temporal properties of gelada calls add to this ongoing conversation by building on hypotheses about the evolution of complex vocal ability. By exhibiting a high degree of modulation in the spectrum-based and temporal-based features of their calls, as compared to baboons, geladas challenge the traditional hypothesis that non-human primates lack the physical capacity to produce complex speech-like sounds. Instead, our findings support the alternative hypothesis that primates have a capacity to produce complex sounds but lack the appropriate neural mechanisms to fully control this capacity. The distinction between humans and other primates on the basis of vocal ability may be smaller than previously assumed. Future work will be essential in identifying selective pressures that may have contributed to the evolution of these modulatory skills in geladas and other non-human primates.
Acknowledgements
MLG was supported by grants from the National Geographic Society (Gr# 9122-12, W304-14), Leakey Foundation, University of Michigan, and Petridish (primary supporter: John Allen). TJB and the gelada project were supported by the Wildlife Conservation Society (SSF Gr# 67250), the National Geographic Society (Gr# 8100-06), the Leakey Foundation, the National Science Foundation (Gr# BCS-0715179, BCS-0962118, IOS- 1255974), and the University of Michigan. Research in Botswana was supported by NIH grant MH62249, an NRSA fellowship to TJB, the Leakey Foundation and the University of Pennsylvania. We are grateful to the Ethiopian Wildlife Conservation Authority and the wardens and staff of the Simien Mountains National Park for granting us permission to conduct this research in Ethiopia. We thank the Office of the President and the Department of Wildlife and National Parks of the Republic of Botswana for permission to conduct research in the Moremi Reserve. We thank Dorothy L. Cheney and Robert M. Seyfarth and for permission to use recordings of chacma baboon grunts and Aliza le Roux for use of gelada wobble and grunt recordings. We also thank Schuyler Cohen for help constructing the customized Praat scripts.
References
