


Abstract
Monitoring metabolites of tamoxifen, such as endoxifen, has been suggested as a strategy to ascertain therapeutic effect of tamoxifen therapy, but clinical guidelines are missing. Herein, we aim to investigate the outcome of endoxifen concentrations of low-dose tamoxifen, using change in mammographic breast density as a proxy for therapy response.
In the randomized KARISMA-Tam (Karolinska Mammography project for risk prediction of breast cancer -Intervention Study with Tamoxifen) trial, including 5 doses of tamoxifen, measurements of plasma endoxifen concentrations, determination of CYP2D6 metabolizer status, and mammographic breast density change over the trial period were carried out. Association between endoxifen concentrations and relative mammographic breast density change after 6 months treatment was analyzed using linear regression in a spline model.
A total of 824 women (335 premenopausal, 489 postmenopausal) were included. In analyses of premenopausal women, a spline model described a mammographic breast density decrease, equivalent to the mean (−18.5%) seen in women exposed to 20 mg tamoxifen, at endoxifen concentrations of 2-3 ng/mL. The mammographic breast density decrease reached a nadir at endoxifen levels of 3 ng/mL and did not decrease further at higher endoxifen concentrations. Most intermediate and normal tamoxifen metabolizers (about 90% of all participants) reached an endoxifen concentration of more than 2 ng/mL at tamoxifen doses of 5 and 10 mg. No mammographic breast density decrease was seen in the postmenopausal group.
We have identified a possible window of effect on mammographic breast density at endoxifen concentrations of 2-3 ng/mL in premenopausal women, which corresponds to the doses of 5 and 10 mg tamoxifen. Because mammographic breast density change was used as a surrogate marker for therapy response, results should be confirmed using clinically established outcomes measures.
Introduction
Tamoxifen decreases the incidence of breast cancer in healthy women and reduces recurrence of the disease in patients.1 Tamoxifen and its metabolites bind to the estrogen receptor altering downstream signaling, and the affinity to the receptor is nearly 100 times stronger for what is considered to be the most potent metabolite endoxifen compared with the parent drug.2,3
There are several possible reasons for the interindividual differences in tamoxifen effect. Low adherence due to menopausal-like side effects is one explanation. It has been reported that within 5 years of a breast cancer diagnosis, 30%-70% of the patients continue to adhere to endocrine therapy.4,5 Another explanation is the polymorphism of the CYP2D6 gene responsible for most of the conversion of tamoxifen to endoxifen.6 Women identified with poor CYP2D6 metabolizer status have a worse prognosis7 possibly because of low concentrations of endoxifen. In contrast, extensive metabolizers experience more side effects than normal metabolizers, which likely reduce adherence.8,9
Monitoring plasma levels of endoxifen could offer a possibility to identify patients outside the therapeutic window of endoxifen concentration.10 However, the therapeutic threshold of endoxifen for primary prevention is not known. A suggested level of 5.97 ng/mL11 has reached clinical acceptance in cancer treatment but has not been confirmed in prospective studies12,13 and has been questioned because of methodological deficits.14,15 The 5.97 ng/mL threshold has been challenged by a concentration nearly 50% lower (3.36 ng/mL).16 In a recent study, neither of these thresholds were associated with better outcome.17
In 2016-2019, we conducted a randomized, double-blinded 6-armed tamoxifen prevention trial, KARISMA-Tam (Karolinska Mammography project for risk prediction of breast cancer -Intervention Study with Tamoxifen), in healthy women, aiming to identify the lowest dose of tamoxifen, which is as effective in reducing mammographic density as the clinically established 20 mg dose.18 Primary outcome was mammographic breast density change because a change in mammographic breast density during tamoxifen therapy has been found to be associated with a favorable outcome for tamoxifen therapy response, both in the preventive and adjuvant settings.19,20 It was shown that doses of 2.5, 5, and 10 mg of tamoxifen lowered mammographic breast density to the same extent as 20 mg. Further, women randomly assigned to 2.5 mg of tamoxifen had a 50% reduction in reported severe vasomotor symptoms. The mammographic breast density decrease was confined to premenopausal women only.18
The aim of this study was to use data from the KARISMA-Tam trial to identify an endoxifen concentration that reduces mammographic breast density to the same extent as 20 mg of tamoxifen and to study the effect of CYP2D6 metabolizer status on endoxifen plasma levels in healthy women treated with 5 different doses of tamoxifen.
Methods
Study design
Being an exploratory analysis of the tertiary objective in the KARISMA-Tam trial (relate levels of tamoxifen metabolites and changes in breast tissue to different tamoxifen doses), the analyses were not predefined in the protocol.18 The KARISMA-Tam trial (ClinicalTrials.gov ID: NCT03346200) is an investigator-initiated, double-blind randomized placebo controlled 6-armed dose-determination trial conducted in Sweden. The primary outcome was to identify the minimal dose of tamoxifen noninferior in its ability to reduce mammographic breast density compared with 20 mg of tamoxifen. Healthy Swedish women, aged 40-74 years, attending the population-based national mammography screening program were invited. In short, participants were treated daily for 6 months and randomly assigned to placebo, 1, 2.5, 5, 10, or 20 mg of tamoxifen. All participants signed informed written consent before entering the study. The trial was approved by the ethics review board, Stockholm, Sweden (Record no: 2016/65-31/2). Detailed information on inclusion and exclusion criteria, random assignment, blinding, and baseline characteristics can be found elsewhere.18 Premenopausal women randomly assigned to 20 mg of tamoxifen had a mean density decrease of 18.5% over the 6-month period. The percentage of women who reach this decrease in the placebo, 1, 2.5, 5, and 10 mg arms were 38.9%, 39.5%, 52.5%, 49.3%, and 50.0%, respectively. In the postmenopausal group, the overall mean density change was 0.1%. The mean density change in the placebo, 1, 2.5, 5, 10, and 20 mg arms were −0.6%, −2.4%, −3.0%, 10.7%, −0.2%, −4.0%, respectively. There was no statistically difference in mean change between the placebo arm and the standard dose arm in postmenopausal women. It was concluded that 2.5, 5, and 10 mg of tamoxifen were noninferior to 20 mg in their ability to decrease mammographic breast density, driven by the effect seen in premenopausal women.
We included women in the per-protocol population of the KARISMA-Tam trial, that is, women randomly assigned to an active dose and participating for the full 6-month trial period. The reason to only include women who participated for the entire treatment period was that our outcome variables (mammographic breast density change and metabolite concentrations) were affected by treatment duration.21,22 Steady state of endoxifen is known to be reached after 2-3 months.22 The vast majority of discontinuers ended tamoxifen treatment within the first 3 months.9 Discontinuation was evenly distributed across dose arms (see Figure 1). As a sensitivity analysis, the intention-to-treat (ITT) population (all women who had measurements of mammographic breast density and endoxifen concentrations regardless of exposure period) was also analyzed.
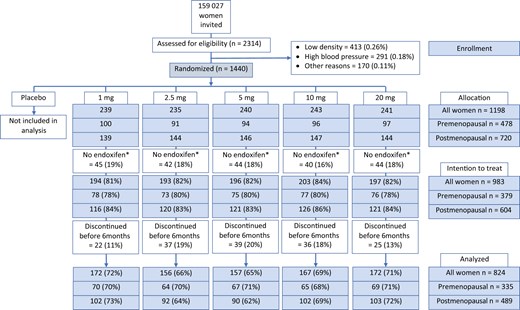
CONSORT diagram for the KARISMA-Tam trial. In total, 159 027 women were invited to participate, and 2314 (1.4%) women were investigated for inclusion to the study. In all, 874 (0.55%) women were excluded because of too low mammographic density (0.26%), hypertension (0.18%), and other reasons (0.11%). The remaining 1440 (0.9%) women were randomly assigned into placebo, 1, 2.5, 5, 10, or 20 mg of tamoxifen, 240 women in each arm. Women randomly assigned to placebo (n = 242) and those where endoxifen concentrations were not measured (n = 215) were excluded, leaving 983 women in the intention-to-treat population. Participants who discontinued (n = 159) were excluded leaving 824 (335 premenopausal, 489 postmenopausal) women in the per-protocol population. *Concentrations of tamoxifen and its metabolites (z-endoxifen, N-Desmethyltamoxifen, 4-hydroxytamoxifen) were not measured because of protocol deviation, loss to follow-up, or analysis failure.
Mammographic breast density change
Mammographic breast density was measured as area density (cm2) and mammographic breast density change over time as the relative difference between baseline and 6-month estimates as described previously.23 The mammographic breast density was measured using the fully automated STRATUS method. The average dense area (cm2) of left and right breasts at baseline was calculated and compared with average dense area at the end of the trial period. The calculation was performed after images were aligned, meaning images from different time points are positioned for optimal comparability to avoid difference in density with nonbiological meaning. The method has been previously described.23
Measurements of tamoxifen, its metabolites, and CYP2D6 phenotypes
At end of study, plasma analyses of tamoxifen, endoxifen, afimoxifen (4-hydroxytamoxifen), and N-DM-Tam (N-Desmethyltamoxifen) were performed using a validated high-performance liquid chromatography-tandem mass spectrometry (TSQ Quantiva with Dionex Ultimate 3000 system, Thermo Scientific, Waltham, MA, USA). This method was developed at the Karolinska University Hospital Clinical Pharmacology laboratory, successfully validated according to the guideline on bioanalytical method validation (European Medicines Evaluation Agency [EMEA]/CHMP/EWP/192217/2009 Rev.1 Corr.2) and described elsewhere.24 CYP2D6 activity score and metabolizer status were determined using a method previously defined, and participants were classified as poor, intermediate, normal, or ultrarapid CYP2D6 metabolizers.9
Statistical methods
For descriptive purposes, we calculated the Pearson correlation coefficient to measure the strength of the bivariate linear relationships between tamoxifen and the 3 metabolites. Differences in endoxifen concentrations between pre- and postmenopausal women and between CYP2D6 phenotypes were tested using the Mann–Whitney U test. The association between endoxifen concentrations and relative mammographic breast density change was estimated using a linear regression model with splines (restricted cubic splines with 4 knots, 3 placed at the quartiles of the endoxifen distribution and 1 at 10 ng/ml). The reason for using splines was to avoid assuming a linear or log-linear relation between endoxifen and mammographic breast density change. The results from the spline models are displayed in graphs showing mean curves and 95% confidence intervals. Because of wide confidence intervals at the highest endoxifen levels, the x-axis was truncated at the 99th percentile of the endoxifen distribution.
All calculations were performed on the per-protocol population and stratified on menopausal status. All P values were 2-sided, and confidence intervals were set at the 95% level. Analyses were conducted in Stata software (StataCorp 2021; Stata Statistical Software: Release 17, StataCorp, LLC, College Station, TX, USA) and SPSS version 28.
Results
A total of 159 027 women were invited to the KARISMA-Tam trial; 1440 (0.9%) women were randomly assigned. After exclusion of women randomly assigned to placebo (n = 242), those where endoxifen concentrations were not measured because of protocol deviation, loss to follow-up or analyses failure (n = 215), and those who discontinued (n = 159), a total of 824 (335 premenopausal, 489 postmenopausal) women were included in the per-protocol study. The corresponding figure for the ITT group was 983 women (Figure 1).
The correlation between tamoxifen and 3 metabolites—endoxifen, 4-OH-Tam, and N-DM-Tam—was strong and ranged from 0.74 to 0.94 (Pearson correlation). Correlations were not influenced by menopausal status (Table S1).
The proportion of all women scored as poor, intermediate, normal, and ultrarapid CYP2D6 metabolizers was 6.4% (n = 53), 41.0% (n = 338), 50.7% (n = 418), and 1.8% (n = 15), respectively. No differences were seen when CYP2D6 phenotypes were stratified on menopausal status or tamoxifen doses (Table 1).
Number of participants by tamoxifen dose (mg) and CYP2D6 metabolizer status, stratified on menopausal statusa
| Tamoxifen dose | ||||||
|---|---|---|---|---|---|---|
| CYP2D6 metabolizer status, No. (%) | All | 1 mg | 2.5 mg | 5 mg | 10 mg | 20 mg |
| All women | 824 | 172 | 156 | 157 | 167 | 172 |
| Poor | 53 (6.4) | 9 (5.2) | 13 (8.3) | 7 (4.5) | 14 (8.4) | 10 (5.8) |
| Intermediate | 338 (41.0) | 78 (45.3) | 67 (42.9) | 59 (37.6) | 74 (44.3) | 60 (34.9) |
| Normal | 418 (50.7) | 82 (47.7) | 75 (48.1) | 86 (54.8) | 77 (46.1) | 98 (57.0) |
| Ultrarapid | 15 (1.8) | 3 (1.7) | 1 (0.6) | 5 (3.2) | 2 (1.2) | 4 (2.3) |
| Premenopausal | 335 | 70 | 64 | 67 | 65 | 69 |
| Poor | 20 (6.0) | 6 (8.6) | 5 (7.8) | 2 (3.0) | 2 (3.1) | 5 (7.2) |
| Intermediate | 145 (43.3) | 27 (38.6) | 27 (42.2) | 28 (41.8) | 34 (52.3) | 29 (42.0) |
| Normal | 166 (49.6) | 36 (51.4) | 32 (50.0) | 36 (53.7) | 28 (43.1) | 34 (49.3) |
| Ultrarapid | 4 (1.2) | 1 (1.4) | 0 (0.0) | 1 (1.5) | 1 (1.5) | 1 (1.4) |
| Postmenopausal | 489 | 102 | 92 | 90 | 102 | 103 |
| Poor | 33 (6.7) | 3 (2.9) | 8 (8.7) | 5 (5.6) | 12 (11.8) | 5 (4.9) |
| Intermediate | 193 (39.5) | 51 (50.0) | 40 (43.5) | 31 (34.4) | 40 (39.2) | 31 (30.1) |
| Normal | 252 (51.5) | 46 (45.1) | 43 (46.7) | 50 (55.6) | 49 (48.0) | 64 (62.1) |
| Ultrarapid | 11 (2.2) | 2 (2.0) | 1 (1.1) | 4 (4.4) | 1 (1.0) | 3 (2.9) |
Including women in the per-protocol population (n = 824).
The overall median endoxifen concentrations were statistically non-sigfnificant different comparing premenopausal (2.27 ng/mL) with postmenopausal (2.42 ng/mL) women (Table 2). In the 5 mg tamoxifen arm, overall endoxifen concentrations were statistically significant lower in premenopausal compared with postmenopausal women (Table 2).
Median endoxifen concentrations (ng/mL) and interquartile range by tamoxifen dose (mg) and CYP2D6 metabolizer status, stratified on menopausal statusa
| Tamoxifen dose | ||||||
|---|---|---|---|---|---|---|
| Menopausal status and CYP2D6 phenotype | All, median (IQR) | 1 mg, median (IQR) | 2.5 mg, median (IQR) | 5 mg, median (IQR) | 10 mg, median (IQR) | 20 mg, median (IQR) |
| Premenopausal | 2.27 (0.79-5.20) | 0.43 (0.29-0.60) | 1.01 (0.65-1.44) | 2.40 (1.76-3.09) | 4.45 (2.66-6.64) | 10.10 (6.47-14.55) |
| Postmenopausal | 2.42 (0.92-5.82) | 0.52 (0.33-0.68) | 1.20 (0.83-1.55) | 3.06 (1.93-4.24) | 4.83 (3.26-7.01) | 11.81 (7.41-16.27) |
| Pdifference | .137 | .065 | .122 | .012b | .488 | .324 |
| Premenopausal | ||||||
| Poor | 0.63 (0.20-2.63) | 0.15 (0.09-0.20) | 0.44 (0.40-0.67) | 1.20 (0.65-) | 1.54 (1.23-) | 3.78 (2.98-6.44) |
| Intermediate | 2.24 (0.72-4.66) | 0.39 (0.27-0.52) | 0.78 (0.63-1.09) | 2.22 (1.61-2.85) | 3.79 (2.42-4.87) | 8.59 (5.98-11.68) |
| Normal | 2.37 (0.92-6.71)b | 0.48 (0.38-0.77)b | 1.27 (0.95-1.66) | 2.48 (1.97-3.27)b | 5.93 (4.67-7.92) | 12.57 (9.42-17.09) |
| Ultrarapid | 3.42 (1.38-13.30) | 0.81 (NA) | NA | 3.74 (NA) | 3.09 (NA) | 16.48 (NA) |
| Pdifferencec | .011 | .003 | <.001 | .096 | <.001 | <.001 |
| Postmenopausal | ||||||
| Poor | 1.10 (0.53-2.33) | 0.21 (0.15-) | 0.47 (0.41-0.61) | 0.99 (0.93-1.38) | 1.91 (1.53-2.39) | 3.73 (2.75-4.81) |
| Intermediate | 1.81 (0.53-4.47) | 0.36 (0.27-0.50) | 1.14 (0.79-1.51) | 2.47 (1.79-3.73) | 4.38 (3.29-5.80) | 8.66 (5.22-13.53) |
| Normal | 3.82 (1.20-8.58)b | 0.67 (0.54-0.83)b | 1.34 (1.08-1.67) | 3.73 (2.54-4.65)b | 5.83 (4.28-8.43) | 13.47 (9.07-17.95) |
| Ultrarapid | 4.51 (2.05-11.73) | 0.72 (NA) | 2.29 (NA) | 3.29 (2.06-4.81) | 4.95 (NA) | 12.56 (NA) |
| Pdifferencec | <.001 | <.001 | .003 | <.001 | <.001 | <.001 |
Including women in the per protocol population (n = 824). All tests performed by Mann–Whitney U test of distribution.
Statistically significant difference by menopausal status (P ≤ .05).
P value for statistically difference between poor or intermediate and normal or ultrarapid.
When comparing overall median endoxifen concentrations by CYP2D6 metabolizer status in pre- and postmenopausal women separately, normal and ultrarapid metabolizers demonstrated statistically significant higher concentrations compared with intermediate and poor metabolizers. In premenopausal women, the difference was statistically significant for all doses except for the 5 mg arm (Table 2).
Among the 20 premenopausal women scored as poor metabolizers, the median endoxifen concentration was 0.63 ng/mL (IQR = 0.20-2.63 ng/mL) ranging from 0.15 ng/mL in the 1 mg tamoxifen group to 3.78 ng/mL in the 20 mg group (Table 2). The corresponding values for poor metabolizers in the postmenopausal group (n = 33) were 1.10 ng/mL (IQR = 0.53-2.33 ng/mL), ranging from 0.21 ng/mL (1 mg) to 3.73 ng/mL (20 mg; Table 2).
Normal metabolizers in the premenopausal group (49.6% of all women) had an overall median endoxifen concentration of 2.37 ng/mL, ranging from 0.48 ng/mL (1 mg) to 12.57 ng/mL (20 mg). The median concentration in postmenopausal women with normal CYP2D6 metabolizing activity was statistically significant higher compared with premenopausal (3.82 ng/mL; IQR = 1.20-8.58). Values for women found to be intermediate metabolizers were wedged in between poor and normal metabolizers (Table 2).
Based on the per-protocol population, we used a spline model, for pre- and postmenopausal women separately to describe the association of endoxifen concentration on mammographic breast density change after 6 months of exposure to tamoxifen (Figure 2; Figure S1). In premenopausal women, the mammographic breast density decrease reached the average decline of the 20 mg tamoxifen arm (18.5% decrease) at endoxifen concentrations of 2-3 ng/mL. At approximately 3 ng/mL, the decrease reached a nadir and did not seem to further decline at higher endoxifen concentrations (Figure 2). Most of the endoxifen concentrations seen in women randomly assigned to 5, 10, and 20 mg of tamoxifen was above 2 ng/mL, whereas most of the measures in women randomly assigned to 1 and 2.5 mg was below 2 ng/mL (Figure 2). No statistically significant effect of endoxifen on mammographic breast density was seen in postmenopausal women (Figure S1).
![Mean relative mammographic breast density change, z-endoxifen concentrations (ng/mL) and, inserted in the figure, tamoxifen-dependent z-endoxifen concentrations (vertical dash-symbols; from lightest [1 mg] to darkest [20 mg]) in premenopausal women. The dashed line indicates the mean relative mammographic breast density seen in women randomly assigned to 20 mg of tamoxifen. Including women in the per-protocol population (n = 335).](https://oup.silverchair-cdn.com/oup/backfile/Content_public/Journal/jnci/117/4/10.1093_jnci_djae280/1/m_djae280f2.jpeg?Expires=1750239020&Signature=wI6VVAzXL5LnLKcgIqESf71ui8923n869N2g0YNxM1wkv0nFRIgxobZq35Z2M2ctR8wu-HhGTfbS6J06enb775lxrBqiiOD1OokZosLeUzamMobLF4cMGYqergeQBFKrqv8PDJ0zbmV5sUi6gQ-x12ETrWxN~MfuBALrw-8egGX4YqXq5gl6lK2RxB6jWunpuVhVWf9RuetCYQ4E2jzLeNdxwvNP1zX8vXQ0md0oRtjvWruHKKw9Y~uYyudAEQvmZ55fRyETpXPL36ZGFLoyz6ltr8PLsmL0gXLwke9~XUKeu8FxgPJ-SgwrtNw3SGjPpntC-HXevtFnMob9slT5Wg__&Key-Pair-Id=APKAIE5G5CRDK6RD3PGA)
Mean relative mammographic breast density change, z-endoxifen concentrations (ng/mL) and, inserted in the figure, tamoxifen-dependent z-endoxifen concentrations (vertical dash-symbols; from lightest [1 mg] to darkest [20 mg]) in premenopausal women. The dashed line indicates the mean relative mammographic breast density seen in women randomly assigned to 20 mg of tamoxifen. Including women in the per-protocol population (n = 335).
A spline model including the ITT population was generated with similar results as seen in the per-protocol population (Figure S2).
Spline models describing the association of tamoxifen, afimoxifen (4-OH-Tam), and N-DM-Tam with mammographic breast density change revealed a similar relationship between mammographic breast density change and plasma concentrations that was seen for endoxifen (Figure 2; Figure S3).
We also tested if the mammographic breast density change was influenced by the ratio of endoxifen to N-DM-Tam. The ratio was divided into 3 equally large groups of participants. No statistically difference was found, neither on a categorical or on a continuous scale (data not shown).
Discussion
Using a spline model, only including premenopausal women, we identified a window of effect on mammographic breast density at an endoxifen concentration of 2-3 ng/mL. Endoxifen concentrations above 3 ng/mL did not seem to further decrease mammographic breast density in premenopausal women. For most intermediate and normal CYP2D6 metabolizers (consisting of about 90% of all women in the trial), 5 mg of tamoxifen was a high enough dose to reach the 2-3 ng/mL window and 10 mg to reach above the 3 ng/mL threshold.
We have previously shown that 6 months of exposure to 2.5, 5, and 10 mg of tamoxifen decrease mammographic breast density to the same extent as 20 mg in premenopausal but not postmenopausal women.18 So far, the KARISMA-Tam trial is the only randomized controlled trial investigating how metabolites of tamoxifen doses 1, 2.5, 5, 10, and 20 mg are associated with a potential therapeutic effect. With few exceptions,25,26 most studies that investigated the relationship between endoxifen concentrations and clinical outcome were observational and confined to the 20 mg standard dose of tamoxifen.
In an adjuvant setting, Madlensky et al. described a therapeutic endoxifen threshold of 5.97 ng/mL (16 nM) in 20 mg of tamoxifen.11 However, in the first prospective study testing this threshold, the CYPTAM trial, including 667 breast cancer patients, neither the 5.97 ng/mL threshold nor CYP2D6 genotypes were associated with a worse clinical survival outcome.12 In another study challenging the 5.97, Helland et al.16 describe a poorer breast cancer survival in endoxifen concentrations below 3.36 ng/ml, which is close to our finding of no added effect of endoxifen doses above approximately 3 ng/mL.
In the primary prevention TAM-01 trial, including pre- and postmenopausal women with an increased risk of breast cancer, DeCensi et al.27 showed that 5 mg of tamoxifen reduced invasive and noninvasive breast cancer events by 50% after 3 years of daily treatment. In a secondary exploratory analysis, they described that the effect was statistically nonsignificantly greater in postmenopausal women.28 The median endoxifen concentration after 1 year of treatment in the 5 mg arm of the TAM-01 study population was 3.13 ng/mL (IQR = 1.94-4.22 ng/mL), with a nonsignificant difference in concentrations between those with a recurrence (n = 7; 2.80 ng/mL, IQR = 1.90-3.80 ng/mL) and nonrecurrence (n = 156; 3.13 ng/mL, IQR = 1.98-4.25 ng/mL).26 The finding from the TAM-01 trial supports our results of a threshold around 3 ng/mL and our indication that the clinical threshold could be even lower than 3.13 ng/mL.
As can be seen from Table 2, tamoxifen doses of 1 and 2.5 mg are not sufficient for premenopausal women to reach endoxifen concentrations of 2-3 ng/mL. In contrast, 20 mg of tamoxifen seems to result in concentrations above what is needed (Table 2), based on our data and previously published results. Being a premenopausal intermediate or normal CYP2D6 metabolizer, 10 mg of tamoxifen gave median endoxifen concentrations of 3.79 and 5.93 ng/mL, and 5 mg gave median endoxifen concentrations of 2.22 and 2.48 ng/mL (Table 2). As can be seen from Figure 2, most premenopausal women on a tamoxifen dose of 5 and 10 mg are found in the interval between 2 and 3 ng/mL or above. Notably, none of the participants in the 5 mg tamoxifen arm reached 5.97 ng/mL, and only 29% reached this concentration among participants randomly assigned to 10 mg.
In agreement with prior results,9 we found the proportion of women being ultrarapid (1.8%) or poor (6.4%) metabolizers to be low. We have previously shown that these groups have a worse survival when treated with tamoxifen in the adjuvant setting.8 Poor metabolizers do not convert enough tamoxifen to active metabolites, while ultrarapid metabolizers prematurely discontinue therapy, most likely because of side effects.
There was a high degree of correlation between the 3 measured metabolites, and we chose to focus on endoxifen because it is the metabolite described to have the highest affinity to the estrogen receptor and the highest plasma concentration.29,30
The spline models measuring the influence of metabolite concentrations on mammographic breast density change did not differ between endoxifen, afimoxifene (4-OH-Tam), N-DM-Tam, or tamoxifen (Figure 2; Figure S3). These results and our finding of no association of endoxifen to N-DM-Tam ratio and mammographic breast density change may support the notion that endoxifen is the most relevant tamoxifen metabolite when using mammographic breast density change as a marker for effect. However, the strong correlation and different scales make it difficult to draw any certain conclusions. The not yet fully understood biological interplay between metabolites, endogenous hormones, and genes (other than CYP2D6) involved in tamoxifen metabolism and the target receptors might influence therapeutic effect. A recent study reported an association between afimoxifene (4-OH-Tam), but not endoxifen, concentrations and prognosis of breast cancer.31 Models including measures of metabolites and genetic and clinical variables have been suggested to enable personalized tamoxifen dosing to achieve the highest possible therapeutic effect and to minimize side effects.10 We have previously described that a lower tamoxifen dose comes with lower levels of side effects.18,32 However, additional studies are needed before implementing in clinical practice.
We observed a decrease in mammographic breast density following tamoxifen treatment in the premenopausal, but not the postmenopausal, women. We measured relative decrease and did not include women with low mammographic breast density (inclusion criteria was a mammographic breast density above BI-RADS A, corresponding to a volume density >4.5%), therefore menopausal differences in absolute mammographic breast density should not substantially affect the outcome. It might be so that exposure time of 6 months is too short to observe density change in the postmenopausal breast. Using a nested biopsy cohort within the trial, we have shown that breast tissue from premenopausal women is more responsive to tamoxifen compared with the postmenopausal breast tissue.33 In contrast to postmenopausal women, premenopausal women treated with tamoxifen exhibited decrease in glandular-epithelial content, proliferation rate, and estrogen receptor and progesterone receptor expression. We also saw that proliferation of the glandular-epithelial tissue and stromal expression of progesterone receptor prior to tamoxifen treatment predicted the tamoxifen-induced mammographic breast density decrease.34 These features are associated with premenopausal and younger women.35 Lastly, it is possible that tamoxifen induces changes in the breast tissue that are not translated to mammographic breast density change in certain women. Future clinical studies should further explore these hypotheses.
In addition to the age-dependent inconsistency seen in mammographic breast density change, postmenopausal women demonstrated a statistically nonsignificant higher median concentration of endoxifen compared with premenopausal women. Previous studies have demonstrated a significant increase of serum concentrations of tamoxifen and its metabolites with age.36,37 A gradually declining creatinine clearance by age has been suggested as an explanation. An alternative hypothesis is that the lower estradiol levels following menopause induces a significant upregulation of metabolizing enzymes independent of chronological aging.38
In summary, the findings of age-dependent variances in metabolites as well as in other biological markers suggest that further research of therapeutic monitoring and individual dosing is warranted.
Our study has several strengths and weaknesses. Strengths include the randomized study design thereby minimizing the effect of chance findings and the inclusion of 5 doses of tamoxifen, which result in a wide range of endoxifen concentrations measured in a large number of women. Other strengths are collection of mammograms and measures of mammographic breast density change over time and the inclusion of well-characterized healthy women with complete follow-up. However, including healthy women from a screening program as well as low participation rate could influence the external validity of our findings. Possible measurement errors of mammographic breast density and metabolite concentrations would be nondifferential and, if anything, dilute our findings. The major weakness of our study is the use of mammographic breast density change as a proxy variable for tamoxifen therapy response. Even though several studies identify mammographic breast density change to be associated with a favorable outcome for therapy response,19,20 the interindividual variance of mammographic breast density and the difficulty in comparing mammograms from the same woman over time implies that our data should be interpreted with caution.
We have herein identified a window of effect on mammographic breast density in premenopausal women, in endoxifen concentrations of 2-3 ng/mL, and a threshold that corresponds to the decrease seen for women on 20 mg of tamoxifen. Higher concentrations did not further decrease mammographic breast density. Our data also support a lowering of tamoxifen dose, but it should be underlined that we used mammographic breast density change as our primary outcome and not incidence or recurrence of breast cancer. Studies with incidence and recurrence as outcomes are therefore warranted.
If our findings are validated by independent groups, the results may contribute to change in clinical practice. Monitoring tamoxifen therapy, either using endoxifen concentrations, CYP2D6 polymorphism, mammographic breast density change, or any combination of the 3, could lead to personalized dosing of tamoxifen, abandoning the one-size-fits-all concept of the established 20 mg dose of tamoxifen.
Acknowledgments
We thank the study participants and study personnel for their devoted support of the study.
Author contributions
Mattias Hammarström, MSc (Conceptualization; Data curation; Formal analysis; Project administration; Writing—original draft; Writing—review & editing), Marike Gabrielson, PhD (Conceptualization; Supervision; Writing—original draft; Writing—review & editing), Jenny Bergqvist, PhD (Conceptualization; Writing—original draft; Writing—review & editing), Cecilia Lundholm, PhD (Formal analysis; Visualization; Writing—original draft; Writing—review & editing), Alessio Crippa, PhD (Conceptualization; Data curation; Writing—original draft; Writing—review & editing), Magnus Bäcklund, PhD (Conceptualization; Data curation; Investigation; Writing—original draft; Writing—review & editing), Yvonne Wengström, PhD (Conceptualization; Writing—original draft; Writing—review & editing), Signe Borgquist, PhD (Investigation; Writing—original draft; Writing—review & editing), Erik Eliasson, PhD (Conceptualization; Data curation; Methodology; Writing—original draft; Writing—review & editing), Mikael Eriksson, PhD (Conceptualization; Data curation; Writing—original draft; Writing—review & editing), José Tapia, MSc (Data curation; Writing—original draft; Writing—review & editing), Kamila Czene, PhD (Conceptualization; Supervision; Writing—original draft; Writing—review & editing), and Per Hall, PhD (Conceptualization; Data curation; Funding acquisition; Supervision; Writing—original draft; Writing—review & editing).
Supplementary material
Supplementary material is available at JNCI: Journal of the National Cancer Institute online.
Funding
This work was supported by the Kamprad Foundation (20150052) and the Swedish Research Council (E0718301). The funder of the study had no role in study design, data collection, data analysis, data interpretation, writing of the manuscript, or the decision to submit the manuscript for publication.
Conflicts of interest
The authors have no conflicts of interest to report.
Data availability
The data underlying this article are available in the KARMA Research Platform at Karolinska Institutet, Sweden (karmastudy.org) and can be accessed on request by contacting the corresponding author.

