


Abstract
Inequities in guideline-concordant treatment receipt contribute to worse survival in Black patients with breast cancer. Inequity-reduction interventions (eg, navigation, bias training, tracking dashboards) can close such treatment gaps. We simulated the population-level impact of statewide implementation of inequity-reduction interventions on racial breast cancer inequities in North Carolina.
Using registry-linked multipayer claims data, we calculated inequities between Black and White patients receiving endocrine therapy (n = 12 033) and chemotherapy (n = 1819). We then built cohort-stratified (endocrine therapy and chemotherapy) and race-stratified Markov models to simulate the potential increase in the proportion of patients receiving endocrine therapy or chemotherapy and subsequent improvements in breast cancer outcomes if inequity-reducing intervention were implemented statewide. We report uncertainty bounds representing 95% of simulation results.
In total, 75.6% and 72.1% of Black patients received endocrine therapy and chemotherapy, respectively, over the 2006-2015 and 2004-2015 periods (vs 79.3% and 78.9% of White patients, respectively). Inequity-reduction interventions could increase endocrine therapy and chemotherapy receipt among Black patients to 89.9% (85.3%, 94.6%) and 85.7% (80.7%, 90.9%). Such interventions could also decrease 5-year and 10-year breast cancer mortality gaps from 3.4 to 3.2 (3.0, 3.3) and from 6.7 to 6.1 (5.9, 6.4) percentage points in the endocrine therapy cohorts and from 8.6 to 8.1 (7.7, 8.4) and from 8.2 to 7.8 (7.3, 8.1) percentage points in the chemotherapy cohorts.
Inequity-focused interventions could improve cancer outcomes for Black patients, but they would not fully close the racial breast cancer mortality gap. Addressing other inequities along the cancer continuum (eg, screening, pre- and postdiagnosis risk factors) is required to achieve full equity in breast cancer outcomes.
Breast cancer survival has increased substantially over the past few decades (1). Stark racial inequities persist (1), however, with 5- and 10-year survival among Black patients being approximately 10% and 15% lower, respectively, than among their White counterparts (2,3). Although the root causes behind these disparities are multifactorial (4) [eg, more aggressive tumor biology (4-7), lower screening rates (8), and later-stage diagnosis (9,10)], inequities in the receipt of guideline-concordant treatment are understood to be a major contributor to worse outcomes in Black patients (11).
Numerous studies have shown racial inequities across different breast cancer treatment modalities. Black women are at increased risk of experiencing delays in breast cancer surgery (12,13). Uptake of surgical innovations (eg, sentinel lymph node biopsy) is also lower among Black patients (14,15). Furthermore, Black patients with breast cancer are less likely to receive radiation therapy (16-19). Black women also experience delays in chemotherapy initiation (20) and are more likely to terminate chemotherapy early (21). Moreover, racial inequities in targeted therapy receipt have been described, with Black women with HER2-positive disease being less likely to start trastuzumab treatment and more likely to receive this targeted therapy in combination with nonstandard chemotherapy (22-24). Black patients are also less likely to initiate (25) or to be adherent (26,27) to endocrine therapy.
Previous studies have shown that inequity-reduction interventions targeting racial disparities in cancer treatment can achieve treatment equity in breast cancer (28-30) and other cancers (28,31-33) while improving overall treatment quality among all patients. These interventions are heterogeneous in nature, but many rely on patient navigation by nurses or social workers (28,29,31), either in isolation or in combination with additional interventions. For example, the Accountability for Cancer Care through Undoing Racism and Equity (ACCURE) intervention included patient navigation, a real-time registry providing alerts for missed appointments, antiracism training, and feedback to clinical teams on treatment completion by race (28). ACCURE increased guideline-concordant care among Black patients and eliminated inequities in treatment completion for patients with stage I and II breast and lung cancers (28). Specifically, preintervention treatment completion inequities (87.3% and 79.8% in White and Black patients, respectively; P < .001) disappeared after the introduction of ACCURE (89.5% vs 88.4%, respectively; P = .77) (28). Similarly, using a tracking and feedback registry for missed appointments, Bickell and colleagues reduced the proportion of patients with stage I and II breast cancer not receiving appropriate adjuvant therapy from 34% to 14% among Black patients and from 17% to 14% among White patients (30). The overall objective of these interventions is to address factors contributing to worse cancer treatment among minoritized groups, including lower access to health care (9), clinician bias and subsequent mistrust (34-38), and unmet social needs (39).
Although the potential of these interventions to reduce breast cancer treatment inequities has been demonstrated in small-scale interventional trials (28-30), no prior research has assessed the extent to which widespread adoption of inequity-reduction interventions would affect population-level outcomes. To address this gap, we used simulation modeling to quantify the impact that statewide implementation of inequity-reduction interventions could have on real-world treatment and mortality disparities between Black and White patients with breast cancer, generating insights to inform strategies aiming to reduce and ultimately eradicate racial inequities in breast cancer outcomes.
Methods
Data
We used data from North Carolina’s Cancer Information and Population Health Resource (CIPHR). CIPHR links Medicare, Medicaid, and commercial insurance claims data to the North Carolina Central Cancer Registry (40). Using CIPHR, we estimated racial inequities (based on self-reported race) in 2 breast cancer treatment quality metrics endorsed by the National Comprehensive Cancer Network and the American Society of Clinical Oncology. These metrics included receipt of chemotherapy within 4 months of diagnosis for patients younger than 70 years of age with hormone receptor–negative stage Ib to III breast cancer (41) (n = 1819; diagnosed between 2004 and 2015) and receipt of endocrine therapy within 12 months of diagnosis for stage I to III hormone receptor–positive breast cancer (n = 12 033; diagnosed between 2006 and 2015) (41). We excluded patients who did not receive surgery. Details on the cohort construction approach can be found in Supplementary Table 1 (available online). We focused on endocrine therapy and chemotherapy because, in a previous study on endocrine therapy, chemotherapy, and radiation therapy inequities in North Carolina, we found that the greatest inequities were in endocrine therapy and chemotherapy (42).
The University of North Carolina at Chapel Hill Institutional Review Board (IRB) determined that this study was secondary data use and so was exempt from individual informed consent, posing minimum to no risk.
Model structure
We used a Markov model structure (43). We obtained effectiveness estimates from ACCURE (28) and the intervention developed by Bickell and colleagues (30). ACCURE included navigation, antibias training, and real-time treatment tracking (28), while Bickell used a tracking and feedback registry (30). Bickell achieved a 22% increase in endocrine therapy use and a 27% increase in chemotherapy receipt among Black patients. Across different types of adjuvant therapy, there was a 24% increase in uptake, with marginal increases observed among White patients (30). Compared with the preintervention period, ACCURE resulted in an 11% increase in completion of adjuvant treatment among Black patients after intervention (28), although the authors did not provide a breakdown of the intervention effect on uptake of different types of adjuvant therapy.
Considering the differences in effect sizes and reporting granularity across the 2 interventions, we used a conservative estimate that statewide implementation of inequity-reduction interventions could increase adjuvant therapy uptake (endocrine therapy or chemotherapy) between 11% and 27% among Black patients with breast cancer and between 3% and 12% among White patients (see Supplementary Table 2, available online).
We modeled the effect of increased endocrine therapy and chemotherapy receipt independently by creating 2 separate cohorts (1 for endocrine therapy and 1 for chemotherapy) and simulating the impact of increased treatment uptake on breast cancer mortality and overall survival separately in each cohort (n = 12 033 and n = 1819 for the endocrine therapy and chemotherapy cohorts, respectively).
The basic structure of the model is displayed in Figure 1. In any given year, patients could remain alive or die from breast cancer or non–breast cancer causes. These probabilities were modeled separately for Black and White patients. The effect of receipt of adjuvant therapy (endocrine therapy or chemotherapy) was modeled as a proportional change in yearly probabilities of breast cancer and non–breast cancer deaths, with the proportional effect being equal across races. Modeled interventions affected the proportion of patients who received guideline-recommended therapy (endocrine therapy or chemotherapy), with a greater impact on Black patients.
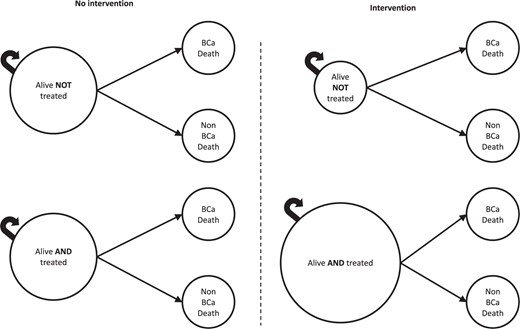
Basic structure of the Markov model. In any given year, patients can remain alive, die from breast cancer, or die from a non–breast cancer cause. In the model, receipt of treatment—endocrine therapy or chemotherapy—affects race-specific probabilities of breast cancer and non–breast cancer death. In the right panel, the “Alive AND treated” circle is larger, and the “Alive NOT treated” circle is smaller, representing the intervention effect (ie, the increase in the proportion of patients who start the model in the treated vs untreated state). We used trial-derived, race-stratified effect estimates to reflect the differential impact of inequity-reducing interventions on adjuvant therapy uptake across racial subgroups.
Time horizon
We calculated the effect of disparity-reduction interventions over 2 time horizons: 5 years and 10 years. For the 5-year models, we used the entire cohorts described earlier. For the 10-year cohorts (endocrine therapy, n = 4941; chemotherapy, n = 963), we excluded patients diagnosed after 2010 because the most recent year for which survival data are available in the North Carolina Central Cancer Registry is 2020.
Modeling the effect of adjuvant therapy receipt
We used meta-analytic estimates of the impact of endocrine therapy (vs no endocrine therapy) and chemotherapy (vs no chemotherapy) on breast cancer and any death. For endocrine therapy, we defined the impact of treatment receipt as the effect of taking tamoxifen for 5 years vs not taking endocrine therapy (44). For chemotherapy, we estimated the impact of receiving 4 or more cycles of any anthracycline-based regime (eg, 4 cycles of anthracycline and cyclophosphamide [4AC]) vs no chemotherapy (45). Newer taxane-containing regimens and next-generation endocrine therapies have marginal benefits over anthracycline-only chemotherapy and tamoxifen, respectively. We modeled older treatments in the base case, however, for 2 reasons: 1) because of the availability of a large evidence base of long-term outcome data and 2) because our cohorts included patients receiving treatment as early as 2004. We abstracted separate estimates for treatment effects in years 1 through 5 vs years 6 through 10 after diagnosis. We modeled the effects of endocrine therapy or chemotherapy as risk ratios.
Modeling the effect of inequity-reducing interventions
The effect of inequity-reducing interventions was modeled as a proportional change in the percentage of individuals receiving treatment. We assumed that the proportional effect of interventions on endocrine therapy and chemotherapy receipt would be the same. Based on available studies (28,30), we also assumed that, although the interventions would mainly benefit Black patients with breast cancer, they would also lead to small increases in adjuvant therapy receipt in White individuals (Supplementary Table 2, available online).
Outcomes
Our main outcomes of interest were race-specific and cohort-specific (endocrine therapy vs chemotherapy) probabilities of breast cancer death at 5 years (for the 5-year cohorts) and at 10 years after diagnosis (for the 10-year cohorts). Although assessing the impact on overall survival is important, inequities in non–breast cancer deaths would not be directly affected by improvements in endocrine therapy and chemotherapy receipt. Therefore, we report only on race-specific and cohort-specific 5-year and 10-year overall survival in Supplementary Tables 3 through 5 (available online).
Alternative scenarios
In an “optimal uptake” scenario, we estimated the optimal theoretically achievable race-specific and cohort-specific breast cancer mortality and overall survival if endocrine therapy and chemotherapy receipt were 100% among patients in our cohorts (ie, assuming that no patients had contraindications for adjuvant therapy). Then, we ran a second scenario analysis in which we assumed that patients would receive newer, more effective treatments. Specifically, in the endocrine therapy cohort, patients older than 51 years of age were assumed to be postmenopausal (46) and receive aromatase inhibitors instead of tamoxifen (47); in the chemotherapy cohort, all patients were assumed to be treated with a taxane plus anthracycline (45). In this second scenario, we did not assume 100% endocrine therapy and chemotherapy receipt. Rather, we assumed that treatment receipt levels would be the same as in base case.
Uncertainty analysis
Across scenarios, we conducted probabilistic uncertainty analyses by varying each parameter across 1000 simulations drawn from parameter-specific probabilistic distributions (48) (see Supplementary Table 2, available online). We report mean values across simulations and uncertainty bounds representing 95% of simulation results. We programmed our model in Microsoft Excel (Microsoft Corp, Redman, WA) and used Crystal Ball (Oracle Corp, Redwood Shores, CA) to complete the probabilistic uncertainty analyses. RStudio (Posit Software, Boston, MA) on R, version 4.3.1 (R Foundation for Statistical Computing, Vienna, Austria) was used to generate figures.
Results
Base case scenario: improvements in endocrine therapy and chemotherapy receipt
In the 5-year cohorts, inequity-reduction interventions could increase endocrine therapy and chemotherapy receipt among Black patients from 75.6% to 89.9% (85.3%, 94.6%) and from 72.1% to 85.7%. (80.7%, 90.9%), respectively. In the 10-year cohorts, endocrine therapy and chemotherapy could improve from 75.0% to 89.2% (84.9%, 93.6%) and from 68.0% to 80.7% (95% CB: 75.9%, 85.8%), respectively. These interventions would also lead to small rises in endocrine therapy and chemotherapy receipt among White patients (Table 1).
Impact of statewide implementation of inequity-reduction interventions—base case scenarioa
| 5-y cohorts | ||||
|---|---|---|---|---|
| Endocrine therapy cohort | Chemotherapy cohort | |||
| No intervention | With intervention | No intervention | With intervention | |
| Percentage of Black patients receiving recommended treatment | 75.6 | 89.9 (85.3, 94.6) | 72.1 | 85.7 (80.7, 90.9) |
| Percentage of White patients receiving recommended treatment | 79.3 | 85.2 (82.6, 87.9) | 78.9 | 84.7 (81.5, 88.0) |
| Treatment gap (White/Black), percentage pointsb | 3.7 | ‒4.8 (‒10.0, 0.8) | 6.8 | ‒1.1 (‒7.1, 5.0) |
| 5-y breast cancer mortality among Black patients, % | 6.9 | 6.5 (6.4, 6.7) | 25.2 | 24.4 (24.0, 24.8) |
| 5-y breast cancer mortality among White patients, % | 3.5 | 3.4 (3.3, 3.4) | 16.6 | 16.4 (16.2, 16.5) |
| 5-y breast cancer mortality gap (Black/White), percentage points | 3.4 | 3.2 (3.0, 3.3) | 8.6 | 8.1 (7.7, 8.4) |
| 10-y cohorts | ||||
|---|---|---|---|---|
| Endocrine therapy cohort | Chemotherapy cohort | |||
| No intervention | With intervention | No intervention | With intervention | |
| Percentage of Black patients receiving recommended treatment | 75.0 | 89.2 (84.9, 93.6) | 68.0 | 80.7 (75.9, 85.8) |
| Percentage of White patients receiving recommended treatment | 76.8 | 82.6 (80.0, 85.1) | 76.7 | 82.4 (79.4, 85.5) |
| Treatment gap (White/Black), percentage pointsb | 1.8 | ‒6.7 (‒11.8, ‒1.3) | 8.7 | 1.7 (‒4.8, 7.6) |
| 10-y breast cancer mortality among Black patients, % | 14.5 | 13.8 (13.5, 14.0) | 29.7 | 29.0 (28.5, 29.4) |
| 10-y breast cancer mortality among White patients, % | 7.8 | 7.7 (7.6, 7.7) | 21.5 | 21.3 (21.1, 21.4) |
| 10-y breast cancer mortality gap (Black/White), percentage points | 6.7 | 6.1 (5.9, 6.4) | 8.2 | 7.8 (7.3, 8.1) |
Results presented in the “No intervention” columns represent outcomes in the absence of intervention, while results in the “With intervention” columns represent simulation results in a scenario in which inequity-reducing interventions were implemented across the state. Results are presented separately for the 5-year and 10-year endocrine therapy and chemotherapy cohorts. Uncertainty bounds represent 95% of simulation results.
Negative gaps indicate higher uptake among Black patients.
As a result of intervention-driven improvements in treatment receipt, the 5-year and 10-year breast cancer mortality gaps would decrease from 3.4 to 3.2 (3.0, 3.3) and from 6.7 to 6.1 (5.9, 6.4) percentage points in the endocrine therapy cohorts. In the chemotherapy cohorts, breast cancer mortality disparities at 5 and 10 years would decrease from 8.6 to 8.1 (7.7, 8.4) and from 8.2 to 7.8 (7.3, 8.1) percentage points, respectively (Table 1).
Scenario analysis 1: optimal uptake
Optimal adjuvant therapy uptake would lead to a decrease in 5-year and 10-year breast cancer mortality in both racial groups and cohorts. It would also reduce the racial gaps in 5-year and 10-year breast cancer mortality from 3.4 to 3.1 (3.0, 3.1) and from 6.7 to 6.1 (6.0, 6.2) percentage points in the endocrine therapy cohorts. In the chemotherapy cohorts, optimal uptake could reduce the mortality gaps from 8.6 to 7.9 (7.6, 8.1) percentage points at 5 years and from 8.2 to 7.4 (95% CB: 7.1, 7.7) at 10 years (Table 2).
Impact of optimal uptake on breast cancer outcomesa
| 5-y cohorts | ||||
|---|---|---|---|---|
| Endocrine therapy cohort | Chemotherapy cohort | |||
| No intervention | Optimal uptake | No intervention | Optimal uptake | |
| 5-y breast cancer mortality among Black patients, % | 6.9 | 6.3 (6.1, 6.4) | 25.2 | 23.7 (23.1, 24.3) |
| 5-y breast cancer mortality among White patients, % | 3.5 | 3.2 (3.1, 3.3) | 16.6 | 15.8 (15.5, 16.1) |
| 5-y breast cancer mortality gap (Black/White), percentage points | 3.4 | 3.1 (3.0, 3.1) | 8.6 | 7.9 (7.6, 8.1) |
| 10-y cohorts | ||||
|---|---|---|---|---|
| Endocrine therapy cohort | Chemotherapy cohort | |||
| No intervention | Optimal uptake | No intervention | Optimal uptake | |
| 10-y breast cancer mortality among Black patients, % | 14.5 | 13.3 (13.1, 13.5) | 29.7 | 27.9 (27.3, 28.6) |
| 10-y breast cancer mortality among White patients, % | 7.8 | 7.2 (7.1, 7.3) | 21.5 | 20.5 (20.2, 20.9) |
| 10-y breast cancer mortality gap (Black/White), percentage points | 6.7 | 6.1 (6.0, 6.2) | 8.2 | 7.4 (7.1, 7.7) |
Results presented in the “No intervention” columns represent outcomes in the absence of intervention, while results in the “Optimal uptake” columns represent simulation results in a scenario in which 100% of eligible patients received adjuvant therapy. Results are presented separately for the 5-year and 10-year endocrine therapy and chemotherapy cohorts. Uncertainty bounds represent 95% of simulation results.
Scenario analysis 2: incorporation of newer therapies
In this scenario, intervention-induced increases in endocrine therapy and chemotherapy uptake were assumed to be the same as in the base case scenario. Because of the stronger treatment effects, however, improvements in breast cancer mortality would be greater.
The racial gaps in 5-year and 10-year breast cancer mortality could be reduced to 3.0 (2.8, 3.2) and 6.0 (5.6, 6.3) percentage points in the endocrine therapy cohorts (compared with 3.2 and 6.1 in the base case, respectively). In the chemotherapy cohorts, disparities in 5-year and 10-year breast cancer mortality would be reduced to 7.8 (7.2, 8.3) and 7.4 (6.8, 8.0) percentage points (vs 8.1 and 7.8 in the base case scenario) (Table 3).
Impact of statewide implementation of inequity-reduction interventions—newer therapies scenarioa
| 5-y cohorts | ||||||
|---|---|---|---|---|---|---|
| Endocrine therapy cohort | Chemotherapy cohort | |||||
| No intervention | Intervention, base case | Intervention, newer therapies | No intervention | Intervention, base case | Intervention, newer therapies | |
| 5-y breast cancer mortality among Black patients, % | 6.9 | 6.5 (6.4, 6.7) | 6.4 (6.1, 6.6) | 25.2 | 24.4 (24.0, 24.8) | 24.0 (23.4, 24.6) |
| 5-y breast cancer mortality among White patients, % | 3.5 | 3.4 (3.3, 3.4) | 3.3 (3.3, 3.4) | 16.6 | 16.4 (16.2, 16.5) | 16.2 (16.0, 16.4) |
| 5-y breast cancer mortality gap (Black/White), percentage points | 3.4 | 3.2 (3.0, 3.3) | 3.0 (2.8, 3.2) | 8.6 | 8.1 (7.7, 8.4) | 7.8 (7.2, 8.3) |
| 10-y cohorts | ||||||
|---|---|---|---|---|---|---|
| Endocrine therapy cohort | Chemotherapy cohort | |||||
| No intervention | Intervention, base case | Intervention, newer therapies | No intervention | Intervention, base case | Intervention, newer therapies | |
| 10-y breast cancer mortality among Black patients, % | 14.5 | 13.8 (13.5, 14.0) | 13.6 (13.2, 13.9) | 29.7 | 29.0 (28.5, 29.4) | 28.5 (27.9, 29.1) |
| 10-y breast cancer mortality among White patients, % | 7.8 | 7.7 (7.6, 7.7) | 7.6 (7.5, 7.7) | 21.5 | 21.3 (21.1, 21.4) | 21.1 (20.8, 21.3) |
| 10-y breast cancer mortality gap (Black/White), percentage points | 6.7 | 6.1 (5.9, 6.4) | 6.0 (5.6, 6.3) | 8.2 | 7.8 (7.3, 8.1) | 7.4 (6.8, 8.0) |
Results presented in the “No intervention” columns represent outcomes in the absence of intervention, while results in the “Intervention” columns represent simulation results in the base case and newer therapies scenarios. Results are presented separately for the 5-year and 10-year endocrine therapy and chemotherapy cohorts. Uncertainty bounds represent 95% of simulation results.
Comparison of results across scenarios
In Figure 2, we present simulation results comparing 10-year breast cancer mortality across racial groups in each scenario.
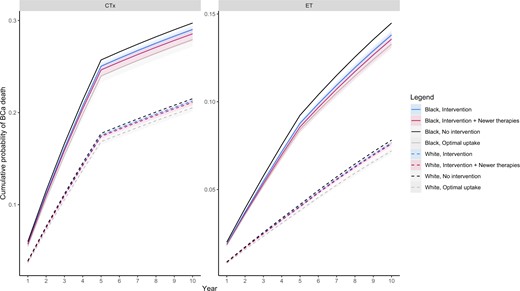
Breast cancer mortality over a 10-year period across different scenarios. Solid and dashed lines represent mean cumulative probability of breast cancer death for Black and White patients under different scenarios, respectively. Shaded areas depict uncertainty bounds representing 95% of simulation results.
Discussion
Using robust simulation methods informed by real-world and clinical trial data, we showed that widespread implementation of inequity-reducing interventions targeting endocrine therapy and chemotherapy would improve treatment receipt and mortality outcomes in Black patients with breast cancer (28,30). Such interventions—including navigation support, tracking tools, antibias training, and real-time alerts—could eliminate treatment inequities entirely (in fact, in our models, we assumed that they could even lead to higher treatment receipt in Black vs White patients). These interventions alone, however, would not be sufficient to close the racial gap in breast cancer mortality and overall survival because adjuvant therapy receipt is only 1 important component of breast cancer treatment trajectories and outcomes.
Other potentially modifiable [eg, stage (49), symptom burden (50,51), comorbidities (9,52), frailty (53)] and nonmodifiable [eg, HER2 status (4), tumor aggressiveness (4-7,54), age (9)] clinical factors that affect breast cancer survival are known to be differentially distributed by race. In the case of endocrine therapy and chemotherapy, evidence suggests that the proportional (ie, relative) risk reductions in breast cancer and non–breast cancer mortality are unlikely to be affected by a range of clinical factors, including age, nodal status, tumor size, and differentiation (44,45,47). Yet, even if proportional benefits are the same, absolute benefits are dependent on the underlying risks of breast cancer and non–breast cancer death, which are disproportionally higher in Black patients. Indeed, in our cohorts, Black patients were more likely to display clinical characteristics associated with worse breast cancer outcomes (later stage at diagnosis in the endocrine therapy cohort and HER2 negativity in the chemotherapy cohort) (Supplementary Tables 6 and 7, available online), helping partly explain residual mortality disparities after eliminating inequities in adjuvant therapy receipt. Furthermore, higher non–breast cancer mortality among Black women contributes to reducing the extent to which they can benefit from improvements in treatment receipt (55).
In addition to clinical factors, social determinants, including poverty (53), uninsurance (53), lack of access to employment that offers paid sick leave (56), clinician bias (38), experiences of discrimination (57), and subsequent mistrust (38), are also differentially distributed by race, resulting from structural racism (58-61), and have broad impacts on access to and persistence with cancer care across the continuum. Data show that Black patients are more likely to experience treatment delays (12,13,62), to receive care at safety-net hospitals with lower quality of care (63,64), not to receive appropriate targeted therapies (22-24), and to experience toxicities of treatment that are not appropriately managed (65). All these factors can reduce access to timely, high-quality care and could contribute to the persistent racial gaps in survival expected after the elimination of disparities in adjuvant therapy receipt. A sensitivity analysis limited to Medicaid-insured patients is presented in Supplementary Table 8 (available online). For both racial groups, baseline levels of adjuvant therapy receipt as well as breast cancer mortality were quantitatively worse among Medicaid-insured individuals than in the full cohort [a finding consistent with the literature on the barriers to cancer care experienced by socially vulnerable Medicaid patients (66)]. Although findings were limited by small sample sizes and the overrepresentation of Black patients, racial gaps in treatment receipt appeared smaller (or even absent) in the Medicaid cohorts in contrast to the full cohorts. Racial differences in breast cancer mortality also seemed narrower. The intervention-induced decreases in racial breast cancer mortality disparities, however, were similar in absolute terms to those observed in the full cohorts and, again, failed to completely eliminate the racial mortality gap.
Complex social determinants of cancer outcomes in diverse patient populations must be intervened upon at multiple levels. It is necessary to extend far beyond the patient-level and health system–level barriers addressed by the interventions modeled in this study and include social, political, and economic systems (67-70). Recent innovations to provide guaranteed income and housing (70), for example, hold promise for reversing socioeconomic barriers to care and improving whole-person health. In addition, cancer-focused interventions, such as virtual tumor boards, remote counseling for survivors, and virtual navigation support, are needed to support patients with cancer and cancer survivors where they live (71,72). Furthermore, in the era of precision medicine, continuing to pinpoint drivers of biological heterogeneity will be essential for achieving better health outcomes for all (68).
This study is not without limitations. First, in our base case scenario, we used treatment effectiveness estimates comparing tamoxifen vs no endocrine therapy and 4AC vs no chemotherapy. Although these treatment regimens remain relevant in current clinical practice, many patients receive newer, more effective endocrine therapy and chemotherapy regimens, suggesting that our estimates are conservative. In our scenario analysis, we show that although more novel treatments could further decrease breast cancer mortality, increased uptake of these therapies would still fail to close the racial gap. Second, in our endocrine therapy cohort, we did not model adherence directly, which matters because adherence has been shown to be a greater challenge in Black patients (65,73). Nevertheless, our estimates of the effectiveness of endocrine therapy are based on meta-analyses of trials in which adherence was not perfect (44,47). Furthermore, we assumed that if individuals did not receive endocrine therapy within 12 months, they remained endocrine therapy naive until death—another conservative assumption. Finally, our study only examined the direct influence of inequity-reducing interventions targeting treatment receipt. Van Ravesteyn and colleagues’ (74) seminal study found that only 11% to 19% of the gap in breast cancer mortality between Black and White patients could be attributable to inequities in adjuvant therapy receipt (a finding that resembles our results in magnitude). In their study, natural history and uptake of screening represented 26% to 44% and 7% to 8% of the gap, respectively, leaving 38% to 46% of the observed mortality disparity unexplained. Considering this, our findings cannot reflect the potential effect of other interventions at the patient, health system, and policy levels that could be combined to eliminate breast cancer mortality inequities.
In conclusion, implementation of inequity-reducing interventions is likely to improve outcomes in Black patients with breast cancer. Yet, improvements in treatment receipt alone will not be enough to fully close the racial gap in breast cancer mortality. Policy action is needed to deliver interventions that can target the many complex contributors to inequitable cancer care and outcomes. Our team is conducting community-engaged work across the state to share and interpret these findings.
Data availability
The data underlying this article were provided by the North Carolina Central Cancer Registry, the Centers for Medicaid & Medicaid Services, and commercial payers under license and by permission (and therefore cannot be shared).
Author contributions
Juan Yanguela, MSc (Conceptualization; Data curation; Formal analysis; Investigation; Methodology; Validation; Visualization; Writing—original draft; Writing—review & editing), Bradford E. Jackson, PhD (Data curation; Formal analysis; Methodology; Validation), Katherine E. Reeder-Hayes, MD, MBA, MSCR (Conceptualization; Funding acquisition; Methodology; Writing—original draft; Writing—review & editing), Mya L. Roberson, PhD (Methodology; Writing—original draft), Gabrielle B. Rocque, MD (Conceptualization; Writing—original draft), Tzy-Mey Kuo, PhD (Conceptualization; Data curation; Methodology), LeBlanc R. Matthew, PhD, RN (Conceptualization; Methodology; Writing—original draft), Christopher Baggett, PhD (Conceptualization; Methodology; Resources), Laura Greene, MBA (Project administration; Resources), Erin Laurie-Zehr, MA (Project administration), Stephanie B. Wheeler, PhD (Conceptualization; Funding acquisition; Methodology; Supervision; Writing—original draft; Writing—review & editing).
Funding
This work was supported by the American Cancer Society and the Pfizer Global Medical Foundation (no grant number assigned). This work was also supported by the Cancer Information and Population Health Resource at the UNC Lineberger Comprehensive Cancer Center, with funding provided by the University Cancer Research Fund via the state of North Carolina.
Conflicts of interest
Juan Yanguela, Bradford E. Jackson, Tzy-Mey Kuo, Matthew R. LeBlanc, Christopher Baggett, Laura Green, and Erin Laurie-Zehr have no conflicts of interest to report. Stephanie B. Wheeler receives grant funding paid to her institution by the Pfizer Medical Foundation and AstraZeneca. She does not receive direct payments. Katherine E. Reeder-Hayes receives grant funding paid to her institution by the Pfizer Medical Foundation, the American Society of Clinical Oncology, and the American Cancer Society. Mya L. Roberson is supported by the National Institutes of Health under grant No. NCI U01 CA254832-03S1 and the American Association for Cancer Research, in partnership with Victoria’s Secret and Pelotonia (22-20-73-ROBE). Mya L. Roberson reports consulting fees from Concert Genetics on topics outside the submitted work. Gabrielle B. Rocque reports research funding from Genentech, Pfizer, Daiichi, and Sankyo and consulting engagement with Gilead and Pfizer.
Acknowledgements
The funder did not play a role in the design of the study; the collection, analysis, and interpretation of the data; the writing of the manuscript; and the decision to submit the manuscript for publication.
The findings and conclusions in this manuscript are those of the authors and do not necessarily represent the view of the North Carolina Department of Health and Human Services, Division of Public Health. Preliminary findings from this analysis were presented at the American Society for Clinical Oncology 2023 annual meeting in Chicago, Illinois (June 2-6) and the American Society for Clinical Oncology 2023 Quality Care Symposium 2023 in Boston, Massachusetts (October 27-28).
Ethical approval: The University of North Carolina at Chapel Hill Institutional Review Board determined this study as secondary data use to be exempt from individual informed consent, posing minimum to no risk.

