


Abstract
Improved prognostication of oropharyngeal squamous cell carcinoma (OPSCC) may facilitate individualized patient management. The goal of this study was to develop and validate a prognostic signature based on microRNA sequencing (miRNA-seq) analysis.
We collected tumor specimens for miRNA-seq analysis from OPSCC patients treated at Washington University in St Louis (n = 324) and Vanderbilt University (n = 130). OPSCC patients (n = 79) from The Cancer Genome Atlas Program were also included for independent validation. Univariate and multivariable Cox regression analyses were performed to identify miRNAs associated with disease outcomes. All statistical tests were 2-sided.
By miRNA-seq profiling analysis, we identified a 26-miRNA signature. Based on computed risk scores of the signature, we classified the patients into low- and high-risk groups. In the training cohort, the high-risk group had much shorter overall survival compared with the low-risk group (hazard ratio [HR] = 3.80, 95% confidence interval [CI] = 2.37 to 6.10, P < .001). Subgroup analysis further revealed that the signature was prognostic for HPV-positive OPSCCs (HR = 3.07, 95% CI = 1.65 to 5.71, P < .001). Multivariable analysis indicated that the signature was independent of common clinicopathologic factors for OPSCCs. Importantly, the miRNA signature was a statistically significant predictor of overall survival in independent validation cohorts (The Cancer Genome Atlas Program cohort: HR = 6.05, 95% CI = 2.10 to 17.37, P < .001; Vanderbilt cohort: HR = 7.98, 95% CI = 3.99 to 15.97, P < .001; Vanderbilt HPV-positive cohort: HR = 8.71, 95% CI = 2.70 to 28.14, P < .001).
The miRNA signature is a robust and independent prognostic tool for risk stratification of OPSCCs including HPV-positive OPSCCs.
The overall incidence of head and neck squamous cell carcinoma has declined in the past 20 years, whereas that of oropharyngeal squamous cell carcinoma (OPSCC) has been increasing (1). Prognostic biomarkers could potentially be used to accurately predict survival and determine optimal treatment strategies for individual patients. Recent studies indicate that HPV-positive OPSCC has better prognosis than HPV-negative OPSCC (2). Other known prognostic factors in OPSCC include age, lifetime smoking-related tobacco exposure, and tumor and nodal classification (3). Despite the progress in this field, there is still a lack of robust biomarkers for prognosticating OPSCC patients. Thus, there is an urgent need to develop novel biomarkers that could be applied either as a standalone predictor or in combination with other known markers (eg, HPV status) for improved prognosis.
MicroRNAs (miRNAs) are small noncoding RNAs that are involved in posttranscriptional regulation of most protein-coding genes (4). The miRNAs are frequently deregulated in almost all types of cancers (5-7), and they can potentially be used as diagnostic or prognostic biomarkers (8). In OPSCC, aberrantly expressed miRNAs have been described (9), and miRNA signatures have emerged as promising biomarkers. For example, the expression of miR-200b and miR-155 was correlated with OPSCC patient survival (10); up-regulated miR-361, miR-324-5p, and miR-151 were associated with distant metastasis (11). Previous work from our group reported that a PCR-based 6-miRNA signature could predict the survival outcomes of OPSCC (12). However, these reported biomarker studies were limited by the small numbers of miRNAs and OPSCC case patients included in the analyses. To address this issue, we have performed comprehensive microRNA sequencing (miRNA-seq) profiling analysis for more than 400 OPSCC case patients collected independently from 2 institutions. We used the cohorts for development and validation of a miRNA expression signature, which provides prognostic stratification of OPSCC patients.
Methods
Patients Cohorts
Our study included 324 OPSCC case patients treated at Washington University in St Louis and 130 OPSCC cases treated at Vanderbilt University Medical Center. The characteristics of the study cohorts are summarized in Supplementary Table 1 (available online). All tumor tissues included in this study were derived from primary OPSCCs. All except 1 patient were treated with curative intent. Clinical data were collected prospectively from these patients and then updated retrospectively after follow-up review. The study was approved by the Human Research Protection Offices of the Washington University in St Louis and the Vanderbilt University Medical Center.
For each patient, a formalin-fixed, paraffin-embedded tumor specimen was collected for pathologic analysis. Tumor sections from each case were stained with hematoxylin and eosin and reviewed independently by study pathologists to confirm the diagnosis. Tumor regions were marked on representative hematoxylin and eosin-stained slides, followed by total RNA extraction of microdissected tumor regions using the miRNeasy formalin-fixed, paraffin-embedded kit (Qiagen).
From The Cancer Genome Atlas Program (TCGA) GDC Data Portal (https://gdc-portal.nci.nih.gov/), normalized miRNA-seq and associated clinical data for head and neck squamous cell carcinoma patients were downloaded. From this cohort, a total of 79 OPSCC patients were identified based on clinical annotations.
Small RNA-Seq Profiling and Raw Data Processing
Small RNA-seq libraries were constructed with the NEBNext Small RNA-Seq Library Preparation Kit (New England Biolabs) according to the manufacturer’s protocol. The resulting cDNA libraries were PCR amplified, cleaned with Agencourt AMPure XP beads (Beckman Coulter), and sequenced with Illumina HiSeq 3000 at Washington University. Raw sequencing reads were aligned to human miRNA sequences downloaded from miRBase using Blat (13,14). The read counts were normalized to reads per million miRNA reads mapped (RPM) and further log2 transformed. The miRNAs with average log2(RPM) less than 1 were excluded from further analysis.
Determination of the HPV Status
The HPV status of the OPSCC patients was determined either by reverse transcription followed by real-time PCR (n = 261) or by immunohistochemistry staining for p16 (IHC; n = 193) as we described in detail previously (15). The qPCR primer assays were specifically designed for E6 and E7 transcripts from various HPV types. Our previous work indicated that HPV reverse transcription followed by real-time PCR and p16 IHC were essentially equivalent at determining the HPV status of OPSCC patients (15).
Survival Analysis
Overall survival (OS) was defined as the time interval between the date of diagnosis and the date of death; recurrence-free survival (RFS) was defined as the time interval between the date of diagnosis and the date of first recurrence or death; metastasis-free survival (MFS) was defined as the time interval between the date of diagnosis and the date of first distant metastasis or death. All the survival outcomes were threshold at year 5 (ie, patients who had events after year 5 were treated as censored) because the emphasis here is to establish an early risk prognosticator.
Statistical Analysis
All statistical analyses were performed using R (version 3.5.1; https://www.r-project.org/). The survival package (version 2.44–1.1) in R was used to perform univariate and multivariable analyses to correlate miRNA expression and clinical features to OS. Kaplan-Meier survival curves were generated with the survminer package (version 0.4.5) in R. The miRNA candidates were selected by Cox regression analysis based on nominal P less than .05 without correcting for multiple hypothesis testing. The P values were calculated by a 2-sided Wald test.
Results
Identifying Prognostic miRNAs From the Training Cohort
Small RNA-seq profiling was performed for 324 OPSCC case patients treated at Washington University in St Louis. On average, 11.4 million total small RNA reads, including 0.9 million miRNA reads, were obtained per sample. From this sequencing dataset, 620 known miRNAs were identified and further studied for their prognostic value. The expression distribution of identified miRNAs is shown in Supplementary Figure 1 (available online). We also implemented an expression filter to exclude miRNAs with very low-level expression, because these miRNAs may lead to substantial noise, reducing their utility as robust biomarkers. Specifically, the average normalized read count across all samples was calculated for each miRNA. The miRNAs with relatively high average read counts (ranked among the top 400) were retained. The log2(RPM) values of these 400 miRNAs ranged from 2.9 to 17.8. Next, to identify miRNAs whose expression was correlated with OS, we performed univariate Cox regression analyses. In this way, 45 potential miRNA biomarkers were selected based on their Cox P values (P < .05). The independent prognostic values of these candidate miRNAs were evaluated further by multivariable Cox regression analysis controlling for treatment plans (chemotherapy and radiotherapy). As a result, 40 miRNAs retained their prognostic value (P < .05).
At present, miRNA annotations rely largely on high-throughput sequencing studies. As a result, many reported miRNAs are not likely to play active functional roles or might even not be bona fide miRNAs as a result of low-quality sequencing data (18). Inclusion of these spurious miRNAs could potentially reduce the robustness of the prognostic signature. To address this issue, we cross-checked candidate miRNA biomarkers with miRDB Functional miRNA Collection, which was curated by integrative analysis of high-quality heterogenous datasets from various sources, including PubMed literature, sequence conservation, expression profile, and existing miRNA annotations (16). In this way, 26 high-confidence functional miRNA biomarkers were retained for further signature development. Among these miRNAs, 15 and 11 were associated with favorable and unfavorable outcomes, respectively (Supplementary Table 2, available online). The inclusion of more favorable miRNAs than unfavorable ones likely reflects the fact that most patients in the training cohort are HPV positive with better OS.
An miRNA Signature to Predict Patient Survival
We developed an miRNA expression signature by combining weighted expression of the 26 miRNA biomarkers. With this signature, a risk score was calculated for each patient to predict prognosis. We then performed receiver operating characteristic curve analysis of the training cohort and identified an optimal risk score cutoff (−47.2) for patient stratification (Supplementary Figure 2, available online). With this approach, 63 patients were predicted to be of high risk (score > −47.2) and 261 to be of low risk (score < −47.2). Figure 1, A shows the distribution of the risk scores, ranging from −109.7 to 29.7. Interestingly, the 15 favorable and 11 unfavorable miRNAs were more expressed in patients with low- and high-risk scores, respectively (Figure 1, B). As expected, the risk scores were associated with patient outcomes, because deceased patients tended to have relatively high scores (Figure 1, C). Kaplan-Meier survival analysis on OS indicated that the 2 patient groups, as stratified by the risk score, exhibited markedly different risks for death (hazard ratio [HR] = 3.80, 95% confidence interval [CI] = 2.37 to 6.10, P < .001 with log-rank test; Figure 2, A). Similarly, the risk score was also prognostic of RFS (HR = 3.10, 95% CI = 1.98 to 4.85, P < .001) and MFS (HR = 3.54, 95% CI = 2.24 to 5.60, P < .001; Figure 2, B and C).
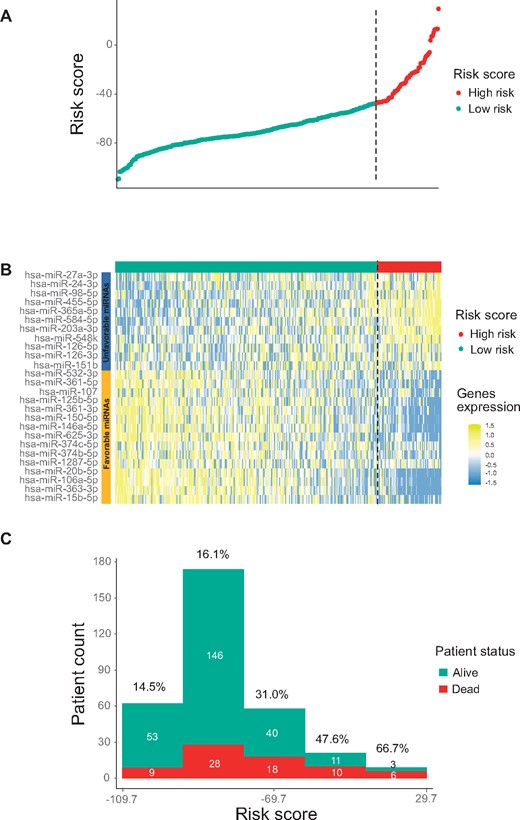
Developing a 26-microRNA (miRNA) signature with the training cohort. A) Summary of signature risk scores. For each patient, a risk score was calculated based on the signature, and the risk scores from all patients are displayed (sorted from low to high score). The vertical dotted line indicates the risk score cutoff dividing patients into low-risk and high-risk groups. B) Expression profiles of the 26 miRNAs in the training cohort. C) Distribution of the risk scores stratified by patient survival status.
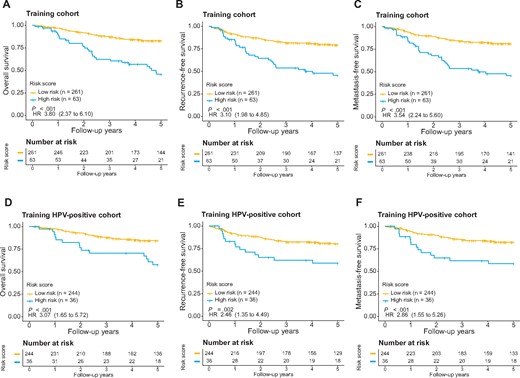
Evaluation of the microRNA signature for overall survival (OS) (A), recurrence-free survival (RFS) (B), and metastasis-free survival (MFS) (C) in the training cohort as well as OS (D), RFS (E), and MFS (F) for human papillomavirus (HPV)-positive oropharyngeal squamous cell carcinoma patients in the training cohort. The patients were stratified into either the high- or low-risk group based on signature risk score. Kaplan-Meier survival curves and log-rank P values are presented. Hazard ratios (HRs) are shown with 95% confidence intervals within parentheses. All statistical tests were 2-sided.
The miRNA Signature Was Independent of Clinicopathologic Features and HPV Status
We further assessed whether the miRNA signature is independent from commonly used clinicopathologic parameters, including age, sex, race, smoking history, TNM staging, radiotherapy status, chemotherapy status, and surgery status. In the training cohort, the 26-miRNA signature was prognostic of OS when evaluated in univariate Cox analysis (P < .001; Table 1). Multivariable Cox analysis further exhibited that the miRNA signature retained its independent prognostic value after adjusting for clinicopathologic features (HR = 3.10, 95% CI = 1.87 to 5.12, P < .001; Table 1).
Prognostic performance of the 26-miRNA signature for OS in the context of clinicopathologic features in the training cohort
| Variable | Univariate Cox | Multivariate Cox | ||
|---|---|---|---|---|
| HR (95% CI) | Pa | HR (95% CI) | Pa | |
| Training cohort (n = 324) | ||||
| miRNA signature (high- vs low-risk) | 3.80 (2.37 to 6.10) | <.001 | 3.10 (1.87 to 5.12) | <.001 |
| Age | 1.02 (1.00 to 1.05) | .08 | 1.02 (1.00 to 1.05) | .16 |
| Stage (IV vs I/II/III) | 0.97 (0.54 to 1.74) | .93 | 0.87 (0.48 to 1.59) | .66 |
| Sex (male vs female) | 2.51 (0.91 to 6.88) | .08 | 2.27 (0.82 to 6.31) | .12 |
| Race (White vs others) | 0.45 (0.24 to 0.84) | .01 | 0.73 (0.38 to 1.42) | .36 |
| Smoking (yes vs no) | 2.09 (1.10 to 3.97) | .02 | 1.42 (0.73 to 2.75) | .30 |
| Chemotherapy (yes vs no) | 1.47 (0.90 to 2.41) | .13 | 1.15 (0.66 to 2.01) | .63 |
| Radiotherapy (yes vs no) | 1.70 (0.54 to 4.26) | .44 | 0.97 (0.30 to 3.13) | .96 |
| Surgery (yes vs no) | 0.29 (0.17 to 0.49) | <.001 | 0.47 (0.25 to 0.85) | .01 |
| Training HPV+ cohort (n = 280) | ||||
| miRNA signature (high- vs low-risk) | 3.07 (1.65 to 5.72) | <.001 | 2.46 (1.28 to 4.72) | .007 |
| Age | 1.04 (1.00 to 1.07) | .02 | 1.03 (1.00 to 1.06) | .10 |
| Stage (IV vs I/II/III) | 0.97 (0.54 to 1.74) | .93 | 0.99 (0.43 to 2.28) | .98 |
| Sex (male vs female) | 7.07 (0.98 to 51.22) | .05 | 6.50 (0.89 to 47.59) | .07 |
| Race (White vs others) | 0.69 (0.24 to 1.91) | .47 | 1.07 (0.37 to 3.11) | .90 |
| Smoking (yes vs no) | 1.87 (0.91 to 3.84) | .09 | 1.42 (0.68 to 2.97) | .35 |
| Chemotherapy (yes vs no) | 1.69 (0.93 to 3.05) | .08 | 1.34 (0.68 to 2.62) | .39 |
| Radiotherapy (yes vs no) | 1.79 (0.52 to 6.17) | .36 | 0.95 (0.24 to 3.74) | .94 |
| Surgery (yes vs no) | 0.31 (0.16 to 0.58) | <.001 | 0.48 (0.23 to 1.01) | .05 |
P value for 2-sided Wald test. CI = confidence interval; HPV = human papillomavirus; HR = hazard ratio; miRNA = microRNA; OS = overall survival.
It is well established that HPV-positive OPSCC has favorable prognosis in general. This motivated us to further assess whether the miRNA signature was a prognostic predictor independent from HPV status. The HPV status of each patient was determined by real-time RT-PCR or p16 IHC. The patients in the training cohort were stratified into 2 groups according to their HPV status (HPV-positive vs HPV-negative). For each group, the miRNA signature was separately applied to prognosticate patient outcomes. Kaplan-Meier survival analysis indicated that the miRNA signature was prognostic when applied to HPV-positive patients alone (HR = 3.07, 95% CI = 1.65 to 5.72, P < .001; Figure 2, D). The risk of disease relapse for the high-risk group was also increased compared with that for the low-risk group (HR = 2.46, 95% CI = 1.35 to 4.49, P < .001for RFS; HR = 2.86, 95% CI = 1.55 to 5.26, P < .001 for MFS; Figure 2, E and F). Importantly, the miRNA signature also maintained its independent prognostic value in the HPV-positive patient subgroup as evaluated by both univariate analysis (HR = 3.07, 95% CI = 1.65 to 5.72, P < .001) and multivariable analysis adjusting for clinicopathologic features (HR = 2.46, 95% CI = 1.28 to 4.72, P = .007; Table 1). We also evaluated the performance of the miRNA signature for HPV-negative patients. Patients with high-risk scores had poor OS, RFS, and MFS compared with patients with low-risk scores (Supplementary Figure 3, C, available online). However, no statistically significant P value was observed partly due to the relatively small sample size (n = 43).
Validation of the miRNA Signature With Two Independent Cohorts
To confirm the general applicability of the miRNA signature, we first downloaded miRNA sequencing data for 79 OPSCC case patients in TCGA (Supplementary Table 1, available online). Using the same cutoff value (score = −47.2) derived from the training cohort, these TCGA patients were stratified into either the high-risk group (33 patients) or low-risk group (46 patients). Kaplan-Meier survival analysis indicated the 2 patient groups had different OS (HR = 6.05, 95% CI = 2.10 to 17.37, P < .001; Supplementary Figure 4, A, available online). Similarly, the 2 patient groups were different in RFS (HR = 5.96, 95% CI = 2.29 to 15.50, P < .001; Supplementary Figure 4, B, available online) and MFS (HR = 5.49, 95% CI = 2.09 to 14.42, P < .001; Supplementary Figure 4, C, available online). When HPV-positive OPSCC patients were assessed alone, it was not feasible for further risk stratification because of the relatively small sample size (n = 50) as well as generally favorable outcomes of these patients. Therefore, we evaluated the miRNA signature using another independent cohort of 130 patients treated at Vanderbilt University (Supplementary Table 1, available online). Small RNA-seq profiling was performed, and 0.53 million miRNA reads were obtained per sample on average. The risk score classified 102 (78.5%) patients as low risk and 28 (21.5%) patients as high risk. The high-risk group differed from the low-risk group for OS (HR = 7.98, 95% CI = 3.99 to 15.97, P < .001; Figure 3, A), RFS (HR = 5.18, 95% CI = 2.90 to 9.27, P < .001; Figure 3, B), and MFS (HR = 6.52, 95% CI = 3.41 to 12.45, P < .001; Figure 3, C). We further validated the prognostic value of the miRNA signature in 103 HPV-positive patients in the Vanderbilt cohort. The risk score stratified HPV-positive patients into high- and low-risk groups that had different OS (HR = 8.71, 95% CI = 2.70 to 28.14, P < .001; Figure 3, D). Similarly, the risk score was also prognostic of RFS (HR = 5.03, 95% CI = 1.88 to 13.47, P < .001; Figure 3, E) and MFS (HR = 7.86, 95% CI = 2.80 to 22.20, P < .001; Figure 3, F). We also evaluated the performance of the miRNA signature in 28 HPV-negative patients from the Vanderbilt cohort. However, no statistically significant difference was observed (Supplementary Figure 5, A-C, available online). As to different findings between the HPV-positive and HPV-negative subgroups, one possible explanation is concerning different risk factors. The largest risk factor for HPV-positive OPSCCs is oral HPV infection, whereas the risk factors for HPV-negative OPSCCs are more diverse (eg, smoking or alcohol). This may lead to a relatively high degree of heterogeneity among HPV-negative patients. Another reason is the much smaller sample size of HPV-negative patients, making it challenging to achieve statistical significance. To increase the sample size of HPV-negative patients, HPV-negative and Vanderbilt HPV-negative subgroups and then investigated whether the miRNA signature can predict risk in this expanded HPV-negative group. For the OS, RFS, and MFS, the P values were all .05 (Supplementary Figure 5, D-F, available online).
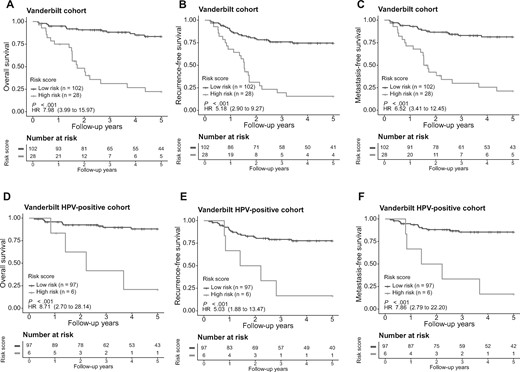
Evaluation of the microRNA (miRNA) signature in the validation cohort. The overall survival, recurrence-free survival, and metastasis-free survival were evaluated in the Vanderbilt validation cohort (A-C). The miRNA signature was also applied to the human papillomavirus (HPV)-positive patient group (D-F) in the Vanderbilt cohort for risk stratification. The patients were stratified into either the high- or low-risk group based on signature risk score. Kaplan-Meier survival curves and log-rank P values are presented. Hazard ratios (HRs) are shown with 95% confidence intervals within parentheses. All statistical tests were 2-sided.
After adjusting for clinicopathologic parameters in multivariable Cox regression analysis, the 26-miRNA signature retained its independent prognostic value in both validation cohorts (HR = 4.85, 95% CI = 1.39 to 16.98, P = .01 for the TCGA cohort and HR = 7.81, 95% CI = 3.12 to 19.51, P < .001 for the Vanderbilt cohort; Table 2). Multivariable Cox analysis also showed that the 26-miRNA signature is an independent prognostic marker associated with OS for HPV-positive patients in the Vanderbilt validation cohort (HR = 6.75, 95% CI = 1.27 to 35.88, P = .03; Table 2). In summary, the new miRNA signature retained its prognostic significance when applied to 2 independent patient cohorts.
Prognostic performance of the 26-miRNA signature for OS in the context of clinicopathologic features in the validation cohorts
| Variable | Univariate Cox | Multivariate Cox | ||
|---|---|---|---|---|
| HR (95% CI) | Pa | HR (95% CI) | Pa | |
| Vanderbilt validation cohort (n = 130) | ||||
| miRNA signature (high- vs low-risk) | 7.98 (4.00 to 15.97) | <.001 | 7.81 (3.12 to 19.51) | <.001 |
| Age | 1.07 (1.03 to 1.11) | .001 | 1.06 (1.00 to 1.11) | .03 |
| Stage (IV vs I/II/III) | 0.80 (0.34 to 1.88) | .61 | 1.77 (0.71 to 4.45) | .22 |
| Sex (male vs female) | 0.51 (0.21 to 1.23) | .14 | 0.98 (0.32 to 2.97) | .97 |
| Race (White vs others) | 0.51 (0.18 to 1.45) | .21 | 1.02 (0.32 to 3.28) | .97 |
| Smoking (yes vs no) | 3.31 (1.30 to 8.43) | .01 | 2.23 (0.84 to 5.88) | .11 |
| Chemotherapy (yes vs no) | 0.71 (0.32 to 1.56) | .39 | 1.53 (0.20 to 11.49) | .68 |
| Radiotherapy (yes vs no) | 0.51 (0.22 to 1.18) | .12 | 0.38 (0.04 to 3.23) | .37 |
| Surgery (yes vs no) | 0.30 (0.14 to 0.64) | .002 | 0.34 (0.13 to 0.91) | .03 |
| Vanderbilt validation HPV+ cohort (n = 103) | ||||
| miRNA signature (high- vs low-risk) | 8.71 (2.70 to 28.14) | <.001 | 6.75 (1.27 to 35.88) | 0.03 |
| Age | 1.04 (0.97 to 1.11) | .27 | 1.05 (0.97 to 1.13) | .24 |
| Stage (IV vs I/II/III) | 0.47 (0.15 to 1.53) | .21 | 0.60 (0.16 to 2.21) | .44 |
| Sex (male vs female) | NA | NA | NA | NA |
| Race (White vs others) | NA | NA | NA | NA |
| Smoking (yes vs no) | 1.77 (0.56 to 5.54) | .33 | 3.15 (0.79 to 12.55) | .10 |
| Chemotherapy (yes vs no) | 13.66 (0.15 to 1253.0) | .26 | NA | NA |
| Radiotherapy (yes vs no) | 7.31 (0.08 to 674.6) | .39 | NA | NA |
| Surgery (yes vs no) | 0.23 (0.07 to 0.79) | .02 | 0.44 (0.12 to 1.69) | .23 |
| TCGA validation cohort (n = 79) | ||||
| miRNA signature (high- vs low-risk) | 6.05 (2.10 to 17.37) | <.001 | 4.85 (1.39 to 16.98) | .01* |
| Age | 1.05 (1.00 to 1.10) | .06 | 1.02 (0.97 to 1.08) | .42 |
| Stage (IV vs I/II/III) | 0.62 (0.25 to 1.53) | .30 | 0.97 (0.34 to 2.79) | .95 |
| Sex (male vs female) | 0.43 (0.15 to 1.22) | .11 | 0.57 (0.19 to 1.78) | .34 |
| Race (White vs others) | 0.60 (0.08 to 4.55) | .63 | 0.82 (0.10 to 7.14) | .86 |
| Smoking (yes vs no) | 3.85 (1.11 to 12.5) | .03 | 0.53 (0.12 to 2.32) | .40 |
| Chemotherapy (yes vs no) | 1.17 (0.42 to 3.22) | .76 | 1.53 (0.38 to 6.15) | .55 |
| Radiotherapy (yes vs no) | 0.70 (0.27 to 1.64) | .47 | 0.99 (0.26 to 3.81) | .99 |
| Surgery (yes vs no) | 1.08 (0.29 to 3.93) | .91 | 0.96 (0.24 to 3.85) | .96 |
P value for 2-sided Wald test. CI = confidence interval; HPV = human papillomavirus; HR = hazard ratio; miRNA = microRNA; OS = overall survival; TCGA = The Cancer Genome Atlas Program.
Discussion
Various clinical trials are underway investigating deescalation treatment plans specifically tailored for HPV-positive OPSCC patients (19). However, there is clear evidence that a subset of HPV-positive OPSCCs behave aggressively and have poor prognosis (20-22). Thus, accurate prognostic stratification of HPV-positive OPSCC patients is urgently needed to exclude these high-risk patients from deescalated treatments. In our study, the miRNA signature was robust at distinguishing high- and low-risk patients in the HPV-positive patient subgroup. Thus, this signature can potentially contribute to improved stratification of HPV-positive OPSCC patients for personalized treatment strategies. However, 1 limitation of the miRNA signature is that it was not prognostic when applied to HPV-negative patients alone, likely due to the small sample size as well as high degree of heterogeneity among this patient subgroup.
The miRNA signature is independent from commonly used clinicopathologic parameters. Of note, 1 statistically significant clinical variable in the multivariable Cox analysis is the surgery status (Table 1). The statistical significance of the surgery status might be partly explained by the fact that patients who underwent surgery are relatively healthier than other patients who are too sick to receive surgery. Previous studies have reported that HPV-positive OPSCC patients treated with transoral surgery have excellent survival (23), and some have suggested that adjuvant radiation or chemoradiation does not provide a survival benefit compared with surgery alone for OPSCCs with low or intermediate risk (24).
A few miRNAs included in our signature have previously been reported as potential cancer biomarkers. For example, miR-455-5p is included in our signature as an unfavorable miRNA. Consistently, previous study shows that miR-455-5p plays an oncogenic role in oral squamous cell carcinoma cells (25), and up-regulation of miR-455-5p was correlated with poor prognosis in oral squamous cell carcinoma (26). As another example, miR-363-3p is a favorable miRNA in our miRNA signature, and this miRNA has been shown to suppress tumor growth and metastasis in various human cancers (27,28). Besides these reported miRNAs, our new signature also includes many prognostic miRNAs whose functional roles in OPSCC have yet to be characterized. To further explore the functions of these prognostic miRNAs, genes targeted by the miRNAs were predicted by miRDB (16). DAVID was then used to identify gene ontology functional enrichment of the target genes (29). The most enriched biological process term is regulation of transcription from RNA polymerase II promoter (P < .001). Selected miRNAs and their gene targets involved in this functional category are shown in Supplementary Figure 6 (available online). Dysregulation of RNA polymerase II–mediated transcription is commonly associated with disease phenotypes, especially cancer (30). Previous studies indicate that transcriptional addiction is characteristic of cancer cells to support uncontrolled proliferation (31). Thus, functional analysis of these miRNA biomarkers may further our understanding of the molecular pathogenesis of OPSCC.
Funding
This research was supported by the National Institutes of Health (R01DE026471, R01CA233873, and R01GM089784).
Notes
Role of the funder: The funding source had no role in the design of the study; the collection, analysis, and interpretation of the data; the writing of the manuscript; and the decision to submit the manuscript for publication.
Disclosures: WLT has family member working at Elekta, Inc; however, we do not use any Elekta hardware or software in our clinic.
Author contributions: Xinyi Liu: Conceptualization; Data curation; Formal analysis; Investigation; Methodology; Software; Validation; Writing – original draft; Writing – review and editing; Ping Liu: Conceptualization; Data curation; Formal analysis; Investigation; Methodology; Validation; Writing – original draft; Writing – review and editing; Rebecca ChernockCo-Author: Contributor Information: Conceptualization; Data curation; Formal analysis; Investigation; Resources; Writing – review and editing; Zhenming Yang: Data curation; Formal analysis; Investigation; Writing – review and editing; Krystle Lang Kuhs: Data curation; Formal analysis; Investigation; Resources; Writing – review and editing; Jame Lewis: Data curation; Formal analysis; Investigation; Resources; Writing – review and editing; Jingqin Luo: Data curation; Formal analysis; Software; Writing – review and editing; Hua Li: Conceptualization; Funding acquisition; Investigation; Writing – review and editing; Hiram Gay and Wade Thorstad: Data curation; Formal analysis; Investigation; Resources; Writing – review and editing.
Data Availability
The data underlying this article will be shared on reasonable request to the corresponding author.
References
Author notes
Xinyi Liu and Ping Liu authors contributed equally to this work.

