


Abstract
Black men in the United States have markedly higher rates of prostate cancer than the general population. National guidelines for prostate-specific antigen (PSA) screening do not provide clear guidance for this high-risk population. The purpose of this study is to estimate the benefit and harm of intensified PSA screening in Black men.
Two microsimulation models of prostate cancer calibrated to incidence from the Surveillance, Epidemiology, and End Results program among Black men project the impact of different screening strategies (varying screening intervals, starting and stopping ages, and biopsy utilization following an abnormal PSA) on disease-specific mortality and overdiagnosis. Each strategy induces a mean lead time (MLT) for detected cases. A longer MLT reduces mortality according to estimates combining the US and European prostate cancer screening trials but increases overdiagnosis.
Under historical population screening, Black men had similar MLT to men of all races and similar mortality reduction (range between models = 21%-24% vs 20%-24%) but a higher frequency of overdiagnosis (75-86 vs 58-60 per 1000 men). Screening Black men aged 40-84 years annually would increase both mortality reduction (29%-31%) and overdiagnosis (112-129 per 1000). Restricting screening to ages 45-69 years would still achieve substantial mortality reduction (26%-29%) with lower overdiagnosis (51-61 per 1000). Increasing biopsy utilization to 100% of abnormal tests would further reduce mortality but substantially increase overdiagnosis.
Annual screening in Black men is expected to reduce mortality more than that estimated under historical screening. Limiting screening to men younger than 70 years is expected to help reduce overdiagnosis.
Data from the Surveillance, Epidemiology, and End Result (SEER) cancer registry demonstrates a persistent two-fold higher rate of prostate cancer mortality among Black men relative to men of other races that has persisted for the last 5 decades (1). This racial disparity in mortality is currently the most extreme among all cancers in the United States (2).
As with other cancers, the observed disparity likely reflects complex differences in biological, environmental, social, and health system factors. Various studies in prostate cancer have demonstrated parity in prostate cancer survival from diagnosis when Black and White men are matched by disease severity in the setting of equal access to treatment (3,4). Yet, in practice, Black men present at younger ages and with more advanced disease than White men in the United States (5,6). Given the markedly increased incidence of diagnosis among Black men, creating racial parity in prostate cancer mortality will require earlier detection at less advanced stages and appropriate utilization of definitive therapy in Black men with clinically significant disease.
In this article, we study the potential impact of intensifying screening in Black men in an attempt to maximize the early detection of cancers that are curable with definitive treatment. We consider more frequent prostate-specific antigen (PSA) testing and prostate biopsy for abnormal test results as well as different ages for starting and stopping testing. Survey and registry data suggest that PSA screening frequency rates are historically similar between Black and White men in the United States (7-9). Reports regarding utilization of prostate biopsy for positive tests are mixed, with Barocas et al. (10) reporting lower use of prostate biopsy among Black men in the Prostate, Lung, Colorectal, and Ovarian cancer screening trial and Miller et al. (11) finding that Black men were more likely to undergo prostate biopsy for elevated PSA tests in an updated analysis of the same trial.
A population-level assessment of the impacts of intensifying prostate cancer early diagnosis efforts in Black men has important implications for patients, advocates, researchers, and clinicians working toward equity in racial outcomes. But intensifying screening opens up the potential for increasing overdiagnosis. Therefore, in addition to assessing benefit, we also assess the extent of overdiagnosis under the intensified strategies.
Methods
Overview
By “intensified early detection,” we refer to increased frequency of PSA testing and/or increased frequency of prostate biopsy in men with elevated PSA concentration (>4.0 ng/mL). The benefit of prostate cancer screening is the relative reduction in prostate cancer mortality and is based on previous estimates combining 2 large, randomized controlled trials of prostate cancer screening (12-14). Harm focuses on overdiagnosis among men screened; we do not consider additional potential harms such as unnecessary biopsies. Historical prostate cancer screening reflects approximately biennial PSA testing for ages 50-84 years and a biopsy rate of 40% following an abnormal (>4.0 ng/mL) PSA test. Historical prostate cancer screening and biopsy practices were based on screening patterns reported in the National Health Interview Survey and the SEER-Medicare database (9) and biopsy practices in the Prostate, Lung, Colorectal, and Ovarian cancer screening trial (15).
Model Descriptions
We use 2 established microsimulation models to project the impact of intensified early detection on prostate cancer mortality and overdiagnosis among Black men in the United States (16-19). Both models estimate transitions between clinical states—latent early, latent advanced, clinical early, and clinically advanced prostate cancer. In the Fred Hutchinson Cancer Research Center model, cancer grade is fixed at onset, and rates of progression from early to advanced and from latent to clinical disease are correlated with individual PSA growth trajectories, which were estimated externally. In the Erasmus Medical Center MIcrosimulation SCreening ANalysis model, cancer progresses through both stages and grades, but progression rates are not explicitly correlated with PSA levels. State transition rates in both models were calibrated so that model-projected incidence patterns match those from the SEER registry for Black men under screening and diagnostic practices observed among Black men (8); see Supplementary Figure 1 (available online). The calibrated models reflect a greater risk of disease onset and progression to metastasis before clinical presentation among Black men compared with men of all races (8). The microsimulation framework produces a set of virtual life histories representing the population disease experience of onset, progression, and diagnosis.
Superimposing a given screening and biopsy strategy on the simulated life histories leads to early detection of some cancers that would have progressed further in the absence of screening. The mean lead time (MLT) is the average time by which screening advances detection under a specific screening strategy. Thus, the MLT captures the average “earliness” of the cancers detected. The MLT for a given strategy is calculated empirically from simulated life histories as the difference in diagnosis-free survival under that strategy vs under no screening. As in Tsodikov et al. (14), diagnosis-free survival is restricted to 11 years of follow-up, the maximum available from both trials, and differences between curves are divided by the estimated probability of diagnosis in the absence of screening or competing mortality, which represents a baseline risk of diagnosis. Screening benefit increases with the MLT based on estimates using combined data from the US and European prostate cancer screening trials. Confidence intervals for the resulting projected mortality reduction are based on confidence limits for the estimates of screening benefit. Screen-detected cancers that would not have been diagnosed in the absence of screening during a patient’s remaining lifetime are considered to be overdiagnosed.
Intensified Early Detection
First, we study the mortality reduction that could be achieved using more frequent screening and biopsy. Specifically, we calculate the MLT if the historical screening frequency is increased to annual testing, and we project the corresponding mortality reduction and frequency of overdiagnosis. We further project these outcomes if the biopsy rate is increased to 100% for men with a positive test. We then repeat this exercise varying the starting age for screening and stopping at age 70 years as recommended by the US Preventive Services Task Force.
Results
Estimates of the overall, screen-detected, and overdiagnosed cancers under no screening, historical, and intensified early detection strategies are presented in Figure 1. Projected outcomes are qualitatively similar between the 2 models for most outcomes. In both models, the incidence of latent disease is higher among Black men compared with all races, and this leads to higher rates of screen detection and overdiagnosis per 1000 men.
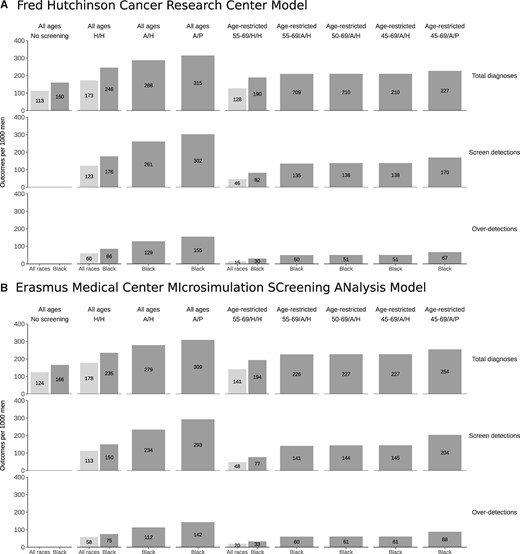
Total prostate cancer diagnoses, screen detections, and overdiagnosed cases per 1000 men under no screening and historical early detection strategies for all races (light gray) and under no screening, historical, and intensified early detection strategies for Black men (dark gray) projected by (A) the Fred Hutchinson Cancer Research Center model and (B) the Erasmus Medical Center MIcrosimulation SCreening ANalysis model. Results for strategies with and without age restrictions are shown separately. A/H = annual frequency/historical biopsy; A/P = annual frequency/perfect biopsy; H/H = historical frequency/historical biopsy.
Estimated MLTs under historical screening and biopsy were 2.8-3.5 years (range between models) for Black men and 2.7-3.6 years for all races. Figure 2 illustrates the estimated relative changes in prostate cancer incidence and mortality under the early detection strategies modeled. Historical screening and prostate biopsy utilization are associated with an estimated 21%-24% mortality reduction among Black men and 20%-24% among all races. This benefit comes at a cost of 75-86 overdiagnoses per 1000 men screened among Black men compared with 58-60 among men of all races. Relative harm and benefit (with confidence intervals) estimated by each model for different screening strategies is shown in Table 1.
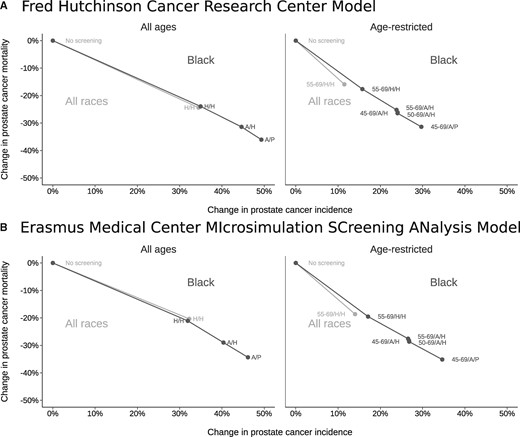
Changes in prostate cancer incidence (overdiagnosis) and mortality under no screening and historical early detection strategies for all races (light gray) and under no screening, historical, and intensified early detection strategies for Black men (dark gray) projected by (A) the Fred Hutchinson Cancer Research Center model and (B) the Erasmus Medical Center MIcrosimulation SCreening ANalysis model. Lines connect results for each race group. A/H = annual frequency/historical biopsy; A/P = annual frequency/perfect biopsy; H/H = historical frequency/historical biopsy.
Estimated mean lead time (MLT), percent increase in incidence (overdiagnosis), and percent reduction in mortality for historical early detection strategies for all races and historical and intensified early detection strategies for Black mena
| Model | Ages, y | Race | Frequency | Biopsy, % | MLT | Overdiagnosis, % | Mortality reduction Estimate, % (95% CI) |
|---|---|---|---|---|---|---|---|
| FHCRC | 40-84 | All races | Historical | 40 | 3.6 | 34.5 | 24.4 (9.1 to 37.1) |
| 40-84 | Black | Historical | 40 | 3.5 | 35.0 | 23.9 (8.9 to 36.5) | |
| 40-84 | Black | Annual | 40 | 4.9 | 44.6 | 31.4 (12.1 to 46.4) | |
| 40-84 | Black | Annual | 100 | 5.8 | 49.3 | 36.0 (14.2 to 52.3) | |
| 55-69 | All races | Historical | 40 | 2.2 | 11.5 | 15.9 (5.8 to 25.0) | |
| 55-69 | Black | Historical | 40 | 2.5 | 15.8 | 17.6 (6.4 to 27.5) | |
| 55-69 | Black | Annual | 40 | 3.8 | 23.8 | 25.2 (9.5 to 38.2) | |
| 50-69 | Black | Annual | 40 | 3.9 | 24.1 | 26.2 (9.9 to 39.5) | |
| 45-69 | Black | Annual | 40 | 4.0 | 24.1 | 26.4 (10.0 to 39.9) | |
| 55-69 | Black | Annual | 100 | 4.6 | 29.5 | 30.1 (11.5 to 44.8) | |
| 50-69 | Black | Annual | 100 | 4.8 | 29.7 | 31.0 (11.9 to 46.0) | |
| 45-69 | Black | Annual | 100 | 4.9 | 29.7 | 31.4 (12.1 to 46.4) | |
| MISCAN | 40-84 | All races | Historical | 40 | 2.7 | 32.3 | 20.4 (7.4 to 31.5) |
| 40-84 | Black | Historical | 40 | 2.8 | 31.9 | 21.1 (7.6 to 32.5) | |
| 40-84 | Black | Annual | 40 | 4.1 | 40.4 | 29.0 (10.8 to 43.4) | |
| 40-84 | Black | Annual | 100 | 5.0 | 46.2 | 34.3 (13.2 to 50.4) | |
| 55-69 | All races | Historical | 40 | 2.5 | 14.0 | 18.6 (6.7 to 29.0) | |
| 55-69 | Black | Historical | 40 | 2.6 | 17.1 | 19.5 (7.0 to 30.3) | |
| 55-69 | Black | Annual | 40 | 3.9 | 26.6 | 27.6 (10.3 to 41.5) | |
| 50-69 | Black | Annual | 40 | 4.0 | 26.8 | 28.2 (10.5 to 42.4) | |
| 45-69 | Black | Annual | 40 | 4.0 | 26.8 | 28.7 (10.7 to 43.0) | |
| 55-69 | Black | Annual | 100 | 5.0 | 34.5 | 33.9 (13.0 to 49.8) | |
| 50-69 | Black | Annual | 100 | 5.1 | 34.6 | 34.6 (13.3 to 50.7) | |
| 45-69 | Black | Annual | 100 | 5.2 | 34.6 | 35.1 (13.5 to 51.4) |
CI = confidence interval; FHCRC = Fred Hutchinson Cancer Research Center; MISCAN = Erasmus Medical Center MIcrosimulation SCreening ANalysis.
Increasing screening frequency to annual testing enlarges the mortality reduction (to 29%-31%) but also dramatically increases overdiagnosis (to 112-129 per 1000 men), which is mostly concentrated among older screen-detected cases. Restricting screening to ages 55-69 years produces a smaller mortality reduction (18%-20%) but a more favorable rate of overdiagnosis (30-33 per 1000 men). Combining annual screening with age-restricted screening ages may reflect a more acceptable harm-benefit trade-off than annual screening without age restriction. For example, annual screening for ages 45-69 years produces a large mortality reduction (26%-29%) while limiting overdiagnosis (51-61 per 1000). Increasing biopsy utilization to a hypothetical upper bound of 100% of positive tests in this setting achieves a larger mortality reduction (31%-35%) but also increases overdiagnosis to historical levels (67-88 per 1000 men).
Figure 3 contextualizes the impact of an intensified early detection strategy using a single model (the Fred Hutchinson Cancer Research Center model). No screening generated 50 prostate cancer deaths (light, medium, and dark gray figures), and historical frequency generated 40 prostate cancer deaths (medium and dark figures) per 1000 men. Annual screening for ages 45-69 years generated 35 prostate cancer deaths (dark figures) per 1000 men while not increasing the prostate biopsy rate above historical levels.
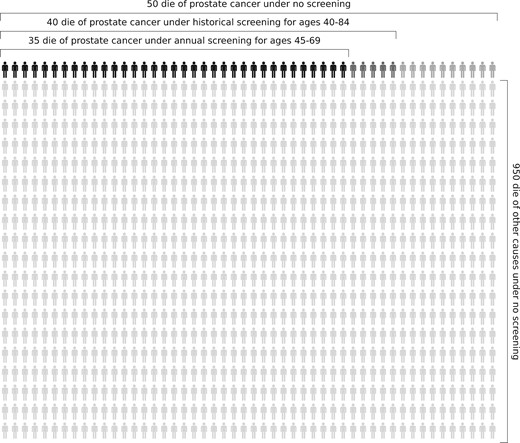
Prostate cancer deaths among 1000 Black men projected by the Fred Hutchinson Cancer Research Center model. The model projects 50 deaths (light, medium, and dark gray figures) under no screening, 40 deaths (medium and dark gray figures) under historical screening and biopsy, and 35 deaths (dark gray figures) under annual screening for ages 45-69 years.
Discussion
Limited data exist on the impact of PSA screening on racial disparities in prostate cancer outcomes in the United States. A study of changes in prostate cancer survival during the PSA era suggested that disparities in outcomes were narrowing (20), but much of this effect was later shown to be artifacts of lead time and overdiagnosis biases (21).
This study is the first to project the outcomes of specific strategies intensifying early detection for Black men. A strategy of annual testing among men ages 45-69 years with a biopsy rate for positive tests similar to historical rates is projected to yield a larger mortality reduction (26%-29%) and lower overdiagnosis frequency (51-61 per 1000 men) compared with historical early detection practices. Additional benefit is projected for screening men up to age 84 years and/or increasing the biopsy rate, but these strategies incur substantial costs in terms of overdiagnosis that are not likely to be sustainable in the population setting.
Our findings suggest that we may be able to create more parity in prostate cancer mortality by increasing the frequency of PSA testing in Black men. However, intensified screening interventions should be targeted to men younger than 70 years because of high rates of overdiagnosis among older Black men because of their high incidence of preclinical disease. Thus, a screening strategy that minimizes overdiagnosis—and subsequent overtreatment—is prudent as we explore ways to use early cancer detection to minimize racial disparities in prostate cancer outcomes. Although we consider an age cutoff of 70 years to limit overdiagnosis among older men, an alternative would be to use a life expectancy threshold.
Numerous studies have shown that Black and White men have similar prostate cancer outcomes when matched stage for stage and grade for grade in the setting of equal treatment (3,4,22). The challenge of interpreting the results of these studies is that Black men in the United States are more likely to present with prostate cancer at younger ages and with more aggressive disease by both stage and grade compared with men of other races and ethnicities (5,6,23). In previous work published utilizing the models in this study, Tsodikov and colleagues (8) found that Black men had an estimated 28%-56% higher risk of preclinical prostate cancer and 44%-75% higher risk of progressing to metastatic prostate cancer by the time of clinical diagnosis when compared with the general population. The greater risk of progression to incurable disease among Black men suggests that a targeted strategy involving intensified screening may be warranted in this population and may ultimately narrow existing racial disparities in prostate cancer mortality. More frequent use of prostate biopsy and/or confirmatory testing may also contribute to this goal, but unless implemented selectively (eg, with appropriate use of reflex testing and/or prostate magnetic resonance imaging, and also accounting for family history and/or genetic risk), it could exacerbate overdiagnosis among Black men.
Our analysis shows that lowering the age to start screening Black men from 55 to 45 years has little effect on the relative reduction in prostate cancer mortality in this population despite its elevated risk. Although this finding may seem surprising, the models project the relative reduction in mortality due to screening based directly on the MLT that results from the screening regimen. Because only a small fraction of cases arise in men aged 45-54 years, the MLT is barely altered by shifting the starting age (Table 1), and consequently, the projected relative reduction in mortality also barely changes with a younger starting age. This does not, however, imply that screening cannot save lives among younger men. Indeed, the European trial estimated greater benefit at younger ages (14). This observation, combined with the increased burden of prostate cancer among younger Black men (8) and the low frequency of overdiagnosis at younger ages (24), leads to a compelling rationale for beginning screening at age 45 years in this high-risk population. Naturally, screening Black men more intensively will lead to detection of low-risk prostate cancers that warrant active surveillance. This topic has been controversial in the past, but recent studies have shown increased adoption (25,26) and safety of protocol-driven (27,28) active surveillance in Black men with favorable-risk prostate cancers.
Our study is a modeling study that is subject to a number of limitations. Underrepresentation of men of African ancestry in the US and European trials (0%-3%) (12,13) forced us to use the estimated mortality reduction for mainly White men in our simulations. Although it may be reasonable to assume that the benefit of screening does not vary by race, this has not been validated with prospective data. Further, the historical screening and biopsy practices assumed herein are simplified summaries of a time-varying process. Finally, the hypothetical scenarios proposed do not accommodate social and health barriers to health-care access and utilization for Black men in the United States. These issues present challenges to potential implementation of the intensified early detection strategies evaluated. For example, it is unlikely that 100% of men would receive a biopsy following a positive PSA test.
Given the disparate burden of prostate cancer among Black men, there is a need for national guideline and policy recommendations that tailor early detection strategies to this high-risk population (29). Despite the limitations, our findings provide guidance regarding how key outcomes of prostate cancer screening are likely to change if screening is intensified among Black men. And the strong degree of concordance between 2 independently developed microsimulation models suggests these findings are robust. Our results serve as a basis for specific recommendations that could help Black men make decisions about how they can best use screening to manage their increased risk of prostate cancer incidence and mortality.
Assuming benefit estimated from the PSA screening trials is appropriate for Black men in the United States, our analysis quantifies the plausible impact of increased intensity of early detection strategies in Black men. In particular, annual testing for ages 45-69 years is predicted to improve the balance of harm and benefit relative to historical practices in this population.
Funding
This work is supported by a post-doctoral fellowship award from the Department of Defense (grant number CDMRP W81XWH1910577 to YAN) and the National Institutes of Health (grant numbers R50 CA221836 to RG and U01 CA199338 and U01 CA253915 to RE).
Notes
Role of the funder: This study was supported by the Department of Defense and the National Cancer Institute, which had no role in the design, conduct, or analysis of the study or the decision to submit the manuscript for publication.
Disclosures: The authors declare no potential conflicts of interest.
Author contributions: Conceptualization, YAN, RG, EAH, and RE; Methodology, RG, EAMH, and AT; Formal Analysis, RG and EAMH; Writing—Original Draft, YAN, RG, and RE; Writing—Review & Editing, YA, RG, AB, JLG, and RE; Visualization, RG.
Data Availability
The model estimates reported in this article are available in the Harvard Dataverse at https://doi.org/10.7910/DVN/0WBW5E.
References
National Cancer Institute Surveillance, Epidemiology, and End Results Program SEER 9 Regs Research Data, Nov 2019 Sub (1975-2017). National Cancer Institute, DCCPS, Surveillance Research Program Surveillance Systems Branch. http://www.seer.cancer.gov. Published April 2020. Accessed June 28, 2020.

