


Abstract
Phase I oncology trials are often regarded as a therapeutic option for patients. However, such claims have relied on surrogate measures of benefit, such as objective response.
Using a systematic search of publications, we assessed the therapeutic value of phase I cancer trial participation by determining the probability that patients will receive active doses of treatments that eventually receive FDA approval or a National Comprehensive Cancer Network (NCCN) guideline recommendation for their indication. ClinicalTrials.gov, PubMed, American Society of Clinical Oncology reports, NCCN guidelines, and Drugs@FDA were searched between May 1, 2018, and July 31, 2018. All statistical tests were 2-sided.
A total of 1000 phase I oncology trials initiated between 2005 and 2010 and enrolling 32 582 patients were randomly sampled from 3229 eligible trials on ClinicalTrials.gov. A total of 386 (1.2%) patients received a treatment that was approved by the US Food and Drug Administration for their malignancy at a dose delivered in the trial; including NCCN guideline recommendations, the number and proportion are 1168 (3.6%). Meta-regression showed a statistically significantly greater proportion of patients receiving a drug that was ultimately FDA approved in biomarker trials (rate ratio = 4.49, 95% confidence interval [CI] = 1.53 to 13.23; P = .006) and single-indication trials (rate ratio = 3.32, 95% CI = 1.21 to 9.15; P = .02); proportions were statistically significantly lower for combination vs monotherapy trials (rate ratio = 0.09, 95% CI = 0.01 to 0.68; P = .02).
One in 83 patients in phase I cancer trials received a treatment that was approved for their indication at the doses received. Given published estimates of serious adverse event rates of 10%-19%, this represents low therapeutic value for phase I trial participation.
Phase I oncology trials are designed to evaluate the safety, tolerability, and dosing for new therapeutic strategies. Because they provide access to promising investigational treatments, many patients, oncologists, and policy-makers regard them as a therapeutic option for patients who meet eligibility (1,2). The classification of phase I trials as therapeutic has important implications for how enrollment is explained to patients when approached for participation, reimbursement of expenses associated with trial participation (1), hospice care (3), and optimal transition to end-of-life planning and care (4).
The American Society of Clinical Oncology endorsed a policy position that phase I cancer studies have therapeutic intent and thus have the potential to provide direct medical benefit (1,2). This view, however, has been challenged by some commentators (5). Advocates supporting the therapeutic view of phase I trials highlight that meta-analyses show that overall response rate, a surrogate endpoint for benefit based on tumor shrinkage, is 10.6%-13.2% in phase I trials (6,7). Such response rates are comparable with certain anticancer medications approved by the US Food and Drug Administration (FDA) (8). Other arguments include the fact that enrollment in phase I trials has the potential to expose patients to the next “medical breakthrough” (8). For example, the first phase I trial of imatinib (Gleevec) resulted in 97% of patients achieving complete hematological response and 54% achieving complete cytogenic response (9,10).
However, meta-analyses of phase I cancer trials suffer from problems related to measuring the true therapeutic value of phase I studies. First, they estimate benefit using the surrogate endpoint, overall response rate, which is an unreliable predictor of clinical outcomes like survival or quality of life (11–13). Second, meta-analyses that combine the results of trials testing many different drugs and indications contend with high levels of methodological, clinical, and statistical heterogeneity. Third, whether a given response rate is therapeutic is a matter of subjective judgment. Regulatory approval expresses a social standard regarding whether an experimental treatment has a therapeutic value. This and the previous two challenges can be addressed by instead measuring therapeutic benefit in terms of the probability patients entering phase I trials will receive a therapy that eventually is given regulatory approval for their condition. What follows represents our analysis of a random sample of 1000 registered phase I cancer trials.
Methods
Aims and Definitions
The goal of our study was to determine the proportion of patients participating in phase I cancer trials that receive treatment regimens ultimately established as safe and effective. We defined “therapeutic regimens” as those involving a drug, indication, and approximate dose that received an FDA label, allowing for dose reductions. To account for dose escalation methods employed in phase I trials, a therapeutic regimen counts as when a patient received a drug dose between the lowest recommended dose reduction (as specified on the FDA label) and the FDA-recommended dose. Doses below the lowest dose recommendation and above the maximally tolerated dose were thus considered nontherapeutic. In addition to FDA approval, some cancer drugs are recommended for off-label use in clinical practice guidelines (14). As a secondary measure of therapeutic advancement, we analyzed whether therapies received by patients in phase I cancer trials were incorporated into recommendations in National Comprehensive Cancer Network (NCCN) guidelines (15).
Sampling
To create a cohort of phase I trials, we searched ClinicalTrials.gov for all phase I oncology trials registered as beginning between January 1, 2005, and December 31, 2010, using the following search terms: cancer OR cancers OR carcinoma OR carcinomas OR malignant OR malignancy OR malignancies OR tumor OR tumors OR tumour OR tumours OR neoplasm OR neoplasms OR metastatic OR lymphoma OR leukemia OR leukemias. We restricted our search to ClinicalTrials.gov because our definition of “therapeutic regimen” involves approval at a US agency. Although the FDA does not mandate prospective registration of phase I trials, many major pharmaceutical companies maintain policies of registering phase I trials and many other entities require registration of phase I trials (16–18). To be included, phase I trials must have been employing an intervention and enrolled at least 1 patient. All patients participating in the trial must have had a cancer indication. We excluded trials of nondrugs or therapies that did not have a clear product name (eg, stem cells, surgery only); symptomatic treatment for cancer; trials open for enrollment at the time of extraction; trials without at least 1 study location in the United States; and trials with a primary outcome that was not safety, tolerability, or efficacy. We also excluded phase I trials that enrolled 200 or more participants, because these trials typically involve large expansion cohorts that are more akin, design- and objective-wise, to multiple phase II studies than they are to tests of a new drug or combination (19). Our choice of a 200-patient cutoff was designed to avoid any possibility of erroneously excluding more canonical phase I–type trials. Our time frame (2005-2010, inclusive) was chosen to allow for an adequate period of time for regimens tested in our cohort of phase I trials to advance to regulatory approval. The end date for assessing approval status was January 1, 2019. Because typical cancer drug development trajectories take approximately 7 years (20), our time frame allowed promising drugs to have sufficient time to receive approval if effective.
We sampled 1000 phase I trials as follows. First, we downloaded all 3229 phase I cancer trial registration records within our time frame. After randomizing the order of that sample, we screened sequentially until we obtained 1000 trials that met our eligibility criteria. All registry searches as well as corresponding publication searches (see below) were conducted May-July 2018.
Extraction
The following data were extracted from trial registration records: drug name, number of patients enrolled, monotherapy or combination therapy, cancer indication, trial sponsorship, whether the trial was single or mixed indication, and biomarker enrichment. Patient enrollment was determined by the “actual enrollment” number in the trial registry. The “estimated enrollment” was used when actual enrollment information was unavailable. Whether the drug was eventually approved was determined through confirmation using the Drugs@FDA database. For trials where data regarding dosing or cancer indication were not directly available on registration records, publications for registered trials were searched on PubMed and Google Scholar using the NCT number and the title (including any alternate titles given) of the trial registry found on ClinicalTrials.gov. Publication, drug classification, and drug approval searches were performed independently by 2 individuals. Patient data involving dosage and cancer indication were extracted from these publications. In the event a publication was not found and information was not available on the trial registry, patient cancer indication was extracted as “mixed tumors” and, if the drug never received approval, all exposures were deemed “nontherapeutic.” Information on what constituted an active dose was extracted from drug labels in the Drugs@FDA database. For the purposes of our study, a drug needed to fall within the range of the recommended dose and the lowest dose reduction specified on the drug label to be considered “therapeutic” by the FDA. Because NCCN guidelines often did not include dose reductions, we approximated a therapeutic administration by NCCN guidelines if the administrated dosage fell between 50% and 100% of the recommended dosage.
Data Curation
Cancer indications for patients in phase I trials were categorized according to broad National Cancer Institute categories (21). Drugs were classified based on 4 categories: cytotoxic chemotherapy (eg, intercalating agents, antimetabolites, alkylating agents), targeted therapy (eg, tyrosine-kinase inhibitors, angiogenesis inhibitors, histone deacetylase inhibitors), immunotherapy (eg, checkpoint inhibitors, immunomodulators, cancer vaccines), and other (eg, gene transfer, viral therapy, hormone therapy). For drug combinations, the drug class of the combination was categorized based on the investigational agent of the most novel drug within the combination. A drug was considered novel if it was not approved by the FDA before the trial start date.
Statistical Analysis
We performed descriptive statistics of clinical trials and drugs in our sample. Our primary endpoint—therapeutic proportion—was calculated as the ratio of the total number of patients achieving the outcome of having received a therapeutic regimen to the total number of patients who participated in phase I trials along with 95% confidence intervals (CIs). We also performed prespecified analyses on the relationship between the therapeutic proportion and whether participants were enrolled in biomarker-enriched phase I trials, monotherapy vs combination therapy trials, industry vs nonindustry funded trials, drugs unapproved at trial outset vs drugs that already had a label at trial outset, relationship between therapeutic proportion and type of cancer indication, single indication trials vs mixed malignancy trials, and class of drug. We performed a sensitivity analysis for trials that had 12 years of follow-up to allow for greater follow-up time for FDA approval. We also performed a sensitivity analysis to determine the proportion of patients who received an experimental drug that eventually received FDA approval without dosage or indication requirements. Post hoc, we included recommendations within NCCN guidelines as a more permissive definition of therapeutic regimens. All analyses were prespecified in a protocol. All departures from protocol are explained in the Supplementary Material (available online). Meta-regression using Poisson regression with the trial as random effect was performed to assess the association between therapeutic benefit and the aforementioned trial characteristics. Results of the Poisson regression are expressed as rate ratios with 95% confidence intervals. We defined P less than or equal to .05 as statistically significant; because inferential tests were exploratory only, we did not adjust for multiple hypothesis testing. All tests were 2-sided.
Results
Trial Characteristics
Our search study identified 3229 potential clinical trial records. After being placed in random order, 1541 underwent sequential screening to identify 1000 trials that met eligibility (Figure 1). We extracted data from 1000 phase I trials comprising a total of 32 582 patients. A total of 922 unique drugs or drug combinations were tested in 55 different cancer indications. Table 1 summarizes the characteristics of our trial sample. The mean (SD) sample size of trials in our sample was 32.6 (24). Most trials enrolled patients with solid tumors (78.6%) compared with hematological cancers (18.7%); a small proportion (2.7%) of trials enrolled patients regardless of malignancy type (Table 1). Trials were also evenly distributed among the years 2005-2010. For a histogram showing the sample size for the included trials, see Supplementary Figure 1 (available online).
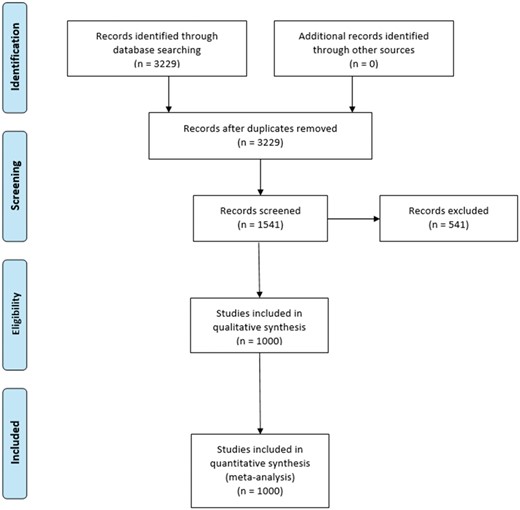
Preferred Reporting Items for Systematic Reviews and Meta-Analyses (PRISMA) diagram for search selection. Flowchart of studies selected to be included in the analysis.
Trial and drug characteristics
| Trial characteristics | No. (%) |
|---|---|
| Median trial size, No. of patients | 26 |
| Trial start year | |
| 2005 | 116 (11.6) |
| 2006 | 151 (15.1) |
| 2007 | 150 (15.0) |
| 2008 | 148 (14.8) |
| 2009 | 182 (18.2) |
| 2010 | 253 (25.3) |
| Sponsorship | |
| Nonindustry | 479 (47.9) |
| Industry | 521 (52.1) |
| Type of therapy | |
| Monotherapy: 1 drug | 489 (48.9) |
| Combination: ≥2 drugs | 511 (51.1) |
| Approval status | |
| Previously approved | 557 (55.7) |
| Novel treatment | 443 (44.3) |
| Biomarker enrichment | |
| Yes | 90 (9.0) |
| No | 910 (91.0) |
| Cancer indication | |
| Hematological | 187 (18.7) |
| Solid tumor | 78.6 (78.6) |
| Both | 27 (2.7) |
| Drug class | |
| Cytotoxic | 173 (17.3) |
| Targeted | 637 (63.7) |
| Immunotherapy | 131 (13.1) |
| Other | 59 (5.9) |
| Drug characteristics | |
| No. of unique drugs or drug combinations | 922 |
| Type of therapy | |
| Monotherapy (1 drug) | 403 (43.7) |
| Combination (≥2 drugs) | 519 (56.3) |
| Approval status | |
| Previously approved | 526 (57.0) |
| Novel treatment | 396 (43.0) |
| Drug class | |
| Cytotoxic | 158 (17.1) |
| Targeted | 576 (62.5) |
| Immunotherapy | 129 (14.0) |
| Other | 59 (6.4) |
| No. of indications tested | |
| Mixed | 448 (44.8) |
| Single | 552 (55.2) |
Drug Characteristics
Forty-eight of 922 (5.2%) therapies eventually led to FDA approval. There were 396 (42.9%) novel drugs, of which 31 (7.8%) led to approval. Notable novel drugs in our sample included ipilimumab, olaparib, crizotinib, and blinatumomab. Examples of nonnovel drugs in phase I testing for new indications included bevacizumab, imatinib, rituximab, and trastuzumab. Targeted therapy comprised 576 drugs (62.5%), followed by cytotoxic therapy (n = 158, 17.1%), immunotherapy (n = 129, 14.0%), and other therapies (n = 59, 6.4%) (Table 1).
Proportion of Participants Receiving Therapeutic Regimens
The number of patients receiving regimens that were eventually approved by the FDA for their indication and at an appropriate dose was 386 (1.2%, 95% CI = 1.1% to 1.3%). Disregarding indication, 1595 patients (4.9%) received a previously unapproved drug that was eventually approved by the FDA. Table 2 presents this estimate by common tumor types.
Top 10 (n > 1000) cancer indications by total and therapeutic patient numbera
| Indication | No. of patients (proportion of total, %) | No. of therapeutic patients (therapeutic proportion, %) |
|---|---|---|
| Colorectal cancer | 3063 (9.4) | 0 (0) |
| Breast cancer | 2498 (7.7) | 31 (1.2) |
| Lung cancer | 2184 (6.7) | 57 (2.6) |
| Brain and CNS cancers | 1731 (5.3) | 30 (1.7) |
| Acute myeloid leukemia | 1575 (4.8) | 20 (1.3) |
| Prostate cancer | 1491 (4.3) | 47 (3.2) |
| Melanoma | 1379 (4.2) | 113 (8.2) |
| Pancreatic cancer | 1330 (4.1) | 2 (0.2) |
| Ovarian cancer | 1205 (3.7) | 64 (5.3) |
| Lymphoma | 1173 (3.6) | 55 (4.7) |
CNS = central nervous system.
Table 3 presents multivariable predictors of therapeutic proportion at the patient level. We did not observe a statistically significant trend towards a greater proportion of patients receiving therapeutic regimens over the 5-year span of our trial sample. Patients enrolled in biomarker-enriched trials had a statistically significantly greater proportion receiving therapeutic regimens compared with nonbiomarker-enriched trials (rate ratio = 4.49, 95% CI = 1.53 to 13.23; P = .006). Additionally, patients receiving combination therapy are less likely to receive a therapeutic regimen compared with patients receiving monotherapy (rate ratio = 0.09, 95% CI = 0.01 to 0.68; P = .02), and patients enrolled in a trial testing for single indications had a higher proportion of therapeutic regimens than mixed indications (rate ratio = 3.32, 95% CI = 1.21 to 9.15; P = .02). Other subgroups, including novel vs previously approved drugs, were not statistically significantly different at the 95% level.
Patient characteristics and multivariable predictors of therapeutic proportion
| Variable | Total No. of patients (proportion of total, %) | No. of therapeutic patients (therapeutic proportion, %) | Rate ratio (95% CI) |
|---|---|---|---|
| Trial start year | |||
| 2005 | 3676 (11.3) | 107 (2.9) | 1 (Referent) |
| 2006 | 5269 (16.2) | 41 (0.8) | 0.21 (0.05 to 0.84) |
| 2007 | 5196 (15.9) | 19 (0.4) | 0.10 (0.02 to 0.67) |
| 2008 | 4529 (13.9) | 98 (2.2) | 0.58 (0.13 to 2.6) |
| 2009 | 5740 (17.6) | 45 (0.8) | 0.26 (0.05 to 1.3) |
| 2010 | 8172 (25.1) | 76 (0.9) | 0.28 (0.04 to 1.8) |
| Sponsorship | |||
| Nonindustry | 12 509 (38.4) | 87 (0.7) | 1 (Referent) |
| Industry | 20 073 (61.6) | 299 (1.5) | 2.92 (0.72 to 12.14) |
| No. of drugs | |||
| Monotherapy: 1 drug | 16 845 (51.7) | 311 (1.8) | 1 (Referent) |
| Combination: ≥2 drugs | 15 737 (48.3) | 75 (0.5) | 0.09 (0.01 to 0.68) |
| Approval status | |||
| Previously approved | 16 542 (50.8) | 142 (0.9) | 1 (Referent) |
| Novel treatment | 16 040 (49.2) | 244 (1.5) | 3.18 (0.63 to 16.00) |
| Biomarker enrichment | |||
| No | 29 482 (90.5) | 282 (1.0) | 1 (Referent) |
| Yes | 3100 (9.5) | 104 (3.4) | 4.49 (1.53 to 13.23) |
| Cancer indication | |||
| Hematological | 5797 (17.8) | 108 (1.9) | 1 (Referent) |
| Solid tumor | 26 785 (82.2) | 278 (1.1) | 0.82 (0.30 to 2.29) |
| Drug class | |||
| Cytotoxic | 5270 (16.2) | 100 (1.9) | 1 (Referent) |
| Targeted | 22 116 (67.9) | 215 (1.0) | 0.48 (0.13 to 2.44) |
| Immunotherapy | 3661(11.2) | 24 (0.7) | 0.56 (0.02 to 1.78) |
| Other | 1535 (4.7) | 47 (3.1) | 1.00 (0.09 to 10.83) |
| No. of indications tested | |||
| Mixed: ≥2 tested | 17 413 (53.4) | 105 (0.6) | 1 (Referent) |
| Single: 1 tested | 15 169 (46.6) | 281 (1.9) | 3.32 (1.2 to 9.1) |
As a sensitivity analysis to allow for even greater follow time for FDA approval, we reperformed our analysis using the 267 trials for which we had 12 years of follow-up. The proportion of patients receiving therapeutic regimens was 1.4% (129 of 8945).
The proportion of patients who received a treatment considered by the NCCN guidelines as therapeutic was 3.6% (1168 of 32 582). All guideline recommendations had an evidence level of at least 2B (lower-level evidence but with NCCN consensus that treatment intervention was appropriate), with the most common treatment having an evidence level of 2A (lower-level evidence with uniform NCCN consensus). Disregarding dosage, 4.6% (1507 of 32 582) of patients received a drug for their indication that was recommended in NCCN guidelines, and 12.2% (3979 of 32 582) received a treatment recommended in NCCN guidelines for any disease and regardless of dosage. All FDA-approved treatments were incorporated into NCCN guidelines. Figure 2 represents proportions of patients that received treatments with matching dose, matching indication, and approval.
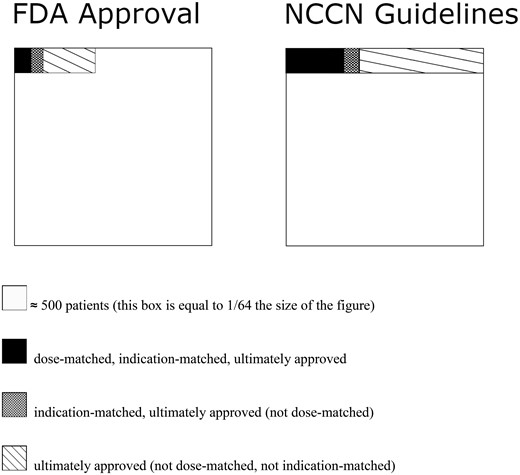
Patient proportions of matching dose, matching indication, and approval. Nested proportional area chart for different patient proportions. FDA = Food and Drug Administration; NCCN = National Comprehensive Cancer Network.
Discussion
Our study found that for every 83 patients who enrolled in phase I trials, 1 patient received a drug at a similar dosage that ultimately received FDA approval. (Using the standard of NCCN guideline recommendations, which are much more permissive with respect to level of evidence, the figure is 1 in 28 patients.) Number needed to treat (NNT) values for typical approved anticancer drugs vary depending on the drug and cancer indication. Cisplatin, a cytotoxic chemotherapy, was shown to have an NNT of 15 in the treatment of non-small cell lung cancer (22). Trastuzumab, a targeted therapy, has an NNT of 7 to treat HER2+ breast cancer (23). Nivolumab, an immunotherapy drug used to treat melanoma, has an NNT of 3.9 (24). On the assumption that NNTs for approved cancer drugs can be combined with proportions described above, between approximately 350 and 1350 patients need to participate in phase I cancer trials to have 1 positive outcome. The therapeutic justification of these proportions should be considered against rates of serious adverse events associated with phase I trial participation, estimated between 10% and 19% (6,7,25) .We did not observe clear relationships between proportions and sponsorship, approval status, drug class, and general cancer indication. Trials testing monotherapy drugs, single cancer indications, and with biomarker enrichment showed a higher therapeutic proportion. Indeed, our results support previous data that trials with biomarker enrichment are more likely to be positive and thus more beneficial to patients who enroll in them (26,27).
Our approach to estimating the therapeutic value of phase I cancer trial participation has advantages over other methods that have been used in the past. First, we did not impute clinical benefit based on surrogate measures of benefit. Second, our approach establishes a therapeutic definition by benchmarking to expressed social standards judgments like FDA approval and NCCN guideline recommendations. Third, by using ClinicalTrials.gov rather than the published literature, our approach is less susceptible than meta-analysis to being biased because of selective publication. Fourth, the concept of “therapy” implies a prospective judgment—namely, that patients will derive greater benefit than burden by receiving an intervention. However, even effective “therapies” do not work in all patients. As such, a better way of measuring the therapeutic value of participating in phase I trials is determining the proportion of patients who receive treatments that are ultimately deemed to have a therapeutic risk-benefit balance. One important proviso about our method (and indeed, other methods used historically to measure benefit in phase I cancer trials) is that it does not capture collateral benefits to study participation, such as reduced anxiety or the benefits resulting from greater medical attention.
Our findings should be interpreted in light of the following limitations. First, some drugs may require more than 8 years (ie, end of 2010 to 2019) maturing into FDA-approved treatments. However, more than 70% of approved drugs were approved within 8 years and 95% were approved within 12 years (see Supplementary Figure 2, available online). Moreover, our sensitivity analysis showed that the therapeutic proportion of trials with follow-up time of 12 years was 1.4%, which did not differ greatly from the overall therapeutic proportion of all trials. Our estimate that 7.8% of novel drugs tested in phase I trials receive FDA approval is consistent with other reports in the literature (28). Second, our analytic approach assumes that receiving a drug regimen that does not go on to receive FDA approval is nontherapeutic. However, some patients benefit in trials that lead to null pivotal results, and there may have been exceptional responders among patients receiving nontherapeutic regimens. Nevertheless, we think this limitation is balanced by the fact that not every patient receiving an approved cancer drug as per its label has a therapeutic response. Though our most strict definition of therapy according to FDA approval yields a proportion of 1.2%, we also provide a proportion when cancer indication is dropped as a requirement (4.9%). Additionally, 3.6% of patients received an intervention deemed appropriate by NCCN guidelines. Third, our sampling frame used a large patient enrollment cutoff—200 patients—to exclude seamless phase I trials. This may have led to a slight overestimate of therapeutic proportions; 28 of the 1000 trials in our sample (10.0% of patients captured in our sample) were enrolled in trials with sample sizes between 100 and 200 patients. Finally, given the length of maturation periods, an intrinsic challenge of any study of drug development is that it has to rely on historic cohorts (in our case, drug development trajectories that were launched 8-14 years ago). It is possible that proportions will have changed with the emergence of new drug classes or new study designs. Nevertheless, we did not observe striking trends over time. Nor did newer drug classes, like immunotherapies, show dramatic differences in therapeutic proportions. Although model-based designs of phase I trials have been promoted as a means of reducing the number of patients receiving subtherapeutic doses (29–31), uptake of these designs has been slow. Reviews of trials between 2000 and 2010 (32) and between 2012 and 2014 (33) showed that 7% and 6% of trials used a model-based approach, respectively. It seems unlikely that the prevalence of designs has changed dramatically since.
Our findings have implications for priority setting in phase I trials. In line with what others have suggested (26,34), trials enrolling on the basis of biomarker eligibility are more likely to result in therapeutic interventions. The same was true for trials testing monotherapies or enrolling patients with a single indication. Together, these suggest that when trials are launched based on more precise hypotheses from prior research, they have a greater prospect of benefiting patients. Such studies should be given greater priority when funding phase I research. Our findings also have implications for discussion of risk and direct benefit during informed consent and risk-benefit assessment during ethical review. For example, our findings call into question perceptions that receiving already approved drugs in phase I trials is associated with greater benefit than receiving drugs that are not yet approved. Also, by estimating the proportion of patients in phase I trials who access a drug that will be approved for their conditions, our study provides a basis for communicating risk and benefit to patients in phase I research. Our result can also be interpreted as an estimate of the productivity of the clinical trial enterprise at the phase I level; if the predictive value of preclinical models is tapped more effectively in the future, therapeutic proportions in phase I will likely increase.
Subject to the methodological provisos described above, our findings help inform ongoing debates about whether phase I trial participation should be presented to patients as a therapeutic option. Many commentators (8,34), including the American Society of Clinical Oncology (2), view phase I trial enrollment as presenting a therapeutic option for patients who meet eligibility criteria. Others, including the present authors, have questioned this view (35–37). In 2016, we posited that the therapeutic position might be plausible if patients had a 1-in-10 chance of receiving therapeutic regimens on entering phase I trials (36). The present estimate falls considerably below this figure, even for studies involving biomarker enrichment. Whereas some commentators have suggested trends in cancer drug development might have dramatically improved risk-benefit for phase I trial participation (34), we did not detect a clear time trend for benefit. Nor were we able to show more favorable therapeutic proportions for immune or targeted therapies. We nevertheless acknowledge others (including patients) may be willing to countenance the burdens of phase I trial participation for an approximately 1-in-100 chance of receiving an agent that will ultimately be vindicated for their disorder.
All but a few experimental therapies in phase I cancer trials are ultimately deemed therapeutic for the patients who participate in such trials. This underscores that early phase trials are best understood not as an opportunity for accessing novel therapies, but rather as a tool for eliminating unpromising treatments before they are committed to later phase trials.
Funding
This work was supported by the Canadian Institutes of Health Research.
Notes
Role of the funder: The funder had no role in the design of the study; the collection, analysis, and interpretation of the data; the writing of the manuscript; and the decision to submit the manuscript for publication.
Conflict of interest: Authors declare they have no other competing interests.
Disclosure: JK declares he serves on a DSMB for Ultragenyx, which conducts phase I noncancer trials.
References
NCCN clinical practice guidelines in oncology.
World Medical Association Declaration of Helsinki. Ethical principles for medical research involving human subjects.
TCPS 2 : The Interagency Advisory Panel on Research Ethics (PRE).
A to Z list of cancer types. National Cancer Institute website.

