


Abstract
Neuroblastoma is a childhood malignancy that arises from the developing sympathetic nervous system. Although mitochondrial dysfunctions have been implicated in the pathophysiology of neuroblastoma, the role of mitochondrial DNA (mtDNA) has not been extensively investigated.
A total of 2404 Caucasian children diagnosed with neuroblastoma and 9310 ancestry-matched controls were recruited at the Children’s Hospital of Philadelphia. The mtDNA haplogroups were identified from SNP array data of two independent cohorts. We conducted a case-control study to explore potential associations of mtDNA haplogroups with the susceptibility of neuroblastoma. The genetic effect of neuroblastoma was measured by odds ratios (ORs) of mitochondrial haplogroups. All tests were two-sided.
Haplogroup K was statistically significantly associated with reduced risk of neuroblastoma in the discovery cohort consisting of 1474 cases and 5699 controls (OR = 0.72, 95% confidence interval [CI] = 0.57 to 0.90; P = 4.8 × 10⁻³). The association was replicated in an independent cohort (OR = 0.69, 95% CI = 0.53 to 0.92; P = .01) of 930 cases and 3611 controls. Pooled analysis was performed by combining the two data sets. The association remained highly statistically significant after correction for multiple testing (OR = 0.71, 95% CI = 0.59 to 0.84, P = 1.96 × 10⁻⁴, Pcorrected = .002). Further analysis focusing on neuroblastoma subtypes indicated haplogroup K was more associated with high-risk neuroblastoma (OR = 0.57, 95% CI = 0.43 to 0.76; P = 1.46 × 10⁻⁴) than low-risk and intermediate-risk neuroblastoma.
Haplogroup K is an independent genetic factor associated with reduced risk of developing neuroblastoma in European descents. These findings provide new insights into the genetic basis of neuroblastoma, implicating mitochondrial DNA encoded proteins in the etiology of neuroblastoma.
Neuroblastoma is the most common extracranial solid tumor derived from the developing sympathetic nervous system in children. It remains among the most lethal childhood cancers and accounts for approximately 12% of all pediatric oncology deaths (1). About half of all individuals affected with neuroblastoma have disease dissemination at diagnosis, with poor outcome from therapy (1,2). Indeed, the cure rate for these high-risk patients is still less than 50% despite aggressive multimodal therapy including intensive chemotherapy, surgery, and radiation therapy (1,2).
Intensive efforts have been made to understand the genetic basis of neuroblastoma through genome-wide association studies (GWAS) and whole genome and exome sequencing studies (3–12). Multiple predisposition genes have been identified from nuclear DNA, indicating a polygenic model of inheritance (3–9,12). However, currently reported genetic risk factors of neuroblastoma explain only a small fraction of the heritability (12), suggesting that other genetic variants remain to be discovered.
Mitochondria are cellular organelles participating in bioenergetic metabolism and producing adenosine triphosphate through oxidative phosphorylation. Disregulation in oxidative phosphorylation has been reported in cancer cells including neuroblastoma, suggesting mitochondrial dysfunction plays a role in neuroblastoma tumorigenesis (13–15). Whereas mitochondrial DNA (mtDNA) defects have been reported in multiple cancers (16,17), the role of mtDNA variation in neuroblastoma is unclear, which could contribute to the “missing heritability” of this disease.
The human mitochondrial genome sequentially accumulates genetic variants through maternal inheritance. As a result of ancient migrations of human populations, mtDNA variants have segregated and clustered into regional groups of related mtDNA haplotypes, called haplogroups (18). These haplogroups vary in frequencies across continents and exhibit diverse metabolic capacities. For instance, most Europeans belong to one of nine major haplogroups: H, J, T, U, K, I, V, W, and X (18).
The objective of this study was to determine whether mtDNA haplogroups confer risk of neuroblastoma in European Americans. We first evaluated associations between major mtDNA haplogroups and neuroblastoma risk in two independent European populations and further investigated associations between major mtDNA haplogroups and three subtypes of neuroblastoma classified by risk levels. We also studied transcriptome changes between risk and nonrisk mtDNA haplogroups.
Methods
Participants
The 2404 neuroblastoma patients in the study were self-reported Caucasian individuals diagnosed with neuroblastoma or ganglioneuroblastoma registered through the Children’s Oncology Group (COG). The blood samples were obtained through the COG neuroblastoma biorepository for specimen collection at the time of diagnosis. The majority of specimens were annotated with clinical and genomic information containing age at diagnosis, site of origin, International Neuroblastoma Staging System disease stage (19), and International Neuroblastoma Pathology Classification (20).
The 9310 control subjects were recruited by the Center for Applied Genomics through the Children’s Hospital of Philadelphia (CHOP) Health Care Network, including four primary care clinics and several group practices and outpatient practices that included well-child visits. Eligibility criteria for control subjects were self-reporting as Caucasian and no serious underlying medical disorder, including cancer. This study was approved by the Research Ethics Board of CHOP. Written informed consent was obtained from all subjects by nursing and medical assistant study staff under the direction of CHOP clinicians. The same control selection criteria were applied as reported in our previous GWAS of neuroblastoma (5,7,8), and a subset of controls in this study was also used in previous studies (5,7,8).
Genotyping and Haplogroup Assignment
The blood DNA samples from discovery (1474 cases and 5699 controls of European descent) and replication (930 cases and 3611 controls of European descent) cohorts were genotyped at the Center for Applied Genomics, using the Illumina (San Diego, CA, USA) HumanHap550 and HumanHap610 SNP arrays, respectively. A total of 163 mtDNA single nucleotide variants (SNVs) interrogated by the HumanHap550 array were used in the discovery analysis. Among those, 138 mtDNA SNV markers are present in the HumanHap610 array and were used in the replication analysis. Because the design of mtDNA markers on the Illumina array were based on the AF347015.1 mitochondrial reference genome, genomic coordinates of mtDNA variants were mapped to the revised Cambridge Reference Sequence (GenBank NC012920). The mtDNA haplogroups were determined by HaploGrep 2 (21).
To evaluate the accuracy and specificity of mtDNA haplogroup prediction using the 163 and 138 mtDNA SNVs, 11 240 mitochondrial reference genomes with known haplogroups were downloaded from GenBank. We next extracted the 163 and 138 SNVs from downloaded reference genomes, respectively, and used HaploGrep 2 to infer the proper haplogroups. Haplogroups A, I, J, K, L, T, W, X, and Y were predicted with high accuracy (Supplementary Table 1, available online). Minor ambiguities were observed in predicting evolutionary related haplogroups (Supplementary Table 1, available online). Those ambiguous haplogroups were clustered into four super-haplogroups: HHV (B, F, H, HV, P, R, and V); M (C, D, E, G, Q, Z, and M); NS (N and S); and OX (O and X). The sensitivity and specificity of the prediction results using 163 and 138 SNVs are provided in Supplementary Table 1 (available online). Haplogroups I, J, K, L, T, W, OX, and HHV, which are primarily present in European populations, were analyzed.
Statistical Analysis
The statistical analysis was performed in R version 3.5.1. A logistic regression model was used to examine the associations of interested haplogroups adjusting for covariates. In genetic case-control studies, spurious associations may occur if the ancestry distributions differ between cases and controls. This issue is called population stratification. To correct the potential bias from population stratification, we applied the EIGENSTRAT method to our data, which has been widely used in GWAS. EIGENSTRAT uses principal component analysis to achieve explicit detection and correction of population stratification (22). The first 20 principal components (PCs) were calculated by EIGENSTRAT. Informative PCs determined by Scree plot were included as covariates to adjust for population stratification (Supplementary Figure 1, available online) (23,24). Gender was also included as a covariate to control for differences between the two sexes. The pooled analysis was performed by combining the discovery and replication data. SNP array versions were included as an additional covariate to control for genotyping platform differences in the pooled analysis. Bonferroni correction was used for correction of multiple testing by the number of tested haplogroups. A corrected two-sided P by Bonferroni correction less than .05 was considered statistically significant. To remove cryptic relatedness between samples, the identity-by-descent scores were calculated using PLINK (25). One individual in the pairs of subjects was excluded with identity-by-descent greater than 0.25. Participants with European ancestry were strictly selected by comparing principal component analysis results of participants and four reference European populations from 1000 Genome (Supplementary Figure 2, available online). Event-free survival and overall survival were analyzed by the KaplanMeier method, and survival curves were compared using the log-rank test. The Cox regression model (Cox proportional hazards model) was used to estimate hazard ratios for death associated with haplogroup K, after adjustment for gender and the first four PCs (Supplementary Figure 1, available online). A plot of the logarithm of the cumulative hazard rates by haplogroup vs time was used as an example of a graphical technique to check proportionality of the hazards assumption. The corresponding curves should be approximately parallel to each other if the assumption is satisfied. Patients with missing clinical information were excluded in the survival analysis. All tests were two-sided.
RNA Sequencing Analysis
Among the 2404 Caucasian children diagnosed with neuroblastoma, a total of 99 tumor DNA samples were available for the RNA sequencing (RNAseq) analysis. After excluding 14 neuroblastoma at low risk or stage 4S, we included 85 samples in this study. All tumor samples were from biopsy or resection of the primary tumor at the time of original diagnosis. More details of the tumor samples have been described in our previous publication (11). RNAseq fastq files were mapped to the hg38 human genome reference using STAR aligner v2.5.2b (26). Differential expression analysis was performed using the edgeR package in R (27). Gene functional enrichment analysis was performed by DAVID (http://david.abcc.ncifcrf.gov/) in gene sets with gene ontology (GO) terms compared with the background list of all genes (28).
GPD1 and CMPK2 Overexpression
GPD1 and CMPK2 were overexpressed in neuroblastoma cell line SH-SY5Y. A more detailed description is provided in the Supplementary Materials and Methods (available online).
Results
Our initial discovery cohort included 1474 European-American patients diagnosed with neuroblastoma and 5699 ancestry matched controls recruited at CHOP (Supplementary Figure 2, available online). A total of eight haplogroups—I, J, K, L, T, W, OX, and HHV—were analyzed. More than 97% of subjects in the discovery cohort belonged to the eight haplogroups, and the HHV haplogroup encompassed about 50% of individuals of the discovery cohort, which is consistent with previous mtDNA studies of European populations (29,30). The frequency of haplogroup K was statistically significantly lower in neuroblastoma patients than controls (odds ratio [OR] = 0.72, 95% confidence interval [CI] = 0.57 to 0.90; P = 4.8 × 10⁻³, Pcorrected = .04) at the .05 Bonferroni correction statistical significance level (Table 1). No statistically significant difference between cases and controls was observed in the other tested haplogroups.
Logistic regression analysis of mitochondrial haplogroups associated with neuroblastoma
| Study | Haplogroups | No. (%) of patients* | No. (%) of controls* | OR (95% CI)† | P‡ | Pcorrected§ |
|---|---|---|---|---|---|---|
| Discovery | OX | 31 (2.1) | 85 (1.5) | 1.42 (0.94 to 2.15) | .08 | .64 |
| W | 15 (1.0) | 86 (1.5) | 0.67 (0.39 to 1.16) | .14 | 1.00 | |
| K | 99 (6.7) | 520 (9.1) | 0.72 (0.57 to 0.9) | 4.8 x 10⁻³ | .04 | |
| U | 202 (13.7) | 833 (14.6) | 0.93 (0.79 to 1.09) | .63 | 1.00 | |
| J | 135 (9.2) | 526 (9.2) | 0.99 (0.81 to 1.21) | .97 | 1.00 | |
| T | 170 (11.5) | 549 (9.6) | 1.22 (1.02 to 1.47) | .04 | .28 | |
| I | 44 (3.0) | 185 (3.3) | 0.92 (0.66 to 1.28) | .44 | 1.00 | |
| HHV | 737 (50.0) | 2767 (48.6) | 1.07 (0.95 to 1.20) | .49 | 1.00 | |
| Replication | OX | 13 (1.4) | 53 (1.5) | 0.95 (0.52 to 1.75) | .96 | 1.00 |
| W | 9 (1.0) | 48 (1.3) | 0.73 (0.35 to 1.48) | .30 | 1.00 | |
| K | 63 (6.8) | 342 (9.5) | 0.69 (0.53 to 0.92) | .01 | .11 | |
| U | 116 (12.5) | 540 (15.0) | 0.81 (0.65 to 1.00) | .10 | .76 | |
| J | 87 (9.4) | 348 (9.6) | 0.97 (0.76 to 1.24) | .49 | 1.00 | |
| T | 93 (10.0) | 359 (9.9) | 1.01 (0.79 to 1.28) | .94 | 1.00 | |
| I | 24 (2.6) | 110 (3.1) | 0.84 (0.54 to 1.32) | .60 | 1.00 | |
| HHV | 491 (52.8) | 1742 (48.2) | 1.20 (1.04 to 1.39) | .04 | .30 | |
| Pooled analysis‖ | OX | 44 (1.8) | 138 (1.5) | 1.24 (0.88 to 1.75) | .20 | 1.00 |
| W | 24 (1.0) | 134 (1.4) | 0.69 (0.45 to 1.07) | .09 | .68 | |
| K | 162 (6.7) | 862 (9.3) | 0.71 (0.59 to 0.84) | 1.96 x 10⁻⁴ | .002 | |
| U | 318 (13.2) | 1373 (14.8) | 0.88 (0.77 to 1.00) | .14 | 1.00 | |
| J | 222 (9.2) | 874 (9.4) | 0.98 (0.84 to 1.15) | .67 | 1.00 | |
| T | 263 (10.9) | 908 (9.8) | 1.14 (0.98 to 1.31) | .07 | .55 | |
| I | 68 (2.8) | 295 (3.2) | 0.89 (0.68 to 1.16) | .44 | 1.00 | |
| HHV | 1228 (51.1) | 4509 (48.4) | 1.11 (1.02 to 1.22) | .05 | .44 |
Counts and percentages of tested haplogroups are No. (%) in patients and controls. CI = confidence intervals; OR = odds ratio.
Reference group for OR calculation. For a specific haplogroup, the control subjects with this haplogroup were chosen as the reference group.
Two-sided P value of logistic regression analysis.
Corrected two-sided P value of logistic regression analysis adjusted with Bonferroni correction when eight haplogroups were studied.
Pooled analysis of the discovery and the replication datasets.
The association between the eight haplogroups and neuroblastoma was further assessed in an independent replication cohort comprised of 930 cases and 3611 controls. Haplogroup K was also statistically significantly underrepresented in the cases compared with controls (OR = 0.69, 95% CI = 0.53 to 0.92; P = .01; Table 1). Pooled analysis combining the data from the two studies yielded a P value that extends well beyond the statistical significance threshold after adjustment for multiple testing (OR = 0.71, 95% CI = 0.59 to 0.84; P = 1.96 × 10⁻⁴, Pcorrected = .002; Table 1). We next tested haplogroups for association with genotypes at seven known neuroblastoma susceptibility loci identified from our previous GWAS (3,4,7,8,31) and detected that the allele frequency of rs9295536 at 6p22 (CASC15) was statistically significantly different between patients with and without haplogroup T (P = .006, Pcorrected = .04; Supplementary Table 2, available online).
To examine if haplogroup K is associated with a particular subtype of neuroblastoma, patients were further classified into low-, intermediate-, and high-risk groups based on COG criteria (32), and each of three risk groups was tested against controls. The association between haplogroup K and high-risk neuroblastoma was statistically significant in both discovery and replication samples (Table 2). This association was further confirmed by a pooled analysis of the two datasets (OR = 0.57, 95% CI = 0.43 to 0.76; P = 1.46 × 10⁻⁴; Table 2). Our analysis also identified a statistically significant association between K and low-risk neuroblastoma (Table 2), whereas an association test between K and intermediate-risk neuroblastoma failed to yield a statistically significant result (Table 2). We further compared the event-free survival and overall survival of high-, intermediate-, and low-risk neuroblastoma patients with and without haplogroup K by survival analysis. The log-rank test of survival curves indicates no statistically significant difference in survival between patients with and without haplogroup K in the three risk groups of neuroblastoma at current sample sizes (Supplementary Figure 3 and Supplementary Table 3, available online).
Logistic regression analysis of mitochondrial haplogroup K associated with neuroblastoma in three risk groups
| Study | Risk | No. of patients | No. of patients with haplogroup K | % haplogroup K in risk group | OR (95% CI)* | P† |
|---|---|---|---|---|---|---|
| Discovery | High | 604 | 34 | 5.6 | 0.60 (0.42 to 0.87) | 8.62 x 10⁻³ |
| Intermediate | 249 | 19 | 7.6 | 0.84 (0.51 to 1.37) | .49 | |
| Low | 512 | 31 | 6.1 | 0.66 (0.45 to 0.96) | .03 | |
| Replication | High | 390 | 22 | 5.6 | 0.57 (0.37 to 0.89) | .02 |
| Intermediate | 209 | 16 | 7.7 | 0.79 (0.47 to 1.34) | .44 | |
| Low | 278 | 18 | 6.5 | 0.66 (0.41 to 1.08) | .13 | |
| Pooled analysis‡ | High | 994 | 56 | 5.6 | 0.57 (0.43 to 0.76) | 1.46 x 10⁻⁴ |
| Intermediate | 458 | 35 | 7.6 | 0.79 (0.56 to 1.13) | .21 | |
| Low | 790 | 49 | 6.2 | 0.65 (0.48 to 0.88) | 4.40 x 10⁻³ |
Reference group for OR calculation. For a specific haplogroup, the control subjects with this haplogroup were chosen as the reference group. CI = confidence intervals; OR = odds ratio.
Two-sided P value of logistic regression analysis.
Pooled analysis of the discovery and the replication datasets.
To analyze the impact of mtDNA haplogroups on gene regulation in neuroblastoma, transcriptome profiles of 85 neuroblastoma primary tumors including five samples of haplogroup K were analyzed by RNAseq. Differential expression analysis was performed on five haplogroup K tumors against 80 nonhaplogroup K tumors. Our analysis identified 11 statistically significant (false discovery rate adjusted P < .05; Supplementary Table 4, available online) differentially expressed genes (DEGs) including genes participating in mitochondrial pathways, including GPD1 and CMPK2. Because neither GPD1 nor CMPK2 is expressed at appreciable levels (mRNA) across the 40 neuroblastoma cell lines (https://doi.org/10.6084/m9.figshare.11708331.v1), GPD1 and CMPK2 were overexpressed in neuroblastoma cell line SH-SY5Y (Figure 1) to investigate their potential functional relevance in neuroblastoma. High transient expressions of both genes at 24 and 48 hours posttransfection were accomplished as compared with controls. Overexpression was also confirmed on both the RNA and protein level (Figure 1, A and D). Cell proliferation was statistically significantly increased (P < .0001) in SH-SY5Y cells overexpressing GPD1 and CMPK2 in comparison with control cells (Figure 1E), when measured 48 hours posttransfection. We also evaluated autophagy in SH-SY5Y cells expressing different levels of GPD1 and CMPK2. The 24 hour-posttransfection SH-SY5Y cells were serum starved for 4 hours in the presence or absence of 100 µM bafilomycin A1, collected and immunoblotted for FLAG-fusion proteins, actin and LC3B. Starvation induced LC3 processing compared to growth in regular medium. Treatment with bafilomycin A1 increased the amount of processed LC3B-II detected, indicating that SH-SY5Y cells have a high basal rate of autophagy that is further increased by starvation (Figure 1F). However, we did not detect statistically significant differences between CMPK2- or GPD1-overexpressing cells and controls. Gene functional enrichment analysis was further performed on 618 DEGs (with P < .05, notwithstanding false discovery rate adjustments) to determine the altered gene pathways between K and non-K haplogroup tumors. Interestingly, upregulated genes are statistically significantly enriched in immune system process (GO: 0002376) and T-cell activation (GO: 0042110) pathways, whereas downregulated genes are enriched in neurogenesis (GO: 00220088) and nervous system development (GO: 007399) pathways in K haplogroup neuroblastoma when compared with non-K haplogroup neuroblastoma (Table 3). We further tested the association between haplogroup K and genotyped SNP markers from the human leukocyte antigen (HLA) region (chr6:27000000–chr6:33000000) in cases. No HLA genotype was found to be statistically significantly associated with haplogroup K (Supplementary Table 5, available online).
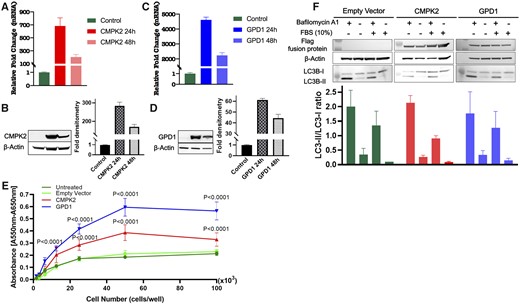
Overexpression of GPD1 or CMPK2 in SH-SY5Y neuroblastoma cells. All graphs denote mean values, and error bars represent the standard deviation (SD). Data were analyzed using unpaired Student t test or factorial analysis of variance (ANOVA) as applicable using Prism 7 (GraphPad Software, Inc, San Diego, CA, USA). Multiple sets of data were compared using a two-sided ANOVA Tukey multiple comparison test where appropriate. A) CMPK2 expression was assessed in SH-SY5Y cells by real-time polymerase chain reaction and (B) Western blot analysis 24 and 48 hours posttransfection. (C) GPD1 expression was assessed in SH-SY5Y cells by real-time polymerase chain reaction and (D) Western blot analysis 24 and 48 hours posttransfection. β-Actin was used as an internal control in analyses. All results are representative of three independent experiments. (E) Overexpression of CMPK2 or GPD1 in SH-SY5Y cells accelerates proliferation. P < .0001 compared with control cells when performing two-sided ANOVA with Tukey multiple comparisons test. (F) Upper panel: 24 hours posttransfection SH-SY5Y cells were serum starved for 4 hours in the presence or absence of 100 µM bafilomycin A1 (as indicated) and immunoblotted for FLAG-fusion protein, β-actin and LC3. Lower panel: Autophagy induction was quantified by the ratio of band intensities of LC3-II/LC3-I. LC3 quantification was done in SH-SY5Y cells transfected with control pCDNA3.1-FLAG (empty vector), pCDNA3.1-FLAG-CMPK2 (CMPK2), or pCDNA3.1-FLAG-GPD1 (GPD1) plasmids. Results are representative of two independent experiments.
Gene functional enrichment analysis of nominal DEGs between K and non-K haplogroup neuroblastoma
| Expression | Term | Fold enrichment | P* | Pcorrected† |
|---|---|---|---|---|
| Upregulation | GO: 0042110∼T-cell activation | 5.66 | 9.64 x 10⁻¹¹ | 3.14 x 10⁻⁷ |
| GO: 0046649∼lymphocyte activation | 4.61 | 1.29 x 10⁻¹⁰ | 4.19 x 10⁻⁷ | |
| GO: 0045321∼leukocyte activation | 4.11 | 6.53 x 10⁻¹⁰ | 2.13 x 10⁻⁶ | |
| GO: 0001775∼cell activation | 3.62 | 2.53 x 10⁻⁹ | 8.24 x 10⁻⁶ | |
| GO: 0002682∼regulation of immune system process | 2.79 | 5.55 x 10⁻⁸ | 1.81 x 10⁻⁴ | |
| GO: 0007155∼cell adhesion | 2.52 | 1.01 x 10⁻⁷ | 3.29 x 10⁻⁴ | |
| GO: 0002376∼immune system process | 2.14 | 2.54 x 10⁻⁷ | 8.28 x 10⁻⁴ | |
| GO: 0042101∼T-cell receptor complex | 34.67 | 6.01 x 10⁻⁷ | 2.10 x 10⁻⁴ | |
| GO: 0006639∼acylglycerol metabolic process | 9.30 | 1.24 x 10⁻⁶ | 4.04 x 10⁻³ | |
| GO: 0006638∼neutral lipid metabolic process | 9.22 | 1.33 x 10⁻⁶ | 4.34 x 10⁻³ | |
| Downregulation | GO: 0099536∼synaptic signaling | 3.49 | 3.18 x 10⁻⁸ | 1.10 x 10⁻⁴ |
| GO: 0007399∼nervous system development | 2.01 | 1.90 x 10⁻⁷ | 6.58 x 10⁻⁴ | |
| GO: 0022008∼neurogenesis | 2.24 | 9.26 x 10⁻⁷ | 3.20 x 10⁻³ | |
| GO: 0045202∼synapse | 2.84 | 2.01 x 10⁻⁶ | 9.10 x 10⁻⁴ | |
| GO: 0048699∼generation of neurons | 2.22 | 3.10 x 10⁻⁶ | 1.07 x 10⁻² |
Two-sided P value of Fisher exact test for gene enrichment analysis, which was calculated by DAVID.28 DEG = differentially expressed genes.
Corrected P value of Fisher exact test for gene enrichment analysis, which was adjusted with Bonferroni correction based on tested gene ontology (GO) terms and calculated by DAVID.28
Discussion
This study identified a statistically significant association of haplogroup K in patients of European descent with reduced risk of neuroblastoma. Our findings support the concept that genetic variation of mtDNA is implicated in the pathogenesis of neuroblastoma.
Recent genetic advances in neuroblastoma have detected a number of genetic risk variations from nuclear DNA (5,10–12). Also, cumulative evidence indicates a role of altered mitochondrial energy metabolism in neuroblastoma (14,33,34). Thus, mtDNA variation may account for the changes of mitochondrial function and be involved in the genetics of the development of neuroblastoma. Although mtDNA haplogroups have been identified as risk factors for multiple cancers (16,17,35), to our knowledge, the association between haplogroups and neuroblastoma risk has not been extensively investigated before.
We performed a case-control study in two cohorts, which have been described in previous GWAS of neuroblastoma (5,7,8). Susceptibility gene loci have been successfully discovered from those cohorts and further validated by functional studies, indicating that cases and controls were appropriately selected for association studies (3–9). In addition, the frequency of mtDNA haplogroups in the controls was consistent with estimates from general European populations (30,36). To address the potential influence of population stratification, European subjects were strictly selected based on their genetic ancestry inferred from genotyping array data, and the first 10 PCs were used to adjust association results. The detected associated haplogroup was supported in two independent cohorts, providing convincing evidence for this discovery. Previous GWAS of neuroblastoma reported that 6p22 (CASC15) and 2q35 (BARD1) loci display a trend toward an increased risk of high-risk groups compared with other risk groups (3,4). A similar association pattern was also observed in this haplogroup study on mtDNA; haplogroup K is more associated with high-risk groups than low-risk and intermediate-risk groups, suggesting haplogroup K is not only a genetic protective factor for neuroblastoma but also a predilection to protect against more aggressive forms of this disease. We also detected that the allele frequency of rs9295536 at 6p22 (CASC15) was statistically significantly different between patients with and without haplogroup T. We are seeking to further verify this association in an independent neuroblastoma data set and investigate the potential interaction between CASC15 and haplogroup T.
Multiple studies of mtDNA haplogroups have indicated that haplogroup K may serve as a genetic protective factor for neurological and neurodegenerative disorders in Europeans. Haplogroup K was found to be less frequent in patients with transient ischemic attack, ischemic stroke, Parkinson disease, and Alzheimer disease (29,30,37,38). Interestingly, a study of 1094 traumatic brain injury patients revealed haplogroup K was statistically significantly associated with favorable outcome (39). Associations between haplogroup K and cancers have also been described in the literature. A study of 235 cases and 419 controls reported a protective role of haplogroup K in thyroid cancer (16). Haplogroup K was also observed to be associated with reduced pancreatic cancer risk (17). The protective role of haplogroup K in cancers and neurological diseases could be partially explained by energy deficiency and/or less extent of harmful reactions. For example, multiple lines of evidence proposed an uncoupling effect of haplogroup K, which reduces adenosine triphosphate production and energy generation (40,41). Haplogroup K cybrids display lower inner mitochondrial membrane potential than haplogroup H, leading to reduced mitochondrial protein synthesis and cell growth (42). Because neuroblastoma develops from the developing sympathetic nervous system, variants of haplogroup K may influence neuroblastoma risk through mechanisms comparable to those previously shown to influence neurological diseases or other cancers.
We further applied RNAseq to study the potential mechanism underlying the effect of haplogroup K in neuroblastoma. A total of 11 statistically significant DEGs were detected, including multiple genes involved in mitochondrial function. For example, GPD1 encodes NAD-dependent glycerol-3-phosphate dehydrogenase 1, which plays a critical role in carbohydrate and lipid metabolism and facilitates the transfer of reducing equivalents from the cytosol to mitochondria. Products of CMPK2 may also participate in deoxyuridine triphosphate and deoxycytidine triphosphate synthesis in mitochondria. These results suggest the presence of different mitochondria-associated gene expression patterns between K and non-K haplogroups in neuroblastoma. Our functional studies further show that overexpression of either GPD1 or CMPK2 changes proliferation of SH-SY5Y neuroblastoma cells and suggest an impact of differentially expressed genes on neuroblastoma cell functions. Because there are only a small number of DEGs surpassing the multiple testing statistical significance, we next performed gene functional enrichment analysis based on 618 DEGs (with P < .05, notwithstanding false discovery rate adjustments) to investigate the potential changes in biological pathways. Our results indicated that both immune-response signaling and T-cell pathways are activated and involved in K haplogroup neuroblastoma. The immune system plays a primary role in the prevention of tumors (43). Accordingly, tumor cells develop different strategies to escape immune surveillance. Immune escape mechanisms adopted by neuroblastoma cells include impaired expression of the HLA class I–related antigen-processing machinery and secretion of immunosuppressive molecules (44,45). MYCN amplification, a poor prognostic factor of neuroblastoma, has also been reported to be involved in immune escape mechanisms and associated with repressed cellular immunity (46,47). In addition, recent accumulating evidence demonstrates that the function of immune cells is dictated by mitochondria (48–50). Therefore, variants of haplogroup K could participate in the interplay between mitochondrial metabolism and immune response and deliver a protective effect via activation of immune response against tumorigenesis. Our analysis also suggests that neurogenesis and nervous system development pathways are suppressed in K haplogroup neuroblastoma, which could also associate with the underlying mechanism of reduced risk, because neuroblastoma arises during sympathetic neurogenesis. Taken together, RNAseq analysis revealed distinct transcriptome profiles between K and non-K haplogroup neuroblastoma, which might contribute to a reduced risk of neuroblastoma. Further studies are required to explicitly demonstrate the underlying mechanism of action for haplogroups K in neuroblastoma.
This study has limitations. First, the mtDNA haplogroups were deduced from genotyping arrays. It is still unclear which precise genetic variants are causal in neuroblastoma. This limitation can be solved in future studies by sequencing the whole mtDNA genome in a large sample of neuroblastoma subjects. Second, the two study cohorts, although recruited from multiple clinical centers, were genotyped at the same location, and it is possible that potential unknown confounding factors might have influenced the results. Third, the number of patients with the haplogroups OX and W was relatively low, which perhaps precludes a robust and final statistical conclusion concerning these haplogroups at the present time.
This study identified the association between mtDNA haplogroup K and reduced risk of neuroblastoma, providing new insights into the genetic basis of neuroblastoma. The interesting finding of the association of mitochondrial haplotype K with immune regulation signatures warrants further study on tumor-infiltrating T cells in neuroblastoma tissue samples. A better understanding of the role of mitochondria in the pathogenesis of neuroblastoma might lead to new methods for the prevention and treatment of this disease.
Funding
The study was supported by Institutional Development Funds from the Children’s Hospital of Philadelphia (HH) and by NIH grants U01HG006830 (HH), R01CA124709 (JMM), R01CA180692 (JMM), and R35CA220500 (JMM).
Notes
The funders had no role in the design of the study; the collection, analysis, and interpretation of the data; the writing of the article; and the decision to submit the article for publication. The authors have no conflicts of interest to disclose.
Author Contributions: Xiao Chang: conceptualization; data curation; formal analysis; investigation; methodology; writing–original draft, review, and editing. Marina Bakay: validation; writing–review and editing. Yichuan Liu: formal analysis; methodology. Joseph Glessner: methodology; project administration. Komal S. Rathi: formal analysis. Cuiping Hou: data curation. Huiqi Qu: methodology; writing–review and editing. Zalman Vaksman: formal analysis. Kenny Nguyen: data curation. Patrick M. A. Sleiman: supervision. Sharon J. Diskin: supervision; writing–review and editing. John M. Maris: funding acquisition; supervision; writing–review and editing. Hakon Hakonarson: conceptualization; funding acquisition; supervision; writing–review and editing.

