


Abstract
Rapid access to pancreatic imaging and regular pancreatic surveillance may help identify stage I pancreatic cancer. We investigated recent trends in the stage of newly diagnosed pancreatic ductal adenocarcinoma (PDACs), age at diagnosis, and survival.
Trends in age-adjusted incidence of stage IA PDAC between 2004 and 2016 were determined from the National Cancer Institute’s Surveillance, Epidemiology and End Results database. All tests were two-sided.
The incidence of stage IA PDAC cases diagnosed increased statistically significantly from 2004 to 2016 (annual percent change = 14.5, 95% confidence interval [CI] = 11.4 to 17.7; P < .001). During the study period, average age at diagnosis for stage IA and IB casesAQ3 declined by 3.5 years (95% CI = 1.2 to 5.9; P = .004) and 5.5 years (95% CI = 3.4 to 7.6; P < .001), whereas average age increased for higher-stage cases (by 0.6 to 1.4 years). Among stage IA cases, the proportion of blacks was smaller (10.2% vs 12.5%), and the proportion of other non-Caucasians was higher compared with higher-stage cases (11.9% vs 8.4%; P < .001). Stage IA cases were more likely to carry insurance (vs Medicaid or none) than higher-stage cases (cases aged younger than 65 years; odds ratio = 2.45, 95% CI = 1.96 to 3.06; P < .001). The 5-year overall survival for stage IA PDAC improved from 44.7% (95% CI = 31.4 to 63.7) in 2004 to 83.7% (95% CI = 78.6% to 89.2%) in 2012; 10-year survival improved from 36.7% (95% CI = 24.1 to 55.8) in 2004 to 49.0% (95% CI = 37.2% to 64.6%) in 2007.
In recent years, the proportion of patients diagnosed with stage IA PDAC has increased, their average age at diagnosis has decreased, and their overall survival has improved. These trends may be the result of improved early diagnosis and early detection.
Pancreatic ductal adenocarcinoma (PDAC) has very poor survival, but 5-year survival rates have improved recently (currently approximately 9%) (1,2). The reasons for this improved survival are uncertain. Most patients with PDAC develop symptoms after the cancer has spread beyond the gland (3,4). Patients diagnosed with stage I PDAC while undergoing pancreatic surveillance with imaging are usually asymptomatic (5). Opportunities to diagnose an asymptomatic stage I PDAC occur when patients undertake regular pancreatic surveillance either for their familial and/or genetic susceptibility (6) or for incidentally detected pancreatic cyst(s). Asymptomatic stage I PDACs can be detected incidentally when individuals undergo abdominal imaging for other indications. The risk of developing pancreatic cancer is generally highest among carriers of pathogenic pancreatic cancer susceptibility gene variants and in those with a significant family history of PDAC (7,8) and intermediate in those with incidentally detected pancreatic cysts (9) and other risk factors, such as smoking (average approximately twofold elevated risk), obesity or metabolic syndrome (approximately 1.5-fold elevated) (10,11), and increasing age (approximately tenfold increase between ages 40 and 80 years) (12). The magnitude of risk depends on many factors, including the extent of PDAC family history (eg, having two first-degree relatives with PDAC confers approximately sixfold elevated risk) (13), which pathogenic susceptibility gene and variant is affected (if any), and the number of pack-years smoked (14).
Most incidentally detected neoplastic pancreatic cysts are intraductal papillary mucinous neoplasms (IPMNs), and most of these have very low risk of progressing to invasive carcinoma (15,16). Pancreatic cysts are commonly found during abdominal imaging for nonpancreatic indications, with an incidence that increases with age [approximately 10% by age 70 years (9,17,18)]. Invasive carcinomas diagnosed in association with IPMNs can be usual PDACs or colloid carcinomas, which are often low-stage with better outcome (19).
PDACs are not commonly detected at stage IA in the absence of regular surveillance because they usually do not cause symptoms and may progress relatively quickly to higher stages (20). Regular pancreatic surveillance of individuals with familial/genetic susceptibility has been reported to result in the downstaging of PDAC, with improved 5-year survival compared with PDAC diagnosed after symptomatic presentation (5,21). Median 5-year survival for patients with localized PDAC who undergo pancreatic resection and (neo)-adjuvant chemotherapy is approximately 20% and higher for stage I cases (22–25). With the emergence of pancreatic surveillance programs for individuals with familial/genetic risk, and improvements in the detection and management of pancreatic cystic neoplasms, we suspected better early detection could be contributing to the improvement in PDAC survival. If so, this would be reflected in a downward stage shift, with an increase in the incidence of stage IA PDAC being diagnosed. We analyzed data from the Surveillance, Epidemiology and End Results (SEER) registry, representative of the US population, to assess recent trends in the stage of newly diagnosed PDACs, age at diagnosis, and survival.
Methods
Data Source and Study Patients
Individuals included in the SEER registries diagnosed with PDAC between January 1, 2004, and December 31, 2016, were identified using the SEER Program (www.seer.cancer.gov). Most PDACs, including small-sized tumors, have lymph node involvement at diagnosis; imaging often misses nodal involvement and therefore understages (26,27). Thus, most PDACs classified by imaging alone as stage I would be restaged as stage IIB or stage III after surgical pathology. Indeed, PDAC cases coded as stage IA nonsurgical in SEER are older and their overall survival approximates that of stage IIB surgical cases (Table 1; Supplementary Table 1, Supplementary Figures 1–3, available online). Therefore, we only included stage I or II cases in analyses if they had surgery documented by SEER. Insurance status was grouped as none, Medicaid, or any other insurance (private or Medicare), and analyzed separately by age dichotomized at 65 years, because cases older than 65 years classified by SEER as uninsured are likely Medicare eligible.
Characteristics of cases in SEER registries diagnosed with pancreatic ductal adenocarcinoma from 2004 to 2016
| Characteristic* | All other staged cancers (n = 91478) | Stage 1A PDAC (n = 1719) |
|---|---|---|
| Age at diagnosis, mean (SD), y | 67.5 (12.3) | 61.4 (13.0) |
| Race, No. (%) | ||
| White | 72 381 (79.2) | 1329 (77.9) |
| Black | 11 392 (12.5) | 174 (10.2) |
| Other | 7637 (8.4) | 203 (11.9) |
| Unknown | 68 | 13 |
| Sex, No. (%) | ||
| Male | 46 988 (51.4) | 814 (47.4) |
| Female | 44 490 (48.6) | 905 (52.6) |
| Hispanic ethnicity, No. (%) | 9927 (10.9) | 186 (10.8) |
| SEER Region, No. (%) | ||
| Pacific Northwest | 46 581 (50.9) | 930 (54.1) |
| Midwest | 9284 (10.1) | 132 (7.7) |
| Southeast | 19 821 (21.7) | 348 (20.2) |
| Northeast | 15 792 (17.3) | 309 (18) |
| Married, Yes/No (%) | 50 248/87 854 (57.2) | 1103/1638 (67.3) |
| Location, No. (%) | ||
| Urban | 80 993 (88.7) | 1574 (91.7) |
| Metro | 9126 (10) | 125 (7.3) |
| Rural | 1237 (1.4) | 18 (1) |
| Unknown | 122 | 2 |
| Year of Diagnosis, No. (% of total per year) | ||
| 2004 | 5581 (99.3) | 38 (0.07) |
| 2005 | 5760 (99.0) | 56 (1.0) |
| 2006 | 5976 (99.1) | 53 (0.09) |
| 2007 | 6198 (99.1) | 59 (0.09) |
| 2008 | 6503 (98.9) | 74 (1.1) |
| 2009 | 6737 (98.7) | 91 (1.3) |
| 2010 | 7182 (98.5) | 113 (1.5) |
| 2011 | 7265 (98.2) | 132 (1.8) |
| 2012 | 7529 (97.5) | 196 (2.5) |
| 2013 | 7877 (97.4) | 214 (2.6) |
| 2014 | 8125 (97.5) | 206 (2.5) |
| 2015 | 8347 (97.0) | 255 (3.0) |
| 2016 | 8398 (97.3) | 232 (2.7) |
| Tumor size, median (range) | 3.9 (0.1–10) | 1.5 (0.1–2.5) |
| Insurance status, No. (%) | ||
| None | 2222 (3) | 25 (1.6) |
| Medicaid | 9298 (12.5) | 118 (7.5) |
| Other (private or Medicare) | 62 641 (84.5) | 1429 (90.9) |
| Unknown† | 17317 | 147 |
| IPMN-associated disease, No. (%) | ||
| No | 88 301 (96.5) | 1595 (92.8) |
| Yes | 3177 (3.5) | 124 (7.2) |
| Received surgery, No. (%) | 18 305 (20) | 1719 (100) |
| Received neoadjuvant radiation, Yes/No (%) | 858/18 008 (4.8) | 19/1714 (1.1) |
| Tumor location | ||
| Head | 43 696 (47.8) | 630 (36.6) |
| Body | 11 791 (12.9) | 316 (18.4) |
| Tail | 13 717 (15) | 491 (28.6) |
| Other location | 22 274 (24.3) | 282 (16.4) |
P values for Fisher exact test for categorical variables and for t tests for continuously measured variables for differences in variables between cases with Stage IA disease and all other staged cases were < .001 for all variables except for Hispanic ethnicity (p = .97). IPMN = intraductal papillary mucinous neoplasms; PDAC = pancreatic ductal adenocarcinoma; SEER = Surveillance, Epidemiology, and End Results.
Insurance status not available for cases diagnosed in 2004–2006.
Statistical Analysis
Cohort demographic and clinical characteristics were summarized and compared between patients with and without stage IA cancers using t tests, Wilcoxon rank-sum, and Fisher exact tests with P values calculated using Monte Carlo simulation. Age-adjusted pancreas cancer incidence rates and corresponding annual percent changes (APC) were calculated using SEER*stat (v8.3.5) and Joinpoint software (v4.7.0), respectively. Incidence rates were standardized to the 2000 US population and calculated separately by stage and other subgroups within stage IA (race, age, IPMN-related disease, geographic region) (28,29). All tests were two-sided, and a P value of less than .05 was considered statistically significant.
Linear regression was used to describe changes in age and tumor size at diagnosis over time, with differences in trajectories across stage groups assessed with interaction analysis. Cox proportional hazards models were used to test for linear trends in survival according to year of diagnosis, adjusting for relevant variables (see also Supplementary Methods, available online).
Results
Baseline Characteristics
Demographic and clinical characteristics of stage IA vs all other PDACs diagnosed from 2004 to 2016 in SEER are shown in Table 1 and Supplementary Table 1 (available online). Only 1.1% of stage IA cases that underwent surgery received neoadjuvant therapy during the study period; this percentage has increased considerably in recent years. Among all cases, those diagnosed with stage IA PDAC were approximately 6 years younger on average (61.4 vs 67.5 years; P < .001) and more were female (52.6% vs 48.6%; P < .001) than those with higher-stage cancers. Compared to higher-stage cases, stage IA cases were more likely to be married (67.3% vs 57.2%), less likely to be black (10.2% vs 12.5), more likely to be of other races (11.9% vs 8.4%), and more likely to reside in an urban over a metro or rural area (91.7% vs 88.7%) (all P < .001, Fisher test). Stage IA cases aged younger than 65 years were also more likely than higher-staged cases to have insurance other than Medicaid, after adjusting for age, race, marital status, Hispanic ethnicity, sex, SEER region, and tumor location (odds ratio [OR] = 2.45, 95% CI = 1.96 to 3.06; P < .001). A similar result was observed for cases age older than 65 years (OR = 1.77, 95% CI = 1.24 to 2.51; P = .002; Tables 1; and 2 Supplementary Table 2, available online).
Odds ratios carrying insurance (Medicare or private) compared with Medicaid or no insurance according to stage of disease, separately for those aged younger than 65 years or 65 years and older at PDAC diagnosis
| Stage of disease | OR (95% CI) | P* |
|---|---|---|
| Age <65 y | ||
| Stage IA | 1.00 (referent) | |
| Stage IB | 0.66 (0.50 to 0.87) | .003 |
| Stage IIA | 0.44 (0.34 to 0.56) | <.001 |
| Stage IIB | 0.55 (0.44 to 0.70) | <.001 |
| Stage III | 0.42 (0.33 to 0.53) | <.001 |
| Stage IV | 0.36 (0.29 to 0.45) | <.001 |
| Age ≥65 y | ||
| Stage IA | 1.00 (referent) | |
| Stage IB | 0.71 (0.45 to1.10) | .13 |
| Stage IIA | 0.56 (0.39 to 0.81) | .002 |
| Stage IIB | 0.72 (0.50 to 1.03) | .08 |
| Stage III | 0.65 (0.45 to 0.94) | .02 |
| Stage IV | 0.53 (0.37 to 0.75) | <.001 |
Estimates and two-sided P values are calculated from logistic regression models for carrying Medicare or private insurance compared with Medicaid or no insurance according to stage of disease and are adjusted for age, sex, race, marital status, SEER region, Hispanic ethnicity, and tumor location. CI = confidence interval; OR = odds ratio; PDAC = pancreatic ductal adenocarcinoma; SEER = Surveillance, Epidemiology, and End Results.
Incidence Trends
The incidence of all PDAC cases increased over the study period (APC = 1.4, 95% CI = 1.2 to 1.6; P < .001), but the corresponding increase in stage IA cases over the same period was tenfold higher (APC = 14.5, 95% CI = 11.4 to 17.7; P < .001; Figure 1).
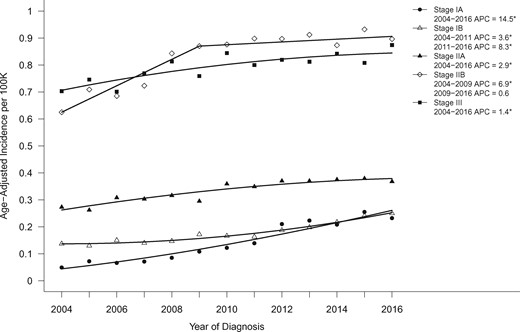
Age-adjusted incidence trends over time for pancreatic cancer stage IA–III, shown as age-adjusted incidence rates (2004–2016). Asterisks denote annual percent change (APC) with P < .05.
We further examined the trends in each stage group (Figure 1). The incidence of stage IV PDAC increased the smallest over the study period (APC = 0.57, 95% CI = 0.35 to 0.79; P < .001), followed by stage III (APC = 1.4, 95% CI = 0.79 to 2.1; P = .001) and stage IIA (APC = 2.9, 95% CI = 2.0 to 3.9; P < .001). Stage IB disease increased from 2004 to 2011 (APC = 3.6, 95% CI = 1.4 to 5.9; P = .005) with greater increases from 2011 to 2016 (APC = 8.3, 95% CI = 5.3 to 11.4; P < .001). In contrast, stage IIB disease increased from 2004 to 2009 (APC = 6.9, 95% CI = 3.8 to 10.1; P < .001) but leveled off from 2010 to 2016 (APC = 0.6, 95% CI = -0.86 to 2.1; P = .37).
The trend in stage IA PDAC diagnoses was most evident in younger (younger than 60 years) compared to older cases (either 61–74 years or older than 75 years) at diagnosis. Whereas the incidence of stage IA diagnoses increased statistically significantly for each age group during the study period, the increase was larger for those younger than 60 years (APC = 19.2, 95% CI = 15.4 to 23.1; P < .001) compared with those aged 61–74 years, where incidence increased from 2004 to 2013 (APC = 17.2, 95% CI = 11.7 to 23.1; P < .001) but leveled off from 2013 to 2016 (APC = -3.8, 95% CI = -13.4 to 18.3; P = .60), and those aged older than 75 years (APC = 10.2, 95% CI = 5.1 to 15.6; P = .001, Figure 2).
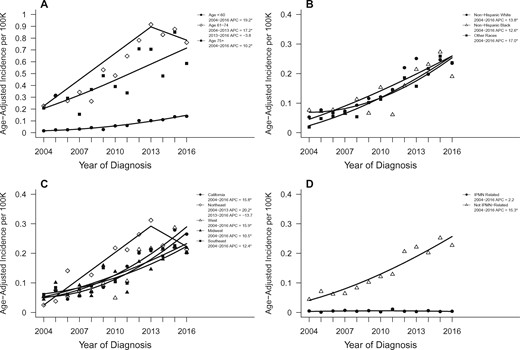
Age-adjusted incidence trends over time for pancreatic cancer stage IA within relevant subgroups. Trends shown according to (A) age, (B) race, (C) geographic SEER region, and (D) IPMN-related disease status. Asterisks denote annual percent change (APC) with two-sided P < .05. IPMN = intraductal papillary mucinous neoplasms.
The incidence of stage IA diagnoses increased statistically significantly over time in whites, blacks, and other races (APC = 13.8, 12.6, 17.0, respectively; P < .001 for each). The increase in stage IA diagnoses was observed in all SEER regions. This increase was not as large in the Southeast (APC = 12.4, 95% CI = 7.5 to 17.5; P < .001) or the Midwest (APC = 10.5, 95% CI = 5.4 to 15.9; P < .001) compared with California (APC = 15.8, 95% CI = 12.9 to 18.9; P < .001) or the West (APC = 15.9, 95% CI = 9.9 to 22.2; P < .001). In the Northeast, incidence increased significantly from 2004 to 2013 (APC = 20.2, 95% CI = 8.0 to 33.8; P = .004) but decreased from 2013 to 2016 (APC = -13.7, 95% CI = -41.2 to 26.6; P = .40; Figure 2).
To examine the extent to which trends in stage IA PDACs might be related to an increase in stage IA IPMN-associated PDACs, as a result of surveillance of patients with IPMN, we examined trends in this diagnosis (Table 1). Overall, 3301 (3.5%) of the 93 197 PDAC cases received an IPMN-associated PDAC diagnosis. Within stage IA, 7.2% of cases were IPMN-associated, compared with 3.5% for all other stages (OR = 2.13, 95% CI = 1.75 to 2.58, in which a stage IA case was IPMN-associated; P < .001). The incidence of stage IA PDACs not IPMN-associated increased over the study period (APC = 15.3, 95% CI = 11.5 to 19.3; P < .001) without any statistically significant trend in the incidence of IPMN-associated stage IA (APC = 2.2, 95% CI = -6.2 to 11.3; P = .59; Figure 2).
Consistent with the increase in age-specific incidence of stages IA, IB, and, to a lesser extent IIA, PDAC cases (Figure 1; Supplementary Figure 2, available online), there was an increase in the incidence of patients who underwent surgical resection (APC = 2.8, 95% CI = 2.3 to 3.3; P < .001) with a relatively small change in the incidence of cases without a surgical pathologic diagnosis (APC = 0.26, 95% CI = 0.06 to 0.46; P = .01) and a nonsignificant decrease in cases staged as stage II not otherwise specified (APC = -1.6, 95% CI = -6.2 to 3.2; P = .47). There was an increase from 2004 to 2013 (APC = 4.0, 95% CI = 3.4 to 4.6; P < .001) in the incidence of cases with localized disease but did not have surgery, but this trend dropped off from 2013 to 2016 (APC = -1.9, 95% CI = -4.5 to 0.89; P = .16). Whereas the incidence of surgical cases increased (APC = 2.8), the incidence of stage IA cases increased (APC = 14.5), indicating the overall increase in surgeries performed for patients with PDAC was not the main explanation for the increase in stage IA cases diagnosed.
Average tumor size at diagnosis for stage IA cases decreased slightly (0.009 cm/year, 95% CI = -0.017 to -0.006; P = .04; Supplementary Figure 4, available online); small tumor size reductions were also noted for stages IB and IIA PDACs but were relatively constant for stages IIB, III, and IV during the study period.
Age at Diagnosis Trends
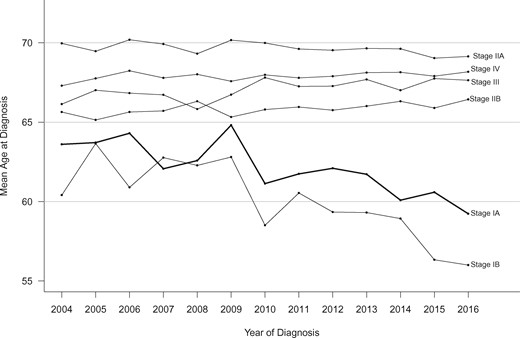
We next calculated the mean age at PDAC diagnosis yearly for 2004 to 2016 by stage (Figure 3). Over the 13-year study period, average age at diagnosis for stage IA cases declined by 3.5 years (95% CI = 1.2 to 5.9; P = .004). Cases diagnosed with stage IB PDAC demonstrated an even larger decline in age at diagnosis (5.5 years, 95% CI = 3.4 to 7.6; P < .001). In contrast, mean age at diagnosis for stage IIA cases remained unchanged, and the other stages (IIB, III, and IV) demonstrated small increases (0.6–1.4 years over the 13-year period). Trajectories for mean age over the period for stages IIA, IIB, III, and IV were all statistically significantly different than the stage IA trajectory (interaction P < .001, 5 df).
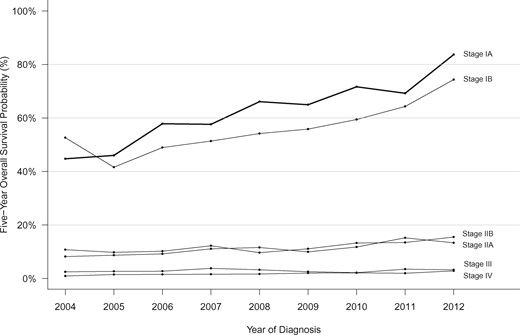
Trends in 5-year overall survival probabilities according to pancreatic cancer stage (2004–2012).
Trends in Survival
Overall survival after a PDAC diagnosis improved from 2004 to 2016 for all TNM stages. Stage IA cases demonstrated the largest reduction in mortality per continuously increasing year of diagnosis (HR = 0.93, 95% CI = 0.87 to 0.98), with stages IB and III cases following a similar pattern (HR = 0.94, 95% CI = 0.90 to 0.98, and HR = 0.95, 95% CI = 0.94 to 0.96; respectively); hazard ratios for all other cases by stage ranged from 0.97 to 0.98 (interaction P < .001 with 5 df). Specifically, 5-year overall survival for stage IA cases improved from 44.7% (95% CI = 34.1% to 63.7%) in 2004 to 83.7% (95% CI = 78.6% to 89.2%) in 2012 (Figure 4). Large improvements in 5-year survival were also observed for stage IB cases (52.6%, 95% CI = 44.0% to 63.0%, to 74.3%, 95% CI = 68.0% to 81.3%), and more modest improvements were observed for higher stage cases: stage IIA (8.2%, 95% CI = 6.3% to 10.6%, to 13.3%, 95% CI = 11.0% to 16.1%); stage IIB (10.8%, 95% CI = 8.7% to 13.4%, to 15.5%, 95% CI = 13.2% to 18.1%); stage III (2.5%, 95% CI = 1.5% to 4.2%, to 3.2%, 95% CI = 2.1% to 4.9%); and stage IV (0.9%, 95% CI = 0.6% to 1.3%, to 2.8%, 95% CI = 2.4% to 3.4%) (Figure 4). Among stage IA cases, improvements in survival were similar across groups defined by age, race, IPMN-related disease, and geographic region (interaction P values for group by year of diagnosis >0.05; Supplementary Figure 5, available online). The improved survival in the whole stage IA cohort continued with longer follow-up: 10-year survival for stage IA cases improved from 36.7% (95% CI = 24.1% to 55.8%) to 49.0% (95% CI = 37.2% to 64.6%) for cases diagnosed in 2004 and 2007, respectively.
Trends in mean age at diagnosis according to pancreatic cancer stage (2004–2016).
Discussion
We find that the proportion of patients diagnosed with stage IA PDAC has increased statistically significantly and the average age at diagnosis of these patients has decreased in recent years. It is unlikely that this trend is the result of changes in disease presentation; patients who present with symptoms generally have advanced-stage disease. Nor is it likely to be related to changes in ascertainment by SEER, because any such change would not be expected to result in a selective decrease in the average age of patients with a stage IA diagnosis. Instead, we suspect the increased diagnoses of stage IA pancreatic cancers is the result of several factors, including earlier diagnosis and surgical management, improved insurance coverage, and enrollment of more eligible individuals (both those with incidentally detected pancreatic cysts and those with familial and/or genetic risk) into pancreatic surveillance programs.
We cannot rule out other explanations such as changes in the biology of the disease, but the disproportionate increase in stage IA cases has occurred over a short period of time, making biological factors less likely. The average age of patients at diagnosis with stage IA disease decreased statistically significantly over the study period with a similar decrease in age for stage IB cases, but there was no downward trend in age overall—a trend that might represent a cohort effect. Such a cohort effect has been observed recently for young-onset colorectal cancer (30). Instead, the increasing numbers of stage IA cases were most notable in younger individuals, which may in part reflect the emergence of pancreatic surveillance of individuals with familial/genetic risk and surveillance of patients with IPMN. Individuals with inherited gene mutations that predispose to PDAC are diagnosed with the disease at younger ages (by approximately 3–5 years on average) than individuals with sporadic forms of PDAC (31–33) and are generally recommended to begin pancreatic surveillance at age 50 (mutation carriers) or 55 (for familial risk) years (5). IPMN-associated PDAC also occurs in younger individuals (34), and prior studies have found IPMN-associated PDACs are more likely to be diagnosed at lower stage (19). There was also an increase in the proportion of IPMN-associated stage IA PDACs during the study period, but less than 5% of all stage IA PDACs in SEER were IPMN-associated. Overall, 3.4% of all PDACs during the study period were classified with IPMN-associated codes; somewhat less than the 6% reported in a hospital series of more than 2500 pancreatic resections (35). The percentage of IPMN-associated PDACs likely underestimates the value of pancreatic surveillance for patients with IPMN because pancreatic resection of IPMN 1) may prevent pancreatic cancer development (5,15,16) and 2) may identify early pancreatic cancer elsewhere in the gland not arising from their IPMN.
Other factors that may have contributed to the trends in stage IA PDACs diagnosed during the study period include better diagnostic imaging and increased suspicion of pancreatic cancer as a diagnosis leading to better pursuit of subtle symptoms or subtle pancreatic imaging abnormalities (36). These factors and perhaps better surgical selection (37) led to an approximate 25% increase in the incidence of PDAC cases that underwent surgery, which by itself would be expected to yield a similar increase in the proportion of stage IA cases. An emerging factor is increased recognition that new-onset diabetes in an older person could be a presentation of pancreatic cancer (38). Trends in the numbers of abdominal scans performed are not a likely explanation for the trend in stage IA PDAC diagnoses. If the stage IA trends were primarily related to incidental detection, abdominal imaging scans performed during the study period would have had to increase by 14% annually to explain this increase. Instead, recent trends suggest modest declines in the numbers of abdominal computed tomography scans being performed (39–41).
We found having insurance, either private or Medicare, was associated with greater odds of being diagnosed with a stage IA PDAC compared with those on Medicaid or without insurance, independent of race, ethnicity, marital status, and other factors, supporting the hypothesis that underinsurance and/or poverty, lower health-care access, and utilization reduces the likelihood of having the earliest-stage and most-curable PDAC. Access to care and health-care utilization are likely important determinants of having a stage IA PDAC. One indicator of health-care utilization is marital status, because health-care utilization is higher among married individuals (42), and stage IA cases were more likely to be married (Table 1). Smokers, who are more likely to be under- or uninsured (43), are diagnosed with PDAC at younger ages on average than nonsmokers, raising the possibility that improvement of insurance coverage could also have contributed to the younger average age at diagnosis for stages IA and IB cases (44). Regional differences in the stage IA PDAC trends are likely due to multiple factors, including availability of pancreas screening programs and population differences, but health-care coverage in a region is also likely to be an important factor. Prior studies have reported blacks more often present with higher-stage PDAC, likely because of multiple factors including insurance coverage (45–47). Our findings support other studies that show access to care and insurance status impacts early cancer detection. Insurance status is strongly associated with cancer outcomes, and early stage, screen-detectable cancers are more likely for patients who are insured (48). The implementation of the Affordable Care Act has steadily reduced the amount of uninsured individuals in the United States to a record low of 9% during 2017 (48). This has led to a dramatic reduction in insurance disparity, which is thought to have contributed to an increase in the incidence of several stage I cancers including pancreatic cancer in states associated with Medicaid expansion compared with states that did not expand insurance (49). Our analysis shows the increased incidence of stage IA PDACs was evident after 2005 and continued after the implementation of the Affordable Care Act in 2010 (Figure 1).
A strength of our study is the 13-year analysis of trends in national cancer registry data. The SEER registry has some recognized limitations with respect to data accuracy and data completion including the accuracy of the original pathologic diagnosis and staging (50); SEER also lacks covariate data needed to develop more comprehensive prediction models, and as a cancer-reporting registry, SEER may underreport precursor lesions, including IPMNs, but such limitations to our study do not appear to explain the trends found for stage IA PDAC during the study period. Although the incidence and survival trends for stage IA PDAC are encouraging, stage IA PDAC still represents only a fraction (approximately 3%) of patients at diagnosis.
In conclusion, the proportion of patients diagnosed with stage IA pancreatic cancer has been increasing in recent years, and their average age at diagnosis has decreased without any significant change in the average age at diagnosis for patients with other disease stages, trends that point to the effect of early detection. The overall survival of stage IA pancreatic cancer has been improving in recent years and is much higher than generally appreciated.
Funding
This work was supported by NIH grants (U01CA210170, CA62924, and R01CA176828, NCI P30 CA006973),and by a Stand Up To Cancer-Lustgarten Foundation Pancreatic Cancer Interception Translational Cancer Research Grant (grant no.: SU2C-AACR-DT25–17). Stand Up To Cancer is a program of the Entertainment Industry Foundation. Research grants are administered by the American Association for Cancer Research, the scientific partner of SU2C. MG is the Sol Goldman Professor of Pancreatic Cancer Research.
Notes
The authors do not have any disclosures to report. The funders had no role in the design of the study; the collection, analysis, and interpretation of the data; the writing of the manuscript; and the decision to submit the manuscript for publication.
References
Statistical Methodology and Applications Branch, Surveillance Research Program, National Cancer Institute. Joinpoint Regression Program, Version 4.2.0. Bethesda, MD: National Cancer Institute, Statistical Methodology and Applications Branch;

