


Abstract
Black-white differences in smoking abstinence are not well understood. This trial sought to confirm previously reported differences in quitting between blacks and whites and to identify factors underlying this difference.
During enrollment, 224 black and 225 white low-income smokers were stratified on race and within race on age and sex to ensure balance on these factors known to impact abstinence. The intervention included varenicline for 12 weeks and six guideline-based smoking cessation counseling sessions. The primary endpoint was cotinine-verified 7-day point prevalence smoking abstinence at week 26. A priori socioeconomic, smoking, treatment process (eg, treatment utilization, side effects, withdrawal relief), psychosocial, and biological factors were assessed to investigate race differences in abstinence. Unadjusted odds ratios (OR) were used to compare abstinence between blacks and whites. Adjusted odds ratios from logistic regression models were used to examine predictors of abstinence. All statistical tests were two-sided.
Blacks were less likely to achieve abstinence at week 26 (14.3% vs 24.4%, OR = 0.51, 95% confidence interval [CI] = 0.32 to 0.83, P = .007). Utilizing best subsets logistic regression, five factors associated with race jointly predicted abstinence: home ownership (yes/no, OR = 3.03, 95% CI = 1.72 to 5.35, P < .001), study visits completed (range = 0–6, OR = 2.81, 95% CI = 1.88 to 4.20, P < .001), income (household member/$1000, OR = 1.03, 95% CI = 1.01 to 1.06, P = .02), plasma cotinine (per 1 ng/mL, OR = 0.997, 95% CI = 0.994 to 0.999, P = .002), and neighborhood problems (range = 10–30, OR = 0.88, 95% CI = 0.81 to 0.96, P = .003).
The race difference in abstinence was fully explained by lack of home ownership, lower income, greater neighborhood problems, higher baseline cotinine, and higher visit completion, which were disproportionately represented among blacks. Findings illuminate factors that make it harder for blacks in the United States to quit smoking relative to whites and provide important areas for future studies to reduce tobacco-related health disparities.
Cigarette smoking remains the leading cause of preventable morbidity and mortality in the United States, accounting for more than 480 000 total deaths and more than 34% of all cancer deaths annually (1). Although non-Hispanic blacks (blacks) have a prevalence of smoking that is comparable to non-Hispanic whites (whites) and smoke fewer cigarettes per day (CPD) and on fewer days of the month (2–5), they have higher rates of smoking-related morbidity and mortality (6–8).
Post hoc analyses from cross-sectional and population-based cohort studies consistently find blacks are less likely to quit than whites despite making more quit attempts (3,9–16). Post hoc analyses from randomized trials, however, have had inconsistent results with seven studies finding no difference in cessation between blacks and whites (17–23), eight with higher cessation among whites (24–31), and one with higher cessation among blacks (32). More recent large-scale randomized trials of varenicline, widely considered the most effective smoking cessation pharmacotherapy (33), have found a strong race effect favoring whites (24,31). None of these studies were prospectively designed to examine race differences, and therefore, it remains unknown why comparable evidence-based treatment may have lower efficacy in blacks relative to whites.
Multiple explanations, including greater use of menthol cigarettes among blacks (34–38); differences in nicotine metabolism (39–43); socioeconomic status (SES) (44–47); social and environmental contexts associated with racism, discrimination, and increased stress (48–59); and differences in treatment-related adverse events, responsiveness to pharmacotherapy, and adherence (10,17,58,60–63), have been proposed. However, studies elucidating mechanisms to explain black-white differences in abstinence are rare (64).
The current study is the first head-to-head study designed to compare cessation between black and white smokers receiving identical treatment while simultaneously elucidating mechanisms associated with race that might explain the relationship between race and quitting. Based on previous studies (24–28,30,31,38), we hypothesized that blacks would have lower cotinine-verified 7-day point prevalence abstinence than whites at week 26 (primary endpoint) but that the effect of race on abstinence would be eliminated by socioeconomic, smoking, psychosocial, treatment process, and biological factors. Selection of mechanisms was guided by the National Cancer Institute’s socioecological framework for addressing tobacco-related health disparities (5) and extensive review of factors contributing to lower rates of abstinence for black smokers (10,17,34–63).
Methods
Study Design
This prospective intervention trial was stratified on self-reported race (black, white) and, within race, on age (<40, ≥40 years) and sex, with a targeted 56 participants in each of the eight races by age and sex cohorts, to ensure recruitment of blacks and whites who were comparable on these key covariates known to impact cessation (64,65). Income was restricted (≤400% federal poverty level [FPL]) to minimize socioeconomic variability within our sample. The upper limit corresponds to the point at which households are no longer eligible for federal assistance programs. The intervention included 12 weeks of varenicline, six smoking cessation counseling sessions through week 16, and follow-up through week 26. Participants provided written informed consent. Study procedures were approved by the Institutional Review Boards at the University of Kansas Medical Center, University of Toronto, and University of California San Francisco. Study design, methodology, treatment intervention, and recruitment are described in detail elsewhere (65).
Screening and Eligibility Criteria
Eligible participants were non-Hispanic black or non-Hispanic white adults (≥18 years) who smoked 3–20 cigarettes per day and were interested in quitting smoking with varenicline. Exclusion criteria included 1) medical contraindications for varenicline (pregnancy, recent acute cardiovascular event, angina or arrhythmia, renal impairment, known sensitivity to varenicline); 2) current use of noncigarette tobacco products, e-cigarettes, or cessation pharmacotherapy; 3) history of substance abuse or treatment for depression, anxiety/panic, psychosis, bipolar, or eating disorder; 4) positive screen for depressive symptomology (Patient Health Questionaire-2 score of ≥3); and 5) household income more than 400% FPL.
Participants were recruited through clinic- and community-based efforts. Enrollment occurred between February 2013 and May 2015. The final week 26 follow-up was completed in November 2015.
Treatment
Pharmacotherapy
At baseline (week 0), each participant received a 30-day supply of varenicline and instructions on titrating up to the full dose following standard dosing guidelines. Participants set a target quit day for one week after the baseline visit, which corresponded to day 8 of varenicline use. Varenicline was dispensed in 30-day pill boxes at weeks 0, 4, and 8.
Counseling
Smoking cessation counseling based on the 2008 Tobacco Use and Dependence Clinical Practice Guidelines and comprising motivational, educational, and skill-training elements (66) was provided in person at weeks 0, 4, 8, and 12 and by phone at weeks 1 and 16 by certified Tobacco Treatment Specialists and supervised by a licensed clinical psychologist.
Measures
Survey Assessments
Surveys targeted factors speculated to contribute to lower rates of abstinence for black smokers (10,17,34–63). Socioeconomic measures included employment status and educational level (67), income (68), home ownership, and perceived neighborhood disadvantage, including problems [e.g., traffic, safety (57,69)] and social cohesion and trust [e.g., connections, shared values, and willingness to help among neighbors (70)]. Smoking history included number of cigarettes smoked per day, type of cigarette smoked (menthol), age when started smoking regularly, social influences on smoking (71), and time to the first cigarette of the day (72).
Treatment process measures included baseline and change (baseline to week 26) in nicotine withdrawal (73), cravings (74), reinforcing effects of nicotine (75), and medication-related side effects (weeks 1–16) (76,77). Treatment adherence was measured by study visit completion (weeks 1–26) and counts of remaining pills in the 30-day pill boxes completed in-person by study staff at weeks 4, 8, and 12 (78).
Psychosocial measures included baseline and change (baseline to week 26) in perceived stress (79), depression (80) and anxiety (80,81), baseline discrimination (82), race consciousness (83), life satisfaction (84), and cynicism/distrust of others’ intentions (85). Biological factors included total nicotine equivalents (TNE) measured by liquid chromatography-tandem mass spectrometry (LC-MS) from urine collected at baseline and adjusted for urine creatinine (86), nicotine metabolism phenotype measured via baseline blood and represented as the nicotine metabolite (NMR), the ratio of trans-3’hydroxycotinine to cotinine (3HC/COT) (87), and nicotine metabolism genotype. Participants were grouped by CYP2A6genotype into normal, intermediate, or slow metabolizers, or reduced metabolizers (intermediate and slow), as described elsewhere (see Supplementary Figure 2, available online) (39,40,42,43,88).
Outcome Measures
The primary endpoint was self-reported 7-day point prevalence smoking abstinence, defined as no cigarettes for the previous seven days at week 26, biochemically verified by salivary cotinine of no more than 15 ng/mL (89). Secondary endpoints were salivary cotinine-verified 7-day point prevalence abstinence at weeks 4 and 12. Sensitivity analyses were conducted using cotinine cut-points of no more than 10 ng/mL and no more than 20 ng/mL.
Statistical Analysis
We estimated a 28% cotinine-verified abstinence rate at week 26 in whites and a 15% abstinence rate in blacks based on data from existing varenicline trials (33,65). The sample size of 224 black and 225 white participants provided 90% power to detect these differences with a type I error rate of 0.05 using a two-sample, two-tailed χ2 test.
The χ2 test was used to compare verified abstinence between blacks and whites. Participants who had missing outcome data at weeks 4, 12, and 26 were considered smokers per the Russell Standard (90). Verified abstinence for completers only at weeks 4, 12, and 26 was also compared. Generalized estimating equations (GEE) were used to determine if loss to follow-up was related to the stratification factors (race, age, sex). Because loss to follow-up was related to race and age, multiple imputation was employed for the analyses of week 26 abstinence to assess the sensitivity of the single imputation versus completers-only results. The corresponding unadjusted odds ratio (OR) and 95% confidence interval (CI) were calculated for each analysis comparing abstinence between blacks and whites. To assess the impact of the stratification variables (race, age, sex) on verified week 26 abstinence, a full logistic regression model with main effects, two-way, and three-way interactions was fit. Adjusted odds ratios from each model are reported along with the 95% confidence intervals. Nonstatistically significant terms were eliminated starting with the highest order terms and continuing until only statistically significant factors remained.
To identify variables, beyond stratification factors that potentially explained the race difference in week 26 abstinence, we examined the association of each of the a priori socioeconomic, smoking, psychosocial, treatment process, and biological factors to race and abstinence using t tests for continuous variables and χ2 tests for categorical variables (91). Stratification variables (ie., race, age, sex) and factors associated with race and abstinence at P= .10 or less were subsequently entered into a series of best subsets logistic regression models to identify a set of factors associated with race that could jointly predict week 26 abstinence (92). Our best subsets were limited to include a maximum of six factors because standard guidelines specify that 10–30 events are needed per parameter (variables plus intercept) in logistic regression modeling (93). With 87 quitters, we could expect to fit at best six factors. Model fit was determined by the AIC intercept covariate, C statistic, and percent concordant while maintaining parsimony and all factors in the model being statistically significant (P ≤ .05). Adjusted odds ratios and 95% confidence intervals are reported for the best two-, three-, four-, five-, and six-factor models.
Results
Enrollment, Follow-Up, and Participant Characteristics
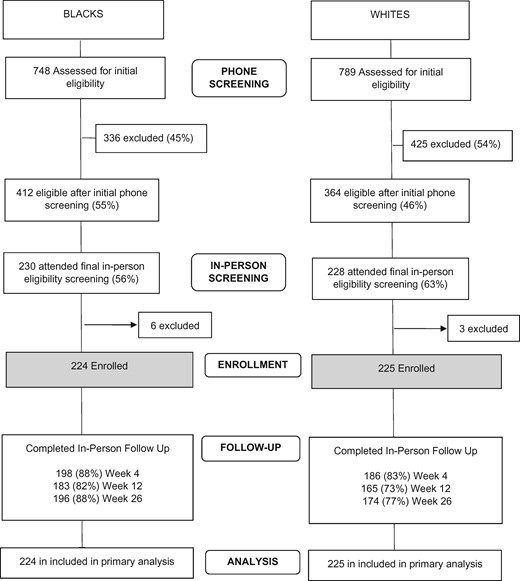
The flow of participants in the study is shown in Figure 1 . Across all in-person visits, whites (P = .004) and those less than 40 years of age (P = .02) were less likely to return, based on GEE models of missing status as a function of our strata. Characteristics of the sample are shown in Table 1.
Select baseline participant characteristics*
| Characteristic | Black | White | P† |
|---|---|---|---|
| Total, No. (%) | 224 (100.0) | 225 (100.0) | — |
| Stratification factors, No. (%) | |||
| Female | 112 (50.0) | 112 (49.8) | NA |
| Age, ≥40 years | 112 (50.0) | 112 (49.8) | NA |
| Smoking characteristics, mean (SD) | |||
| Total nicotine equivalents in nmol/mg creatinine | 55.5 (39.5) | 71.3 (37.9) | <.001 |
| Cigarettes per day | 12.5 (5.7) | 16.9 (4.6) | <.001 |
| Number of five best friends and family who smoke | 2.9 (1.8) | 2.7 (1.7) | .22 |
| Length of time as a smoker, y | 24.2 (12.8) | 24.4 (11.6) | .89 |
| Longest quit attempt, months | 24.8 (70.9) | 25.3 (51.7) | .93 |
| Weight, pounds | 195.3 (51.2) | 182.9 (44.1) | .007 |
| Menthol smoker, No. (%) | 193 (86.2) | 59 (26.2) | <.001 |
| First cigarette within 30 minutes of waking, No. (%) | 177 (79.0) | 168 (74.7) | .28 |
*For comparison of complete characteristics by race, see Tables 5 and 6. NA = not applicable, participants were recruited to be balanced on gender and age as a part of the study design.
†P values were calculated using two-sided χ2tests and two-sided, two-sample t tests for categorical and continuous factors, respectively.
Study flow diagram
Smoking Abstinence
Imputing those lost to follow-up as smokers, blacks were statistically significantly less likely than whites to be abstinent at week 26 (14.3% vs 24.4%, OR = 0.51, 95% CI = 0.32 to 0.83, P < .007), week 12 (17.9% vs 31.1%, OR = 0.48, 95% CI = 0.31 to 0.75, P = .001), and week 4 (14.3% vs 31.1%, OR = 0.37, 95% CI = 0.23 to 0.59, P < .001) (Table 2). The same pattern of findings emerged in completers-only analyses. Using cotinine-verified cut-points of no more than 10 ng/mL and no more than 20 ng/mL had no impact (0%–1%) on the observed abstinence rates (tested in completers-only at week 26; data not shown). Cotinine-verified abstinence at week 26 by race, age, and sex cohorts is shown in Table 3. Race remained statistically significantly associated with abstinence after accounting for effects of the stratification variables (OR = 0.51, 95% CI = 0.31 to 0.83, P = .007, Table 4).
Cotinine-verified and self-reported 7-day point prevalence abstinence rates between blacks and whites*
| Smoking abstinence | Black, No. (%) | White, No. (%) | OR (95% CI) | P† |
|---|---|---|---|---|
| Cotinine-verified intent-to-treat (≤15 ng/mL)‡ | ||||
| Quit at week 4 | 32/224 (14.3) | 70/225 (31.1) | 0.37 (0.23 to 0.59) | <.001 |
| Quit at week 12 | 40/224 (17.9) | 70/225 (31.1) | 0.48 (0.31 to 0.75) | .001 |
| Quit at week 26 | 32/224 (14.3) | 55/225 (24.4) | 0.51 (0.32 to 0.83) | .007 |
| Cotinine-verified completers only (≤15 ng/mL) | ||||
| Quit at week 4 | 32/198 (16.2) | 70/186 (37.6) | 0.32 (0.20 to 0.52) | <.001 |
| Quit at week 12 | 40/183 (21.9) | 70/165 (42.4) | 0.38 (0.24 to 0.61) | <.001 |
| Quit at week 26 | 32/196 (16.3) | 55/174 (31.6) | 0.42 (0.26 to 0.69)§ | <.001 |
*Participants lost to follow-up were imputed as smokers. Time points reflect number of weeks following baseline (week 0). Black and white participants all received varenicline at week 0 following standard dosing guidelines (0.5 mg once daily on days 1–3, 0.5 mg twice daily on days 4–7, and 1 mg twice daily on day 8 through week 12). Participants were instructed to initiate varenicline the day after their baseline visit (day 1) and to set a target quit date for one week later (day 8).Varenicline treatment continued through week 12. Slash marks indicate fraction. CI = confidence interval; OR = odds ratio.
†P values were calculated using the two-sided χ2test.
‡Salivary cotinine assessed at weeks 4, 12, and 26 was used to confirm self-reported abstinence. A cut-point of ≤15 ng/mL was used to differentiate smokers from nonsmokers.
§Per protocol, if loss to follow-up was related to any of our stratification factors (race, age, sex), then both single and multiple imputations were used on our primary outcome, week 26 abstinence, to assess the sensitivity of imputation strategies. Missing status was related to race and age. Multiple imputation techniques (m = 5) modeling week 26 abstinence were similar to the single imputation strategy and produced an OR (95% CI)Imputed = 0.34 (0.20 to 0.54), P < .001.
Cotinine-verified 7-day point prevalence abstinence at week 26 by race, age, and sex cohorts with missing imputed as smokers*
| Age, y | Black, No. (%) | White, No. (%) | ||
|---|---|---|---|---|
| Male | Female | Male | Female | |
| <40 | 4/56 (7.1) | 5/56 (8.9) | 17/57 (29.8) | 9/56 (16.1) |
| ≥40 | 9/56 (16.1) | 14/56 (25.0) | 16/56 (28.6) | 13/56 (23.2) |
| Age, y | Black, No. (%) | White, No. (%) | ||
|---|---|---|---|---|
| Male | Female | Male | Female | |
| <40 | 4/56 (7.1) | 5/56 (8.9) | 17/57 (29.8) | 9/56 (16.1) |
| ≥40 | 9/56 (16.1) | 14/56 (25.0) | 16/56 (28.6) | 13/56 (23.2) |
*Slash marks indicate fraction.
Logistic regression examining the impact of the stratification factors on cotinine-verified 7-day point prevalence abstinence rates at week 26*
| Variable | Full model | Main effects model with two-way interactions | Main effects model | Final model | ||||
|---|---|---|---|---|---|---|---|---|
| OR (95% CI) | P† | OR (95% CI) | P† | OR (95% CI) | P† | OR (95% CI) | P† | |
| Race | ||||||||
| White | 1.00 (Referent) | — | 1.00 (Referent) | — | 1.00 (Referent) | — | 1.00 (Referent) | — |
| Black | 0.48 (0.88 to 1.74) | .26 | 0.46 (0.20 to 4.97) | .06 | 0.51 (0.32 to 0.83) | .007 | 0.51 (0.31 to 0.83) | .007 |
| Age, y | ||||||||
| ≥40 | 1.00 (Referent) | — | 1.00 (Referent) | — | 1.00 (Referent) | — | 1.00 (Referent) | — |
| <40 | 0.87 (0.34 to 2.23) | .88 | 0.97 (0.46 to 2.05) | .94 | 0.60 (0.38 to 0.97) | .04 | 0.60 (0.38 to 0.97) | .04 |
| Sex | ||||||||
| Male | 1.00 (Referent) | — | 1.00 (Referent) | — | 1.00 (Referent) | — | — | — |
| Female | 0.76 (0.32 to 1.77) | .52 | 0.73 (0.34 to 1.59) | .43 | 0.87 (0.54 to 1.40) | .56 | — | — |
| Race x Age | 0.46 (0.11 to 1.98) | .30 | 0.42 (0.15 to 6.71) | .10 | — | — | — | — |
| Age x Sex | 0.73 (0.14 to 3.85) | .71 | 0.64 (0.24 to 1.74) | .38 | — | — | — | — |
| Race x Sex | 0.43 (0.12 to 1.54) | .19 | 0.40 (0.15 to 1.10) | .07 | — | — | — | — |
| Race x Age x Sex | 0.81 (0.06 to 6.48) | .85 | — | — | — | — | — | — |
*Those lost to follow-up are imputed as smokers. CI = confidence interval; OR = adjusted odds ratio.
†P values were calculated for each factor using two-sided Wald tests.
Factors Associated with Race and Week 26 Abstinence
Blacks and whites differed on multiple factors; 18 were also related to the primary outcome (Table 5). Individuals were less likely to achieve abstinence if they were of lower SES; smoked menthol cigarettes; had higher baseline plasma cotinine levels, greater frequency of discrimination, and greater perceived stress; were distrustful of others’ intentions; and lived in neighborhoods characterized by greater problems and lower cohesion and trust. Individuals with higher baseline TNE and craving, those who experienced increases in depression and anxiety and less reduction in stress from weeks 0–26, and those who completed fewer study visits were also less likely to achieve abstinence at week 26. None of these factors statistically eliminated the effect of race on abstinence when examined independently. Factors not associated with race and abstinence are shown in Table 6.
| Characteristic | Relation with race | Relation with abstinence | ||||
|---|---|---|---|---|---|---|
| Black (n = 224) | White (n = 225) | P‡ | Not quit (n = 362) | Quit (n = 87) | P‡ | |
| Socioeconomic characteristics | ||||||
| Income per household member/$1000§, mean (SD) | 9.9 (8.8) | 15.1 (9.7) | <.001 | 11.6 (9.0) | 16.5 (11.0) | <.001 |
| Home ownership, No. (%), yes | 38 (17.0) | 77 (34.2) | <.001 | 77 (21.3) | 38 (43.7.0) | <.001 |
| Education, No. (%) some college or technical school | 130 (58.0) | 167 (74.2) | <.001 | 232 (64.1) | 65 (74.7) | .06 |
| Employment status, No. (%) employed full- or part-time | 118 (52.7) | 171 (76.0) | <.001 | 223 (61.6) | 66 (75.9) | .01 |
| Neighborhood social cohesion and trust, mean (SD) | 16.2 (4.7) | 17.8 (4.5) | <.001 | 16.7 (4.7) | 18.2 (4.4) | .006 |
| Neighborhood problems, mean (SD) | 15.4 (4.5) | 13.5 (3.4) | <.001 | 14.8 (4.3) | 13.3 (3.3) | .006 |
| Smoking characteristics | ||||||
| Cotinine from plasma in ng/mL, mean (SD) | 304.2 (173.0) | 275.0 (122.8) | .04 | 300.6 (154.7) | 243.3 (122.0) | <.001 |
| Total nicotine equivalents from urine in nmol/mg creatine, mean (SD) | 55.5 (39.5) | 71.3 (39.5) | <.001 | 65.0 (40.2) | 56.2 (35.2) | .06 |
| Menthol smoker, No. (%) | 193 (86.2) | 59 (26.2) | <.001 | 214 (59.1) | 38 (43.7) | .009 |
| Treatment process characteristics | ||||||
| Craving, QSU, mean (SD) | 14.1 (7.9) | 15.3 (6.7) | .09 | 15.1 (7.3) | 12.8 (6.8) | .007 |
| Visits completed, out of six, mean (SD) | 5.0 (1.5) | 4.6 (1.9) | .02 | 4.5 (1.8) | 5.8 (0.5) | <.001 |
| Psychosocial characteristics | ||||||
| Perceived stress, PSS, mean (SD) | 4.5 (2.7) | 3.6 (2.3) | <.001 | 4.2 (2.6) | 3.5 (2.3) | .02 |
| Change in stress, wk 26-baseline, mean (SD) | −.9 (0.2) | −.07 (0.2) | .001 | −.2 (0.20) | −1.3 (0.4) | .006 |
| Depressive symptoms, PHQ, mean (SD) | 2.1 (3.4) | 1.2 (1.8) | .006 | 1.7 (2.8) | 1.5 (2.3) | .40 |
| Change in depression, wk 26-baseline, mean (SD) | 1.0 (0.3) | 1.9 (0.3) | <.001 | 2.0 (0.3) | .9 (0.6) | .08 |
| Generalized anxiety symptoms, GAD, mean (SD) | 3.0 (3.6) | 2.1 (2.7) | .003 | 2.7 (3.3) | 1.9 (2.5) | .02 |
| Change in anxiety, wk 26-baseline, mean (SD) | .6 (0.22) | 1. 6 (0.2) | .002 | 1.5 (0.3) | .01 (0.5) | .009 |
| Perceived discrimination, frequency encountered, EOD, mean (SD) | 6.8 (5.4) | 5.1 (4.1) | .003 | 6.2 (5.0) | 4.6 (4.1) | .001 |
| Cynicism/distrust of others’ intentions, C-M, mean (SD) | 5.7 (1.6) | 4.8 (1.7) | <.001 | 5.4 (1.7) | 4.7 (1.8) | .001 |
*All variables were measured at baseline unless otherwise noted. C-M = Cook-Medley Hostility Scale; EOD = Everyday Discrimination Scale; GAD = Generalized Anxiety Disorder Questionnaire; PHQ = Patient Health Questionnaire; PSS = Perceived Stress Scale; QSU = Questionnaire of Smoking Urges.
†Only factors associated with race at P ≤ .10 were examined for their association with abstinence. This variable selection criterion was prespecified to help control the type I error rate. Those factors associated with race and abstinence at P ≤ .10 were included, along with race, in the best subsets logistic regression prediction modeling of week 26 abstinence. Gender and age (study stratification variables) were also included in best subsets logistic regression models.
‡P values were calculated using two-sided χ2tests and two-sided, two-sample t tests for categorical and continuous factors, respectively.
§Represented as the household income and the number of household members supported by that income.
| Characteristic | Relation with race | Relation with abstinence | ||||
|---|---|---|---|---|---|---|
| Black (n = 224) | White (n = 225) | P‡ | Not quit (n = 362) | Quit (n = 87) | P‡ | |
| Socioeconomic characteristics | ||||||
| Income per household member/$1000§, mean (SD) | 9.9 (8.8) | 15.1 (9.7) | <.001 | 11.6 (9.0) | 16.5 (11.0) | <.001 |
| Home ownership, No. (%), yes | 38 (17.0) | 77 (34.2) | <.001 | 77 (21.3) | 38 (43.7.0) | <.001 |
| Education, No. (%) some college or technical school | 130 (58.0) | 167 (74.2) | <.001 | 232 (64.1) | 65 (74.7) | .06 |
| Employment status, No. (%) employed full- or part-time | 118 (52.7) | 171 (76.0) | <.001 | 223 (61.6) | 66 (75.9) | .01 |
| Neighborhood social cohesion and trust, mean (SD) | 16.2 (4.7) | 17.8 (4.5) | <.001 | 16.7 (4.7) | 18.2 (4.4) | .006 |
| Neighborhood problems, mean (SD) | 15.4 (4.5) | 13.5 (3.4) | <.001 | 14.8 (4.3) | 13.3 (3.3) | .006 |
| Smoking characteristics | ||||||
| Cotinine from plasma in ng/mL, mean (SD) | 304.2 (173.0) | 275.0 (122.8) | .04 | 300.6 (154.7) | 243.3 (122.0) | <.001 |
| Total nicotine equivalents from urine in nmol/mg creatine, mean (SD) | 55.5 (39.5) | 71.3 (39.5) | <.001 | 65.0 (40.2) | 56.2 (35.2) | .06 |
| Menthol smoker, No. (%) | 193 (86.2) | 59 (26.2) | <.001 | 214 (59.1) | 38 (43.7) | .009 |
| Treatment process characteristics | ||||||
| Craving, QSU, mean (SD) | 14.1 (7.9) | 15.3 (6.7) | .09 | 15.1 (7.3) | 12.8 (6.8) | .007 |
| Visits completed, out of six, mean (SD) | 5.0 (1.5) | 4.6 (1.9) | .02 | 4.5 (1.8) | 5.8 (0.5) | <.001 |
| Psychosocial characteristics | ||||||
| Perceived stress, PSS, mean (SD) | 4.5 (2.7) | 3.6 (2.3) | <.001 | 4.2 (2.6) | 3.5 (2.3) | .02 |
| Change in stress, wk 26-baseline, mean (SD) | −.9 (0.2) | −.07 (0.2) | .001 | −.2 (0.20) | −1.3 (0.4) | .006 |
| Depressive symptoms, PHQ, mean (SD) | 2.1 (3.4) | 1.2 (1.8) | .006 | 1.7 (2.8) | 1.5 (2.3) | .40 |
| Change in depression, wk 26-baseline, mean (SD) | 1.0 (0.3) | 1.9 (0.3) | <.001 | 2.0 (0.3) | .9 (0.6) | .08 |
| Generalized anxiety symptoms, GAD, mean (SD) | 3.0 (3.6) | 2.1 (2.7) | .003 | 2.7 (3.3) | 1.9 (2.5) | .02 |
| Change in anxiety, wk 26-baseline, mean (SD) | .6 (0.22) | 1. 6 (0.2) | .002 | 1.5 (0.3) | .01 (0.5) | .009 |
| Perceived discrimination, frequency encountered, EOD, mean (SD) | 6.8 (5.4) | 5.1 (4.1) | .003 | 6.2 (5.0) | 4.6 (4.1) | .001 |
| Cynicism/distrust of others’ intentions, C-M, mean (SD) | 5.7 (1.6) | 4.8 (1.7) | <.001 | 5.4 (1.7) | 4.7 (1.8) | .001 |
*All variables were measured at baseline unless otherwise noted. C-M = Cook-Medley Hostility Scale; EOD = Everyday Discrimination Scale; GAD = Generalized Anxiety Disorder Questionnaire; PHQ = Patient Health Questionnaire; PSS = Perceived Stress Scale; QSU = Questionnaire of Smoking Urges.
†Only factors associated with race at P ≤ .10 were examined for their association with abstinence. This variable selection criterion was prespecified to help control the type I error rate. Those factors associated with race and abstinence at P ≤ .10 were included, along with race, in the best subsets logistic regression prediction modeling of week 26 abstinence. Gender and age (study stratification variables) were also included in best subsets logistic regression models.
‡P values were calculated using two-sided χ2tests and two-sided, two-sample t tests for categorical and continuous factors, respectively.
§Represented as the household income and the number of household members supported by that income.
| Characteristic | Relation with race | Relation with abstinence | ||||
|---|---|---|---|---|---|---|
| Black (n = 224) | White (n = 225) | P‡ | Did not quit (n = 362) | Quit (n = 87) | P‡ | |
| Smoking characteristics | ||||||
| Cigarettes per day, mean (SD) | 12.5 (5.7) | 16.9 (4.6) | <.001 | 14.7 (5.7) | 14.3 (5.7) | .53 |
| Age started smoking regularly, mean (SD), y | 18.6 (6.4) | 16.5 (4.8) | <.001 | 17.4 (5.5) | 18.3 (6.6) | .20 |
| Length of time as a smoker in years, mean (SD) | 23.8 (12.7) | 24.0 (11.6) | .85 | — | — | — |
| First cigarette within 30 minutes of waking, No. (%), yes | 177 (79.0) | 168 (74.7) | .28 | — | — | — |
| Number of your five best friends smoke, mean (SD) | 2.9 (1.8) | 2.7 (1.7) | .22 | — | — | — |
| Treatment process characteristics | ||||||
| Withdrawal, MNWS, mean (SD) | 5.3 (4.3) | 5.2 (3.1) | .81 | — | — | — |
| Change in withdrawal, wk 26-baseline, mean (SD) | .9 (0.3) | 1.0 (0.3) | .75 | — | — | — |
| Change in craving, wk 26-baseline, mean (SD) | −7.9 (0.5) | −9.0 (0.5) | .09 | −8.9 (0.4) | −8.5 (0.8) | .67 |
| Reinforcing effects of nicotine, M-CEQ,§ mean (SD) | ||||||
| Smoking satisfaction | 12.2 (4.9) | 12.1 (4.5) | .91 | — | — | — |
| Psychological reward | 16.7 (7.2) | 16.6 (7.3) | .90 | — | — | — |
| Aversion | 3.0 (1.9) | 2.4 (1.2) | <.001 | 2.7 (1.6) | 2.6 (1.7) | .51 |
| Enjoyment of respiratory tract sensations | 3.2 (1.9) | 3.0 (1.8) | .47 | — | — | — |
| Craving reduction | 4.8 (2.0) | 5.4 (1.6) | .002 | 5.1 (1.8) | 5.2 (1.8) | .67 |
| Medication adherence,‖ No. (%) | ||||||
| Week 4 | 172 (85.5) | 173 (87.2) | .50 | — | — | — |
| Week 8 | 142 (89.8) | 132 (86.4) | . 20 | — | — | — |
| Week 12 | 116 (90.0) | 104 (88.7) | .65 | — | — | — |
| Any moderate to severe medication-related side effects, weeks 1–16, No. (%), yes | 210 (95.5) | 206 (96.3) | .67 | — | — | — |
| Psychosocial characteristics | ||||||
| Depressive symptoms, PHQ, mean (SD) | 2.1 (3.4) | 1.2 (1.8) | .006 | 1.7 (2.8) | 1.5 (2.3) | .40 |
| Race consciousness, No. (%) who ever thinks about their race | 115 (51.3) | 67 (29.8) | <.001 | 153 (42.3) | 29 (33.3) | .13 |
| Satisfaction with life, SWLS, mean (SD) | 20.1 (6.3) | 23.8 (5.5) | <.001 | 21.8 (6.3) | 22.9 (5.8) | .12 |
| Biological characteristics | ||||||
| Nicotine metabolism phenotype, 3HC/COT, mean (SD) | .4 (0.3) | .4 (0.2) | .14 | — | — | — |
| Nicotine metabolism genotype, CYP2A6, No. (%) reduced metabolizer¶ | 102 (45.5) | 58 (25.8) | <.001 | 131 (36.2) | 29 (33.3) | .48 |
*All variables were measured at baseline unless otherwise noted. 3HC/COT = trans-3’hydroxycotinine; M-CEQ = Modified Cigarette Evaluation Questionnaire; MNWS = Minnesota Withdrawal Scale; PHQ = Patient Health Questionnaire; SWLS = Satisfaction with Life Scale.
†Only factors associated with race at P ≤ .10 were examined for their association with abstinence; therefore, there are missing values for the associations with abstinence in the table. This variable selection criterion was prespecified to help control the type I error rate. Those factors associated with race and abstinence at P ≤ .10 were included, along with race, in the best subsets logistic regression prediction modeling of week 26 abstinence. Gender and age (study stratification variables) were also included in best subsets logistic regression models.
‡P values were calculated using two-sided χ2tests and two-sided, two-sample t tests for categorical and continuous factors, respectively.
§These questions were only asked of continuing smokers at follow-up.
‖Varenicline was dispensed in 30-day pill boxes at weeks 0, 4, and 8. Pill count assessments were completed on those who returned with their pill box at weeks 4, 8, and 12. The number of pills remaining in each compartment of the pill box (i.e., untaken and/or missed doses) was directly observed by study staff. Adherence was calculated as (number of pills provided over the 30-day period - number of pills missed) ÷ number of pills provided and multiplied by 100.
¶Those individuals with one or two copies of essential loss of function alleles (*2, *4H, *17, *20, *23-*28, *31, *35) or two copies of reduced function alleles (*9, *12) were classified as CYP2A6 reduced metabolizers.
| Characteristic | Relation with race | Relation with abstinence | ||||
|---|---|---|---|---|---|---|
| Black (n = 224) | White (n = 225) | P‡ | Did not quit (n = 362) | Quit (n = 87) | P‡ | |
| Smoking characteristics | ||||||
| Cigarettes per day, mean (SD) | 12.5 (5.7) | 16.9 (4.6) | <.001 | 14.7 (5.7) | 14.3 (5.7) | .53 |
| Age started smoking regularly, mean (SD), y | 18.6 (6.4) | 16.5 (4.8) | <.001 | 17.4 (5.5) | 18.3 (6.6) | .20 |
| Length of time as a smoker in years, mean (SD) | 23.8 (12.7) | 24.0 (11.6) | .85 | — | — | — |
| First cigarette within 30 minutes of waking, No. (%), yes | 177 (79.0) | 168 (74.7) | .28 | — | — | — |
| Number of your five best friends smoke, mean (SD) | 2.9 (1.8) | 2.7 (1.7) | .22 | — | — | — |
| Treatment process characteristics | ||||||
| Withdrawal, MNWS, mean (SD) | 5.3 (4.3) | 5.2 (3.1) | .81 | — | — | — |
| Change in withdrawal, wk 26-baseline, mean (SD) | .9 (0.3) | 1.0 (0.3) | .75 | — | — | — |
| Change in craving, wk 26-baseline, mean (SD) | −7.9 (0.5) | −9.0 (0.5) | .09 | −8.9 (0.4) | −8.5 (0.8) | .67 |
| Reinforcing effects of nicotine, M-CEQ,§ mean (SD) | ||||||
| Smoking satisfaction | 12.2 (4.9) | 12.1 (4.5) | .91 | — | — | — |
| Psychological reward | 16.7 (7.2) | 16.6 (7.3) | .90 | — | — | — |
| Aversion | 3.0 (1.9) | 2.4 (1.2) | <.001 | 2.7 (1.6) | 2.6 (1.7) | .51 |
| Enjoyment of respiratory tract sensations | 3.2 (1.9) | 3.0 (1.8) | .47 | — | — | — |
| Craving reduction | 4.8 (2.0) | 5.4 (1.6) | .002 | 5.1 (1.8) | 5.2 (1.8) | .67 |
| Medication adherence,‖ No. (%) | ||||||
| Week 4 | 172 (85.5) | 173 (87.2) | .50 | — | — | — |
| Week 8 | 142 (89.8) | 132 (86.4) | . 20 | — | — | — |
| Week 12 | 116 (90.0) | 104 (88.7) | .65 | — | — | — |
| Any moderate to severe medication-related side effects, weeks 1–16, No. (%), yes | 210 (95.5) | 206 (96.3) | .67 | — | — | — |
| Psychosocial characteristics | ||||||
| Depressive symptoms, PHQ, mean (SD) | 2.1 (3.4) | 1.2 (1.8) | .006 | 1.7 (2.8) | 1.5 (2.3) | .40 |
| Race consciousness, No. (%) who ever thinks about their race | 115 (51.3) | 67 (29.8) | <.001 | 153 (42.3) | 29 (33.3) | .13 |
| Satisfaction with life, SWLS, mean (SD) | 20.1 (6.3) | 23.8 (5.5) | <.001 | 21.8 (6.3) | 22.9 (5.8) | .12 |
| Biological characteristics | ||||||
| Nicotine metabolism phenotype, 3HC/COT, mean (SD) | .4 (0.3) | .4 (0.2) | .14 | — | — | — |
| Nicotine metabolism genotype, CYP2A6, No. (%) reduced metabolizer¶ | 102 (45.5) | 58 (25.8) | <.001 | 131 (36.2) | 29 (33.3) | .48 |
*All variables were measured at baseline unless otherwise noted. 3HC/COT = trans-3’hydroxycotinine; M-CEQ = Modified Cigarette Evaluation Questionnaire; MNWS = Minnesota Withdrawal Scale; PHQ = Patient Health Questionnaire; SWLS = Satisfaction with Life Scale.
†Only factors associated with race at P ≤ .10 were examined for their association with abstinence; therefore, there are missing values for the associations with abstinence in the table. This variable selection criterion was prespecified to help control the type I error rate. Those factors associated with race and abstinence at P ≤ .10 were included, along with race, in the best subsets logistic regression prediction modeling of week 26 abstinence. Gender and age (study stratification variables) were also included in best subsets logistic regression models.
‡P values were calculated using two-sided χ2tests and two-sided, two-sample t tests for categorical and continuous factors, respectively.
§These questions were only asked of continuing smokers at follow-up.
‖Varenicline was dispensed in 30-day pill boxes at weeks 0, 4, and 8. Pill count assessments were completed on those who returned with their pill box at weeks 4, 8, and 12. The number of pills remaining in each compartment of the pill box (i.e., untaken and/or missed doses) was directly observed by study staff. Adherence was calculated as (number of pills provided over the 30-day period - number of pills missed) ÷ number of pills provided and multiplied by 100.
¶Those individuals with one or two copies of essential loss of function alleles (*2, *4H, *17, *20, *23-*28, *31, *35) or two copies of reduced function alleles (*9, *12) were classified as CYP2A6 reduced metabolizers.
Joint Effects of Covariates on Race
Race, age, sex, and the 18 previously identified factors were subsequently entered into best subsets logistic models to identify the set of factors associated with race that jointly predicted week 26 abstinence. Covariates, together, completely eliminated the effect of race. Race did not emerge in any of the first or second best two, three, four, five, or six factor models. There was, however, a high degree of consistency in the factors predicting abstinence across models (Table 7). The five-factor model had the strongest fit. Home ownership (yes/no, OR = 3.03, 95% CI = 1.72 to 5.35, P < .001), study visits completed (range = 0–6, OR = 2.81, 95% CI = 1.88 to 4.20, P < .001), and income (household member/$1000, OR = 1.03, 95% CI = 1.01 to 1.06, P = .02) increased the odds of quitting, whereas baseline plasma cotinine (per 1 ng/mL, OR = 0.997, 95% CI = 0.994 to 0.999, P = .002) and neighborhood problems (range = 10–30, OR = 0.88, 95% CI = 0.81 to 0.96, P = .003) decreased the odds of quitting. These factors correctly predicted the likelihood of abstinence with 83.2% concordance. Post hoc sensitivity analyses showed no interaction between race and socioeconomic disadvantage on week 26 abstinence.
Best subsets logistic regression modeling of the best two-, three-, four-, five-, and six-factor models jointly predicting week 26 verified abstinence
| Variables | Best two-factor model | Best three-factor model | Best four-factor model | Best five-factor model* | Best six-factor model | |||||
|---|---|---|---|---|---|---|---|---|---|---|
| OR (95% CI) | P† | OR (95% CI) | P† | OR (95% CI) | P† | OR (95% CI) | P† | OR (95% CI) | P† | |
| Home owner | ||||||||||
| No | 1.00 (Referent) | — | 1.00 (Referent) | — | 1.00 (Referent) | — | 1.00 (Referent) | — | 1.00 (Referent) | — |
| Yes | 3.24 (1.90 to 5.53) | <.001 | 3.33 (1.92 to 5.78) | <.001 | 2.88 (1.65 to 5.02) | <.001 | 3.03 (1.72 to 5.35) | <.001 | 2.91 (1.64 to 5.17) | <.001 |
| Study visits completed (range = 0–6) | 2.73 (1.83 to 4.08) | <.001 | 2.91 (1.94 to 4.44) | <.001 | 2.63 (1.78 to 3.90) | <.001 | 2.81 (1.88 to 4.20) | <.001 | 2.88 (1.91 to 4.34) | <.001 |
| Income per household member/$1000 | — | — | — | — | 1.10 (1.02 to 1.07) | .001 | 1.03 (1.01 to 1.06) | .02 | 1.03 (1.00 to 1.06) | .04 |
| Cotinine per 1 ng/mL | — | — | — | — | 0.997 (0.995 to 0.999) | .002 | 0.997 (0.994 to 0.999) | .002 | 0.997 (0.994 to 0.999) | .002 |
| Neighborhood problems (range = 10–30) | — | — | 0.87 (0.80 to 0.94) | <.001 | — | — | 0.88 (0.81 to 0.96) | .003 | 0.89 (0.82 to 0.97) | .005 |
| Perceived stress (range 0–16) | — | — | — | — | — | — | — | 0.91 (0.81 to 1.02) | .10 | |
| Model fit statistics | ||||||||||
| AIC intercept covariates | 370.1 | 356.3 | 350.1 | 341.6 | 340.8 | |||||
| Percent concordant | 65.0 | 79.6 | 81.6 | 83.2 | 83.7 | |||||
| C statistic | 0.77 | 0.81 | 0.82 | 0.83 | 0.84 | |||||
*The five-factor model had the best fit statistics while maintaining parsimony and statistical significance of factors in the model. CI = confidence interval; OR = adjusted odds ratio.
†P values were calculated for each factor using the two-sided Wald tests.
Visit Attendance, Medication Adherence, and Adverse Events
Mean visit attendance (ranging from 0 to 6 visits) was 5.0 for blacks and 4.6 for whites (P = .02; Table 5). Blacks and whites were equally likely to use varenicline at weeks 4, 8, and 12. Rates of adherence ranged from 85.5% to 90.0% for blacks and 86.4% to 88.7% for whites (P > .05; Table 6). Blacks and whites reported similar frequency of moderate to severe side effects attributed to varenicline. Blacks experienced more abnormal dreams (13.2% vs 4.2% for whites, P < .001; Supplementary Table 1, available online).
Discussion
This is the first head-to-head trial designed to prospectively examine black-white differences in smoking abstinence. Varenicline was well-tolerated in both groups. Blacks had greater adherence to study visits and comparable adherence to varenicline, yet, as hypothesized, blacks were statistically significantly less likely than whites to quit smoking at all time points. Week 26 abstinence rates were almost exactly our a priori estimates of 28% and 15% in whites and blacks, respectively, supporting the strong internal validity of the study (65). At week 26, blacks had 48.5% reduced odds of abstinence relative to white smokers. Sensitivity analyses using cotinine cut-points of 10 or 20 ng/mL eliminates questions about lower verification of quit rates among blacks being a result of slower cotinine metabolism (94). Abstinence rates mirror two recently published varenicline randomized control trials that found week 24–26 abstinence rates for blacks of 11.2% and 17.7% and whites of 23.6% and 27.9% (post hoc analyses) (24,31). Findings should not be interpreted to mean that varenicline is not effective for black smokers but rather, that on average, blacks are less responsive. Repeated cycles of pharmacotherapy and/or intensive follow-up and behavioral support may help bolster these rates (95–97).
The effect of race on abstinence was eliminated by socioeconomic, treatment process, and smoking characteristics acting together. Specifically, lack of home ownership, lower income, greater neighborhood hassles, and higher baseline cotinine, which were more prevalent among black participants, decreased abstinence. It is well-established that socioeconomically disadvantaged adults are less likely to achieve abstinence (5). Previous studies in racially and socioeconomically diverse samples have found in post hoc analyses that race and SES independently predict abstinence, but studies were not designed or powered to examine race differences and did not account for racial differences in socioeconomic disadvantage in recruitment or the interrelatedness of these constructs in their analyses (24,51,98,99). Blacks in the United States are more disadvantaged than whites (44–59). Our study improves on prior literature by understanding factors associated with race that explain black-white differences in abstinence. The best subsets approach allowed us to identify a set of variables that best predicted abstinence without overfitting or forcing variables that are not statistically significant to be retained in the model (92). To our knowledge, this study is the first to show that black-white differences in abstinence are not due to race or biological differences in nicotine metabolism but rather to a consistent set of social determinants (ie, socioeconomic, treatment process, and smoking characteristics). Notably, blacks had more economic disadvantage, but the relative difference in abstinence was not impacted by poverty level. Few cessation trials consider SES within the study design or reporting of outcomes, yet our study suggests a need to stratify on this factor. Various measures could be considered, but our study suggests that home ownership, a marker of wealth, and, to a lesser degree, income are mostly strongly associated with abstinence.
Findings reflect the fact that race is a social construct that shapes the contexts (e.g., housing, education, jobs, and experiences of daily life) in which we live (64). Current conceptual models linking SES to cessation emphasize the roles of adversity and coping (100,101). Socioeconomically disadvantaged individuals experience greater exposure to stress and adversity but possess fewer resources to cope, and this, in turn, leads to lower likelihood of cessation (44). Although one cannot directly impact SES within a clinical trial, addressing the pathways linking SES to cessation (i.e., stress, coping, psychological distress) has been found to attenuate the impact of SES on abstinence (44).
The fact that cotinine levels and not TNE emerged as a predictor of abstinence was an unexpected finding. Although variations in the rate of nicotine and cotinine metabolism by race could have contributed to this, none of the biological factors associated with nicotine metabolism were predictive of abstinence in the current study. Specifically, as expected, a higher proportion of blacks were slower metabolizers of nicotine; however, nicotine metabolism was not predictive of abstinence, which rules out the possibility that lower rates of abstinence in blacks was due to differences in metabolism and leads to unanswered questions regarding the role of nicotine metabolism in explaining race differences in abstinence. Other unexplored or undiscovered biological constructs (eg, organic citation transporters, renal clearance) may help explain varenicline’s lower efficacy in black smokers. Blacks experienced more abnormal dreams compared to whites, which has been reported in a previous study and may be associated with alterations in smoking and receptor adaptation due to racial variability in nicotine metabolism (102). Mechanisms underlying the association of nicotine metabolism genotype with varenicline side effect profiles are not yet understood.
Our study is not without limitations. Findings cannot be generalized to non-US blacks and whites and require replication with smokers outside the Midwestern United States. We cannot draw conclusions about the relative efficacy of varenicline to placebo between black and white smokers or whether varenicline is more effective than placebo for black smokers. Menthol cigarette use was highly collinear with race, which impacted the ability to model race and menthol together, including the moderating effect of menthol on abstinence. Whites and those less than 40 years of age were more likely to be lost to follow-up, but our findings are consistent across multiple analytic approaches, including our primary intent-to-treat analyses, which treated those missing as smokers, completers-only analysis, and analyses using multiple imputation techniques to account for differential attrition by race and age.
In conclusion, blacks achieved lower quit rates than whites when provided the same treatment of varenicline in combination with smoking cessation counseling. This difference was not due to race or biological differences in nicotine metabolism. Rather, the difference was explained by socioeconomic, treatment process, and smoking characteristics. Findings require replication but begin to illuminate why black smokers in the United States have a harder time quitting relative to whites and provide important areas for future study to reduce tobacco-related health disparities for black smokers.
Funding
This work was supported by R01-DA031815 (NL Nollen) (ClinicalTrials.gov: NCT01836276) from the NIH, National Institute on Drug Abuse, Frontiers: The Heartland Institute for Clinical and Translational Research, which is supported by a CTSA grant to the University of Kansas Medical Center from the NIH National Center for Advancing Translational Science (NCATS; grant no. UL1TR000001), and by the National Cancer Institute Cancer Center Support Grant P30 CA168524 and used the Biospecimen Repository. The work was also supported by P30DA012393 (NL Benowitz) from the National Institute on Drug Abuse and with instrumentation and analytical chemistry support from the National Institutes of Health (S10 RR026437). We acknowledge the support of the Canada Research Chair in Pharmacogenomics (RF Tyndale) and support with instrumentation and genotyping from the Canadian Institutes of Health Research grant FDN-154292 (RF Tyndale).
Notes
Affiliations of authors: Department of Preventive Medicine and Public Health, University of Kansas School of Medicine, Kansas City, KS (NLN, LSC, EFE, TSS); Department of Biostatistics, University of Kansas School of Medicine, Kansas City, KS (MSM); Division of Clinical Pharmacology and Experimental Therapeutics, Departments of Medicine, Bioengineering, and Therapeutic Sciences, University of California, San Francisco, San Francisco, CA (NLB); Center for Addiction and Mental Health, Departments of Psychiatry and Pharmacology & Toxicology, University of Toronto, Toronto, ON (RFT); Department of Behavioral and Social Sciences, Brown University School of Public Health, Providence, RI (JSA).
Pfizer Global Pharmaceuticals provided study medication. Funders had no role in the design of the study; the collection, analysis, or interpretation of the data; the writing of the manuscript; or the decision to submit the manuscript for publication.
Conflicts of Interest: Dr Nollen received study medication from Pfizer Global Pharmaceuticals. Dr Benowitz has served as a paid consultant to Pfizer as a member of its smoking cessation medication advisory board and also as an unpaid scientific advisor to Pfizer regarding a multisite international clinical trial that has been conducted on the safety of varenicline for smoking cessation. He is also a consultant to Achieve Life Sciences and has been an expert witness in litigation against tobacco companies. Dr Tyndale has served as a paid consultant to Apotex and Quin Emmanual (on unrelated topics) and received unrestricted funds from Pfizer via GRAND funding. Ahluwalia is a consultant to Chrono Therapeutics. The remaining authors report no conflicts of interest.
Authors’ contributions: Conception and design (NLN, MSM, LSC, NLB, RFT, JSA); acquisition of data (NLN, MSM, LSC, NLB, RFT, EFE, TSS); analysis and interpretation of data (NLN, MSM, LSC, NLB, RFT, EFE, TSS, JSA); and writing, review, and revision of the manuscript (NLN, MSM, LSC, NLB, RFT, EFE, TSS, JSA). NN is guarantor of this article, and all authors have read and approved the manuscript.
References
Author notes
See the Notes section for the full list of authors’ affiliations.

