


Abstract
Li-Fraumeni syndrome (LFS) has traditionally been identified by single-gene testing (SGT) of TP53 triggered by clinical criteria, but the widespread use of multigene panel tests (MGPTs) has upended this paradigm. We sought to compare the personal and family cancer histories of TP53-positive result (TP53+) carriers who were identified by either MGPT or SGT.
Of 44 310 individuals who underwent testing of TP53 in a single clinical diagnostic laboratory between 2010 and 2014, 44 086 (40 885 MGPT and 3201 SGT) met study eligibility criteria. Personal cancer histories were available for 38 938 subjects. The frequency of germline TP53 results and various phenotypic manifestations were compared according to test type. All statistical tests were two-sided.
MGPT TP53+ individuals (n = 126) had an older median age at first cancer than SGT TP53+ carriers (n = 96; women: median = 36 vs 28 years, P < .001; and men: median = 40 vs 15 years, P = .004). The median age of breast cancer diagnosis was 40 years in MGPT TP53+ women vs 33 years in SGT TP53+ women (P < .001). In both cohorts, childhood and LFS core cancers, and for women, multiple primary cancers (not multiple breast tumors), were associated with TP53+ results. Established LFS testing criteria were less often met by MGPT TP53+ individuals.
MGPT TP53+ individuals differ in phenotype from those ascertained through SGT and are notably older at cancer diagnosis and less likely to meet LFS clinical criteria. These findings suggest that LFS may have a greater phenotypic spectrum than previously appreciated. This has implications for the counseling of MGPT TP53+ individuals. Prospective follow-up of these individuals and families is needed to re-evaluate cancer risks.
Li-Fraumeni syndrome (LFS) is an autosomal dominant hereditary cancer predisposition syndrome associated with germline mutations in the TP53 gene (1–3). Traditionally, germline TP53 analysis has been limited to patients meeting clinical criteria for LFS. Next-generation sequencing (NGS)–based multigene panel tests (MGPT), which enable simultaneous evaluation of multiple hereditary cancer genes, are increasingly replacing traditional genetic testing paradigms in clinical testing for cancer predisposition (4–8). This broad approach to genetic evaluation has identified mutations in established hereditary cancer genes, including TP53, in patients who lack the expected phenotype (9–11). Whether phenotypic expression of TP53 mutations identified on multigene panel testing (MGPT) differs from those identified by single-gene testing (SGT) triggered by classic phenotypic presentations is currently unknown.
Clinical hallmarks of LFS have included cancers at young ages, with half of LFS tumors occurring by age 30 years (12–14), and frequent multiple primary tumors in survivors (15). Component tumors of LFS have classically included bone and soft tissue sarcomas, early-onset breast cancer, brain tumors, leukemia, and adrenocortical carcinoma (ACC) (12,16,17). The phenotypic manifestations have expanded to include rare tumor subtypes such as choroid plexus carcinoma (18), anaplastic embryonal rhabdomyosarcoma (19), sonic hedgehog subtype medulloblastoma (20), and low-hypodiploid acute lymphoblastic leukemia (21). Cancer penetrance has been estimated to be nearly 100% in women and 73% in men by age 60 years based on families ascertained through a pediatric cancer diagnosis (22–24). Variability in cumulative risk by sex, age, and cancer type has been reported even more recently (25,26), leading to questions about penetrance, expressivity, and the interplay between genotype and phenotype (27).
The initial definition of classic LFS required an index patient (proband) with sarcoma who also met specific family history criteria (Table 1) (16). Subsequently, less stringent criteria for LFS were proposed, and Li-Fraumeni-like (LFL) kindreds were described (28,29). In 2001, the first Chompret criteria were derived from TP53 testing of childhood cancer cases and early-onset breast cancer patients in France (30); these testing criteria continue to evolve (25,31). In the United States, the adoption of MGPT has led to more widespread TP53 testing.
LFS clinical classifications
| Criteria | Description | |
|---|---|---|
| Classic (16) | Proband diagnosed with sarcoma age <45 y | |
| AND an FDR with cancer age <45 y | ||
| AND another FDR or SDR in the lineage with any cancer before this age or sarcoma at any age | ||
| Chompret 2009 (31) | Proband with LFS component tumor (breast cancer, STS, OS, CNS tumor, ACC, leukemia, BAC) before age 46 y | |
| AND at least 1 FDR or SDR with cancer before age 56 years (other than breast if the proband has breast cancer) or multiple primaries | ||
| OR multiple tumors (except multiple breast tumors), 2 of which are LFS component tumors; 1 age <46 years | ||
| OR proband with ACC or CPC | ||
| Chompret 2015 (25) | Familial presentation | Proband with tumor belonging to LFS tumor spectrum* (premenopausal breast cancer, STS, OS, CNS tumor, ACC) before age 46 y |
| AND at least 1 FDR or SDR with LFS tumor (except breast cancer if proband has breast cancer) before age 56 y | ||
| Multiple primitive tumors | OR multiple tumors (except multiple breast tumors), 2 of which are LFS component cancers*; 1 age <46 y | |
| Rare tumors | OR proband with ACC, CPC, RMS of embryonal origin (anaplastic subtype) | |
| Early-onset breast cancer | OR breast cancer age <31 y | |
| NCCN 2015 (32) | Chompret 2009 | |
| OR individual with breast cancer age ≤35 y | ||
Leukemia and BAC are no longer part of Chompret 2015. ACC = adrenocortical carcinoma; BAC = bronchoalveolar carcinoma; CNS = central nervous system; CPC = choroid plexus carcinoma; FDR = first-degree relative; LFS = Li-Fraumeni syndrome; OS = osteosarcoma; RMS = rhabdomyosarcoma; SDR = second-degree relative; STS = soft tissue sarcoma.
We examined the frequency of TP53 mutations identified (in individuals whose families had no prior history of Li-Frameni syndrome) through MGPT and SGT performed at a large commercial diagnostic laboratory by various clinical characteristics, and we examined the personal and family cancer histories of individuals found to have germline TP53 mutations via the testing type.
Methods
Test Subjects and Phenotype Analysis
Subject specimens were submitted to a single laboratory (Ambry Genetics, Inc., Aliso Viejo, CA, USA) for TP53 SGT and/or MGPT including TP53 between May 2010 and December 2014 from office- and hospital-based practices in the United States. All specimens were accompanied by a clinician-completed test requisition form used to gather phenotypic information. Of the 44 310 individuals who underwent TP53 analysis, 224 were excluded because 97 had both SGT and MGPT, 93 had more than one MGPT (because most only had a second test if the first test was negative), four were from families with previously identified TP53+ results, 29 had specimens with suspected somatic interference or mosaicism based on NGS with allelic frequency lower than 25%, and one due to peak height on Sanger sequencing indicating mosaicism. Subjects with pathogenic or likely pathogenic variants in other cancer predisposition genes (n = 3595, including six who also had a TP53+ result), with unknown personal cancer history (n = 1549) or with unknown sex (n = 4), were excluded, leaving a “phenotype data set” of 38 938 (3036 SGT and 35 902 MGPT) subjects who had both evaluable clinical and genetic information.
Each TP53+ test subject’s record was reviewed to determine if the National Comprehensive Cancer Network (NCCN), Chompret criteria (2009 and 2015), or classic LFS definitions were fulfilled (16,25,31,32). Phenotypic information was obtained from test requisition forms that included personal and family information. Three-generation pedigrees were available for 50% of the TP53+ cases and clinic notes for 7%. For TP53+ subjects who did not meet any LFS criteria based on review of requisition forms, pedigrees, or clinic notes, ordering clinicians were contacted via e-mail and a follow-up phone call to obtain more complete phenotypic information (SGT n = 40, MGPT n = 73), with an overall response rate of 54% (SGT 35%, MGPT 64%). Pathology records to confirm diagnoses were not collected.
In this study, sarcoma, adrenocortical carcinoma, choroid plexus carcinoma, and brain tumors are called LFS core cancers. Breast cancer, which is an LFS component tumor, is examined separately because of its high frequency.
Dana-Farber Cancer Institute’s (DFCI’s) Institutional Review Board (IRB) and Solutions IRB provided oversight in accordance with regulations, and the sharing of de-identified data was determined to be exempt from the Office of Human Research Protection’s Regulations for the Protection of Human Subjects.
Molecular TP53 Analysis
The description of sequencing techniques is provided in the Supplementary Methods (available online). Genes present on the multigene panel tests are listed in Supplementary Table 1 (available online). The variant classification as of August 2015 was used for analysis and includes five tiers: mutation (M); variant, likely pathogenic (VLP); variant of unknown significance (VUS); variant, likely benign (VLB); and benign (33,34). Cases were classified as negative (TP53-) if only benign or VLB were detected. TP53+ results included M and VLP and were characterized by mutation type: missense, loss of function, genomic rearrangement (deletions), splice alterations, and in-frame deletions (Supplementary Table 2, available online). Missense mutations were further classified by any known dominant-negative (DN) effects, per the International Agency for Research on Cancer TP53 Database (http://p53.iarc.fr) as either DN missense or other missense (OM) (35–37). All variants were deposited to the public database ClinGen (38).
Statistical Analysis
Exact binomial confidence intervals for percentages had 95% coverage. All statistical tests were two-sided, and all tests of percentages used Fisher exact tests (except Monte Carlo simulation, used in comparing the MGPT panel types). Tests of difference between two or more groups for binary variables used the Fisher exact test. The comparison of MGPT vs SGT (stratified on sex) and of men vs women (stratified on test type) used a stratified Fisher test (after checking that homogeneity of odds ratios was not rejected). Tests of differences between two or more groups for variables with three or more values (eg, TP53+, TP53 VUS, and TP53-) used the unordered Fisher-Freeman-Halton test (39); note that VUS cases were not combined with the TP53+ or the TP53- cases, but were treated as a separate category.
Kaplan-Meier curve estimation was used for cumulative plots and medians of age at first cancer (or separately, age at first breast cancer), censoring for age at testing for those without cancer (and age at prior nonbreast cancer for age of first breast cancer). Curves were compared using the unstratified (or stratified by family history) Wilcoxon-Breslow-Gehan test (chosen a priori because of the interest in early-onset cancers in LFS) (40). All statistical tests were two-sided, and a P value of less than .05 was considered statistically significant.
Results
TP53+ Yield of MGPT and SGT
TP53 mutations were identified in 0.2% (102/40 885) vs 4.1% (132/3201) of individuals undergoing MGPT and SGT, respectively (Table 2). Variants of unknown significance in TP53 were also less frequent among MGPT (0.4%) than among SGT subjects (1.2%). These differences were statistically significant overall and in each sex (P < .001). Men were more likely to have a TP53+ or TP53 VUS result than women in both MGPT (0.5% and 0.7% vs 0.2% and 0.4%, P < .001) and SGT (6.5% and 1.5% vs 3.7% and 1.1%, P = .018). The rest of the analysis is based on 38 938 individuals in the phenotype data set. Of these, 93.1% were female, 70.3% were age 19 to 59 years at testing, 78.8% had cancer diagnosed before genetic testing, 73.9% were Caucasian (including the 5.5% Ashkenazi Jewish), and 5.7% were African American (Table 3).
TP53 results overall and by sex
| Test type | Total No. | TP53+ result | TP53 VUS result | TP53- result |
|---|---|---|---|---|
| No. (%) | No. (%) | No. (%) | ||
| Overall* | ||||
| Single gene | 3201 | 132 (4.1) | 38 (1.2) | 3031 (94.7) |
| Total multigene panels | 40 885 | 102 (0.2) | 157 (0.4) | 40 626 (99.4) |
| Multigene panel tests | ||||
| Comprehensive panels† | 5697 | 19 (0.3) | 27 (0.5) | 5651 (99.2) |
| Breast panels‡ | 23 377 | 66 (0.3) | 82 (0.4) | 23 229 (99.4) |
| Gyn panels§ | 7431 | 8 (0.1) | 29 (0.4) | 7394 (99.5) |
| Colon/GI panel | 3172 | 8 (0.3) | 15 (0.5) | 3149 (99.3) |
| Pancreas panel | 693 | 1 (0.1) | 1 (0.1) | 691 (99.7) |
| Kidney panel | 515 | 0 (0.0) | 3 (0.6) | 512 (99.4) |
| Women | ||||
| Single gene | 2740 | 102 (3.7) | 31 (1.1) | 2607 (95.2) |
| Total multigene panels | 38 147 | 88 (0.2) | 138 (0.4) | 37 921 (99.4) |
| Multigene panel tests | ||||
| Comprehensive panels† | 5140 | 14 (0.3) | 22 (0.4) | 5104 (99.3) |
| Breast panels‡ | 23 050 | 63 (0.3) | 81 (0.4) | 22 906 (99.4) |
| Gyn panels§ | 7334 | 8 (0.1) | 28 (0.4) | 7298 (99.5) |
| Colon/GI panel | 1916 | 3 (0.2) | 7 (0.4) | 1906 (99.5) |
| Pancreas panel | 443 | 0 (0.0) | 0 (0.0) | 443 (100.0) |
| Kidney panel | 264 | 0 (0.0) | 0 (0.0) | 264 (100.0) |
| Men | ||||
| Single gene | 459 | 30 (6.5) | 7 (1.5) | 422 (91.9) |
| Total multigene panels | 2738 | 14 (0.5) | 19 (0.7) | 2705 (98.8) |
| Multigene panel tests | ||||
| Comprehensive panels† | 557 | 5 (0.9) | 5 (0.9) | 547 (98.2) |
| Breast panels‡ | 327 | 3 (0.9) | 1 (0.3) | 323 (98.8) |
| Gyn panels§ | 97 | 0 (0.0) | 1 (1.0) | 96 (99.00) |
| Colon/GI panel | 1256 | 5 (0.4) | 8 (0.6) | 1243 (99.0) |
| Pancreas panel | 250 | 1 (0.4) | 1 (0.4) | 248 (99.2) |
| Kidney panel | 251 | 0 (0.0) | 3 (1.2) | 248 (98.8) |
Comparisons of single-gene with total multigene panels combined used the two-sided exact unordered Fisher-Freeman-Halton test; comparisons of the six rows under multigene panel tests used Monte Carlo simulation of the two-sided exact unordered Fisher-Freeman-Halton test. Overall: comparing first two rows (single-gene to all multigene panels combined): P < .001; comparing the six rows under multigene panel tests: P = .03; women: comparing first two rows: P < .001; comparing the six rows under multigene panel tests: P = .37; men: comparing first two rows: P < .001; comparing the six rows under multigene panel tests: P = .68. GI = gastrointestinal; VUS = variant of unknown significance.
CancerNext, CancerNext Expanded.
BreastNext, BRCAplus.
GynPlus, OvaNext.
Demographics of phenotype data set*
| Demographic | SGT | MGPT | Combined |
|---|---|---|---|
| (n = 3036) | (n = 35 902) | (n = 38 938) | |
| No. (%) | No. (%) | No. (%) | |
| Sex | |||
| Female | 2607 (85.9) | 33 655 (93.7) | 36 262 (93.1) |
| Male | 429 (14.1) | 2247 (6.3) | 2676 (6.9) |
| Age at testing, y | |||
| ≤18 | 184 (6.1) | 75 (0.2) | 259 (0.7) |
| 19–29 | 544 (17.9) | 1206 (3.4) | 1750 (4.5) |
| 30–39 | 852 (28.1) | 4926 (13.7) | 5778 (14.8) |
| 40–49 | 613 (20.2) | 9315 (25.9) | 9928 (25.5) |
| 50–59 | 472 (15.5) | 9461 (26.4) | 9933 (25.5) |
| 60–69 | 277 (9.1) | 7362 (20.5) | 7639 (19.6) |
| ≥70 | 94 (3.1) | 3556 (9.9) | 3650 (9.4) |
| Unknown | 0 (0.0) | 1 (0.0) | 1 (0.0) |
| Racial/ethnic groups | |||
| African American/black | 176 (5.8) | 2044 (5.7) | 2220 (5.7) |
| Alaskan Native | 2 (0.1) | 3 (0.0) | 5 (0.0) |
| Ashkenazi Jewish | 118 (3.9) | 2036 (5.7) | 2154 (5.5) |
| Asian | 138 (4.5) | 1188 (3.3) | 1326 (3.4) |
| Caucasian | 1971 (64.9) | 24 652 (68.7) | 26 623 (68.4) |
| Hispanic | 163 (5.4) | 1752 (4.9) | 1915 (4.9) |
| Middle Eastern | 25 (0.8) | 222 (0.6) | 247 (0.6) |
| Native American | 4 (0.1) | 38 (0.1) | 42 (0.1) |
| Mixed ethnicity | 95 (3.1) | 1464 (4.1) | 1559 (4.0) |
| Other | 8 (0.3) | 78 (0.2) | 86 (0.2) |
| Unknown | 336 (11.1) | 2425 (6.8) | 2761 (7.1) |
| Personal history of cancer | |||
| Yes | 2873 (94.6) | 28 114 (78.3) | 30 987 (79.6) |
| No | 163 (5.4) | 7788 (21.7) | 7951 (20.4) |
Evaluable clinical and genetic information. MGPT = multigene panel test; SGT = single-gene test.
In the phenotype data set, 118 distinct germline alterations were found among 222 TP53+ individuals (57 in 96 MGPT and 80 in 126 SGT TP53+ carriers). Most mutations (83.9%) were found in either MGPT or SGT only. In both SGT and MGPT, the most common type of mutation was DN missense (34.9% and 57.3%), followed by other missense (22.2% and 23.9%) and loss of function (20.6% and 10.4%) (Table 4). The distribution of mutation type differed statistically significantly by test type only among women (P < .001).
Distribution of TP53+ results by sex and test type in phenotype data set*
| Mutation type | Women† | Men‡ | Combined | |||
|---|---|---|---|---|---|---|
| SGT§ | MGPT‖ | SGT§ | MGPT‖ | SGT | MGPT | |
| (n = 99) | (n = 82) | (n = 27) | (n = 14) | (n = 126) | (n = 96) | |
| No. (%) | No. (%) | No. (%) | No. (%) | No. (%) | No. (%) | |
| DN missense | 35 (35.4) | 50 (60.9) | 9 (33.3) | 5 (35.7) | 44 (34.9) | 55 (57.3) |
| Other missense | 21 (22.0) | 20 (24.4) | 7 (25.9) | 3 (21.4) | 28 (22.2) | 23 (23.9) |
| Loss of function | 21 (21.2) | 7 (8.5) | 5 (18.5) | 3 (21.4) | 26 (20.6) | 10 (10.4) |
| Gross deletion | 13 (13.1) | 3 (3.6) | 5 (18.5) | 1 (7.1) | 18 (14.3) | 4 (4.2) |
| Miscellaneous¶ | 9 (9.1) | 2 (2.4) | 1 (3.7) | 2 (14.3) | 10 (7.9) | 4 (4.2) |
Evaluable clinical and genetic information. All tests were two-sided exact Fisher tests. DN = dominant-negative; MGPT = multigene panel test; SGT = single-gene test.
Within women SGT vs MGPT: P < .001.
Within men SGT vs MGPT: P = .73.
Within SGT women vs men: P = .86.
Within MGPT women vs men: P = .07.
Splice or in-frame deletion.
Cancer Characteristics Associated With TP53+ Results
The percentages of subjects who had various personal cancer history factors traditionally associated with LFS were compared between those undergoing SGT and those having MGPT, separately for men and women (Table 5). Each of the factors (except breast cancer at any age) was more common in those having SGT than those who had MGPT, and this was true separately for TP53+, TP53 VUS, and TP53- results. Among TP53+ subjects, these differences were statistically significant for childhood cancers in both women and men (P < .001 and P = .02) and for LFS core cancers (both P < .001). These factors were also statistically significantly different in TP53 VUS women (P = .045 and P < .001) as well as for breast cancer diagnosed at age 35 years or younger (P < .001).
Subjects’ cancer histories by test type*
| Cancer history variable | TP53+ result | TP53 VUS result | TP53- result | Total No. | |||||||
|---|---|---|---|---|---|---|---|---|---|---|---|
| SGT | MGPT | P† | SGT | MGPT | P† | SGT | MGPT | P† | SGT | MGPT | |
| Women | |||||||||||
| No. with cancer | 99 | 82 | − | 30 | 126 | − | 2478 | 33 447 | <.001 | 2607 | 33 655 |
| % with any cancer | 97.0 | 92.6 | .30 | 96.7 | 77.0 | .01 | 94.4 | 78.5 | <.001 | 2465 | 26 426 |
| % with cancer ≤18 y | 23.2 | 2.4 | <.001 | 13.3 | 3.2 | .045 | 7.4 | 0.5 | <.001 | 211 | 186 |
| % with LFS core cancer‡ | 47.5 | 18.2 | <.001 | 33.3 | 3.2 | <.001 | 20.3 | 1.1 | <.001 | 559 | 385 |
| % with breast cancer | 69.7 | 82.9 | .06 | 66.7 | 63.4 | .83 | 72.5 | 62.3 | <.001 | 1886 | 20 990 |
| % with breast cancer ≤35 y | 42.4 | 40.2 | .88 | 36.6 | 7.9 | .0002 | 40.1 | 8.0 | <.001 | 1047 | 2721 |
| % with multiple primaries§ | 39.4 | 31.7 | .35 | 30.0 | 14.3 | .058 | 20.9 | 10.6 | <.001 | 567 | 3599 |
| Men | |||||||||||
| No. with cancer | 27 | 14 | − | 7 | 17 | − | 395 | 2216 | <.001 | 429 | 2247 |
| % with any cancer | 100.0 | 71.4 | .01 | 100.0 | 64.7 | .13 | 94.7 | 75.2 | <.001 | 408 | 1688 |
| % with cancer ≤18 y | 62.9 | 21.4 | .02 | 28.6 | 0.0 | .08 | 25.1 | 1.5 | <.001 | 118 | 36 |
| % with LFS core cancer‡ | 92.6 | 28.5 | <.001 | 71.4 | 29.4 | .09 | 59.2 | 2.9 | <.001 | 264 | 74 |
| % with breast cancer | 0.0 | 0.0 | 1.00 | 0.0 | 5.9 | .24 | 3.8 | 9.1 | <.001 | 15 | 202 |
| % with multiple primaries§ | 29.6 | 14.3 | .45 | 57.1 | 23.5 | .16 | 32.9 | 15.6 | <.001 | 142 | 351 |
4.8% of women having SGT and 3.6% of women having MGPT had no information supplied on their personal cancer history; 6.5% of men having SGT and 5.7% of men having MGPT had no information supplied on their personal cancer history. These differences were not statistically significant. LFS = Li-Fraumeni syndrome; MGPT = multigene panel test; SGT = single-gene test; VUS = variant of unknown significance.
All tests were two-sided Fisher exact tests.
Core cancers are sarcoma, brain, adrenocortical carcinoma, and choroid plexus carcinoma (excludes leukemia). If probands with leukemia are grouped with probands with LF core cancers, differences are still statistically significant.
Multiple breast primaries are counted only once; excludes nonmelanoma skin cancer.
Age at first cancer diagnosis was older for MGPT TP53+ individuals than for SGT TP53+ individuals (women: median = 36 vs 28 years, P < .001; and men: medians 40 vs 15 years, P = .01) (Figure 1, A and B). Among the TP53+ individuals, 29 had testing younger than age 18 years (27 SGT and 2 MGPT). To be sure that the statistically significant age differences were not due to pediatric testing, the analysis was also completed excluding this; the resulting curves were almost identical, and the MGPT probands were still statistically significantly older at age of first cancer.
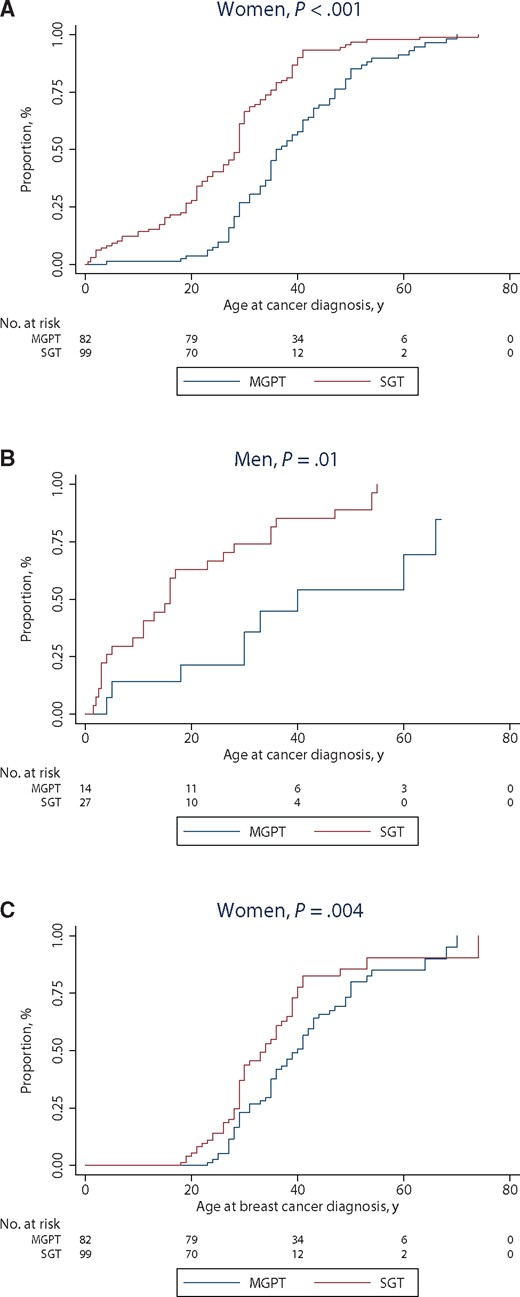
Age at first cancer in TP53+ by test type (A) women, (B) men, and (C) breast cancer. Age at cancer incidence was different (using the two-sided Wilcoxon test) between SGT and MGPT TP53+ probands (A)P < .001; (B)P = .01; (C)P = .004. MGPT = multigene panel test; SGT = single-gene test.
The family history of MGPT TP53+ women was less likely than that of SGT TP53+ women to include a relative with an LFS core cancer (P = .003); the difference was not statistically significant for men (P = .75) (Table 6). Age at first cancer was also stratified by family history of LFS cancer in a first- or second-degree relative (female probands P < .001, male probands P = .005) (Supplementary Figure 1, available online) or by family history of breast cancer diagnosed at age 35 years or younger in a first- or second-degree relative (both P < .001) (Supplementary Figure 2, available online). SGT TP53+ subjects had earlier age at first cancer than MGPT TP53+ subjects for each sex in each figure.
TP53+ subjects’ family history characteristics
| Family history variables* | SGT | MGPT | P† |
|---|---|---|---|
| Women | |||
| No. of TP53 positives | 99 | 82 | |
| % with family female breast cancer (any age) | 50.5 | 53.7 | .77 |
| % with family female breast cancer ≤35y | 22.2 | 15.9 | .34 |
| % with family LFS core cancer‡ | 42.2 | 22.1 | .003 |
| Men | |||
| No. of TP53 positives | 27 | 14 | |
| % with family female breast cancer (any age) | 55.6 | 64.3 | .74 |
| % with family female breast cancer ≤35 y | 29.6 | 21.4 | .72 |
| % with family LFS core cancer‡ | 44.4 | 35.7 | .75 |
Proband cancer history excluded. LFS = Li-Fraumeni syndrome; MGPT = multigene panel test; SGT = single-gene test.
All tests were two-sided Fisher exact tests.
LFS cancer excluding breast cancer and leukemia, but including sarcoma, brain, adrenocortical carcinoma, and choroid plexus carcinoma.
Age of Breast Cancer Diagnosis in TP53+ Women
Of women who were TP53+ on MGPT, 17.1% were censored because they did not have breast cancer and another 9.8% because they had a prior nonbreast cancer; these percentages were 30.3% and 18.2% for SGT. The median age at first breast cancer diagnosis was 40 years in the MGPT cohort and 33 years in the SGT TP53+ cohort (P = .004) (Figure 1C). Of MGPT TP53+ women, 82.9% had breast cancer: of those, 52.9% were first diagnosed older than age 35 years, and 22.1% were first diagnosed older than age 45 years (corresponding percentages for SGT TP53+ were 69.7%, 39.1%, and 8.7%). None of the 217 men with breast cancer tested positive for TP53.
Clinical TP53 Testing Criteria Met Among TP53+ Subjects
It was uncommon for classic LFS criteria to be met in either cohort (differences not statistically significant); however, the MGPT TP53+ cases met Chompret 2009 and 2015 criteria less often than did SGT TP53+ cases (both P < .001 stratified by sex). Only 46.8% of TP53+ MGPT individuals met NCCN TP53 testing criteria (52.4% of women, 14.3% of men), vs 79.4% of TP53+ SGT individuals (80.8% of women, 74.1% of men, P < .001 stratified by sex) (Table 7).
Clinical testing criteria met by TP53+ kindreds in phenotype data set*
| Criteria met | All TP53+ (n = 222), % | SGT total (n = 126), % | MGPT total (n = 96), % | Women | Men | SGT vs MGPT P† | Women vs men P‡ | ||||
|---|---|---|---|---|---|---|---|---|---|---|---|
| SGT (n = 99), % | MGPT (n = 82), % | SGT (n = 27), % | MGPT (n = 14), % | ||||||||
| Classic | 7.2 | 10.3 | 3.1 | 7.1 | 3.7 | 22.2 | 0.0 | .17 | .09 | ||
| Chompret 2009 | 50.0 | 68.3 | 25.0 | 66.7 | 26.8 | 74.1 | 14.3 | <.001 | .84 | ||
| Chompret 2015 | 57.2 | 73.8 | 35.4 | 73.7 | 39.0 | 74.1 | 14.3 | <.001 | .049 | ||
| NCCN 2013–2015 | 65.3 | 79.4 | 46.8 | 80.8 | 52.4 | 74.1 | 14.3 | <.001 | .03 | ||
| 95% CI meeting any above criteria | 58.7 to 71.6 | 71.2 to 86.1 | 36.6 to 57.3 | 71.7 to 88.0 | 41.1 to 63.6 | 53.7 to 88.9 | 1.8 to 42.8 | − | − | ||
Excludes individuals with known deleterious mutations in other cancer predisposition genes, unknown sex, or unknown personal cancer history. CI = confidence interval; MGPT = multigene panel test; NCCN = National Comprehensive Cancer Network; SGT = single-gene test.
The two-sided stratified Fisher exact test was used, after checking that the Zelen test did not reject homogeneity of odds ratios. SGT vs MGPT stratified by sex.
The two-sided stratified Fisher exact test was used, after checking that the Zelen test did not reject homogeneity of odds ratios. Female vs male stratified by SGT and MGPT.
Discussion
Results of this study demonstrate clear clinical differences among TP53+ individuals identified by test type. LFS is known for remarkably early age at cancer diagnoses, including female breast cancers, rare tumor types, and multiple primary neoplasms. In our data, the median age at first cancer diagnosis was 8 years older in TP53+ MGPT women and 25 years older in TP53+ MGPT men than in their SGT counterparts.
In both test types, men were about twice as likely as women to test TP53+, which could reflect a possible higher cancer burden threshold men meet before either seeking or being offered testing. We found that TP53+ subjects identified from panel testing were statistically significantly less likely than those undergoing single-gene testing to have had childhood cancers or LFS core cancers or to fulfill LFS testing criteria.
The age of onset of first breast cancer provides an example of the effects of untethering TP53 testing from specific clinical criteria. Previous population-based studies identified a germline TP53 mutation in 3% to 8% of women diagnosed with breast cancer younger than age 30 years, with few meeting other LFS criteria (41–43). We observed that 39.1% of SGT and 52.9% of MGPT TP53+ women with breast cancer were diagnosed with their first breast cancer after age 35 years. Indeed, 8.7% of SGT and 22.1% of MGPT women were diagnosed after age 45 years. Data on the prevalence of TP53 mutations among women with breast cancer older than age 35 years or not selected for LFS criteria have been limited. In one case–control study of panel testing among 2000 women with breast cancer unselected for age at diagnosis, five (0.25%) were TP53+; none had a family history with classic LFS features (44). In the present study, women with breast cancer who underwent MGPT had a similarly low prevalence of TP53 mutations, at 0.3%. The median age of breast cancer diagnosis among these women was 40 years, notably seven years later than among their SGT TP53+ counterparts.
It is intuitive that those who had SGT were more likely to have LFS personal history factors and to satisfy guidelines for TP53 testing than those who had MGPT testing, as this is how clinicians likely choose which test to order. However, if Li-Fraumeni syndrome phenotypes were invariably severe, we would not expect to find these pronounced differences between SGT and MGPT in TP53+ subjects. These findings, which may be attributed in part to the less selected populations examined in this new testing paradigm, represent an important shift in the field of cancer genetics and have broad implications for patients and clinicians.
This study has limitations, the foremost is the lack of complete, detailed family history information for a portion of subjects. Test requisition forms have a high degree of accuracy regarding personal cancer history, but family history information may be incomplete, particularly for more distant family members (45) or rarer types of cancer. Individuals from LFS kindreds may be unaware of the specifics of their family cancer histories. In a previous study, we demonstrated that only 55% of TP53+ individuals accurately reported LFS-related cancers present in their relatives, and fewer than half would then have been offered TP53 testing (then SGT) based on the family histories they knew (46). It is therefore possible that family history information for TP53+ individuals was especially incomplete. The majority of TP53+ carriers having MGPT performed did have a personal or family cancer history consistent with criteria for at least one inherited cancer syndrome, though not LFS. A different set of biases affect the MGPT cohort, in particular the predominance of women and breast cancer in this data set, though this population is reflective of current cancer genetic testing patterns (47). Missense alterations overall have been a long-standing challenge in TP53 as they account for the majority of reported pathogenic variants, but their true impact is difficult to determine. Extensive analysis of TP53 uncertain variants is beyond the scope of this report, but we observed that TP53 VUS were more frequent among patients with LFS core cancers, and among women with childhood cancers or multiple primary malignancies. Functional assays have begun to address challenges in interpreting the implications of missense alterations, which will reduce the chances of misclassification in future studies (12,36,37).
Another important challenge is introduced by the improved technical performance of the next-generation sequencing used in MGPT. The high-fold coverage allows for the detection of low levels of TP53 mutated variants comprising less than the anticipated 50% of total TP53 DNA for an inherited germline mutation, which may represent germline or somatic mosaicism or clonal hematopoiesis (48–50) secondary to aging, occult malignancy, or chemotherapy effects. Case patients known to have low-level TP53+ results were excluded from this cohort, but the lack of precise criteria for this phenomenon and the absence of supportive data (no skin or other tissue biopsy or segregation data, for example) could have contributed to some misclassification in this report. The issues raised by mosaicism/somatic interference are discussed elsewhere (51). Finally, despite the large number of individuals undergoing genetic testing in these cohorts, the TP53+ population was still too small to permit exploration of genetic modifiers, lifestyle factors, or other potential contributors to phenotypic variation.
Our data further characterize the LFS phenotypic spectrum and shed light on how multigene testing will shape our future understanding of this underrecognized condition. They raise the possibility that expanded phenotypic spectra could emerge for other genes as well. Our data raise the question of how much of current understanding of LFS has been influenced by the high degree of selection that necessarily drove genetic characterization when testing was more expensive. Previous studies of LFS often included families with the most striking cancer histories who were most likely to be mutation positive. These families likely represent the tip of the iceberg, raising the question of whether current LFS cancer risk estimates may be overestimating overall penetrance and underestimating the phenotypic spectrum. In population-based cohorts of patients with breast cancer (43), pediatric and adult-onset sarcoma (19,52,53), and colorectal cancer (54), the few TP53 mutation carriers often did not meet LFS criteria. Well-characterized prospective cohort studies are needed to assess whether a TP53+ result through MGPT in nonclassic LFS families is predictive of future, classic LFS cancers in the individual or kindred.
Despite these data, our recommendation is to manage all germline TP53+ carriers with LFS screening guidelines such as those published by the NCCN, which now include annual whole-body magnetic resonance imaging (MRI) (55). A comprehensive cancer surveillance protocol for TP53+ carriers ascertained through traditional testing schema has been shown to improve overall survival (56,57). Likewise, a recent meta-analysis of results of baseline whole-body MRI completed for cancer surveillance identified localized primary cancer in 7% of 578 TP53+ individuals from 13 cohorts, including one from DFCI (58). Given the potentially devastating consequences of a missed TP53 component tumor diagnosis, germline TP53+ results that are discordant with a clinical history of classic LFS should not be discounted, but genetic counseling should include discussion of the emerging phenotypic heterogeneity associated with TP53+ results from nontraditional testing schema, as well as recommendations for cascade testing of relatives. Our findings also suggest that MGPT and other expanded approaches to germline analyses including whole-exome and genome sequencing may prompt reevaluation of the epidemiology of a range of genetic syndromes.
Funding
Dr. Gelman was funded by Dana-Farber/Harvard Cancer Center Grant No. CA006516.
Notes
The funding source had no role in the design of the study; the collection, analysis, or interpretation of the data; the writing of the manuscript; or the decision to submit the manuscript for publication.
We thank Elizabeth Nguyen for assisting with data management.
Authors Laduca, McFarland, Dalton, Thompson, Speare, Dolinsky, and Chao are employees of Ambry Genetics. Dr. Garber reports receiving research support from Myriad Genetics, Ambry Genetics, and Astra-Zeneca and consulting fees from Helix; her spouse has received consulting fees from Novartis Oncology and Gtx. Drs. Rana and Gelman declare no potential conflict of interest.

