


Abstract
The cost-effectiveness of population-based panel testing for high- and moderate-penetrance ovarian cancer (OC)/breast cancer (BC) gene mutations is unknown. We evaluate the cost-effectiveness of population-based BRCA1/BRCA2/RAD51C/RAD51D/BRIP1/PALB2 mutation testing compared with clinical criteria/family history (FH) testing in unselected general population women.
A decision-analytic model comparing lifetime costs and effects of criteria/FH-based BRCA1/BRCA2 testing is compared with BRCA1/BRCA2/RAD51C/RAD51D/BRIP1/PALB2 testing in those fulfilling clinical criteria/strong FH of cancer (≥10% BRCA1/BRCA2 probability) and all women age 30 years or older. Analyses are presented for UK and US populations. Identified carriers undergo risk-reducing salpingo-oophorectomy. BRCA1/BRCA2/PALB2 carriers can opt for magnetic resonance imaging/mammography, chemoprevention, or risk-reducing mastectomy. One-way and probabilistic sensitivity analysis (PSA) enabled model uncertainty evaluation. Outcomes include OC, BC, and additional heart disease deaths. Quality-adjusted life-years (QALYs), OC incidence, BC incidence, and incremental cost-effectiveness ratio (ICER) were calculated. The time horizon is lifetime and perspective is payer.
Compared with clinical criteria/FH-based BRCA1/BRCA2 testing, clinical criteria/FH-based BRCA1/BRCA2/RAD51C/RAD51D/BRIP1/PALB2 testing is cost-effective (ICER = £7629.65/QALY or $49 282.19/QALY; 0.04 days’ life-expectancy gained). Population-based testing for BRCA1/BRCA2/RAD51C/RAD51D/BRIP1/PALB2 mutations is the most cost-effective strategy compared with current policy: ICER = £21 599.96/QALY or $54 769.78/QALY (9.34 or 7.57 days’ life-expectancy gained). At £30 000/QALY and $100 000/QALY willingness-to-pay thresholds, population-based BRCA1/BRCA2/RAD51C/RAD51D/BRIP1/PALB2 panel testing is the preferred strategy in 83.7% and 92.7% of PSA simulations; criteria/FH-based panel testing is preferred in 16.2% and 5.8% of simulations, respectively. Population-based BRCA1/BRCA2/RAD51C/RAD51D/BRIP1/PALB2 testing can prevent 1.86%/1.91% of BC and 3.2%/4.88% of OC in UK/US women: 657/655 OC cases and 2420/2386 BC cases prevented per million.
Population-based BRCA1/BRCA2/RAD51C/RAD51D/BRIP1/PALB2 testing is more cost-effective than any clinical criteria/FH-based strategy. Clinical criteria/FH-based BRCA1/BRCA2/RAD51C/RAD51D/BRIP1/PALB2 testing is more cost-effective than BRCA1/BRCA2 testing alone.
Our existing health care structure is directed predominantly toward treatment rather than illness prevention. Advances in genomic medicine are being used to guide novel cancer treatment strategies. However, they also offer the opportunity to deliver a new population-based predictive, preventive, personalized, and participatory (P4) medicine strategy for cancer prevention. Traditionally ovarian cancer (OC)/breast cancer (BC) prevention has been targeted at high-risk individuals like BRCA1/BRCA2 mutation carriers. At-risk mutation carriers can opt for risk-reducing salpingo-oophorectomy (RRSO) to reduce their OC risk (1,2), magnetic resonance imaging (MRI)/mammography screening, risk-reducing mastectomy (RRM) (3), or chemoprevention with selective estrogen receptor modulators (SERM) to reduce their BC risk (4), as well as pre-implantation genetic diagnosis (PGD) (5). Identification of mutation carriers (eg, BRCA1/BRCA2) at high risk of OC/BC has involved genetic testing of affected individuals or those from high-risk families in specialized genetics clinics. Clinical criteria/family history (FH) is a surrogate for BRCA probability, with testing offered above a certain threshold. However, clinical criteria/FH-based testing is only moderately effective at identifying mutations and has poor ability to rule out the absence of one (6). We (7) and others (8,9) have shown that this approach misses more than 50% of mutation carriers. Given the effective options available for OC and BC risk management/prevention, this raises serious questions about the adequacy of a clinical criteria/FH-based approach. Additionally, lately, newer intermediate/moderate-risk OC genes RAD51C (10), RAD51D (11), and BRIP1 (OC risk ∼5%–9%) (12) have been identified and their penetrance estimates validated (13,14). Furthermore, our recent modeling work strongly suggests that RRSO would be cost-effective at 4% to 5% OC risk (15,16). This enables clinical utility and supports implementation of clinical testing for these gene mutations. Among the newer moderate-risk BC-genes, PALB2 is the one that confers nonsyndromic quasi-Mendelian susceptibility to BC (BC risk = 44%) (17), for which equivalent interventions (RRM/breast MRI) are now offered to mutation carriers. ATM and CHEK-2 have lower moderate risks (relative risk [RR] ∼ 1.5–2) that don’t justify RRM. Testing for these, though commercially available, is not currently routinely undertaken in clinical practice (18,19).
The limitations of clinical criteria/FH-based ascertainment can be overcome by population-based testing. Next-generation sequencing technologies (20,21) with high-throughput multiplex panel testing, falling costs, and advances in computational bioinformatics has made population testing feasible. In a prospective randomized trial, we showed that compared with FH-based testing, population-based BRCA1/BRCA2 testing in Ashkenazi Jews (AJ) is acceptable, feasible, can be undertaken in a community setting, doesn’t harm psychological health/quality of life, identifies more than 50% of additional carriers, reduces BC and OC incidence, and is extremely cost-effective (incremental cost-effectiveness ratio [ICER] = –£2079/quality-adjusted life-year [QALY]) (7,22). While there is good evidence to support a change in the clinical paradigm from clinical criteria/FH to population-based testing in Ashkenazi Jews (23), a population-based approach has not yet been properly evaluated in the non-Jewish general population. A health-economic assessment is crucial for evaluating and comparing the efficacy of different health interventions. This helps allocate resources across interventions and set policy to improve population health. Here we use a decision analysis model to compare the costs and effects of clinical criteria/FH and population testing approaches for the known high- and moderate-penetrance OC/BC gene mutations BRCA1, BRCA2, RAD51C, RAD51D, BRIP1, and PALB2.
Methods
This analysis was approved by the Genetic Cancer Prediction through Population Screening (GCaPPS) study from the Institute of Child Health/Great Ormond Street Hospital Research Ethics Committee (REC reference number 08/H0713/44).
Decision Model
A decision-analytic model (Figure 1) was developed to compare the lifetime costs and effects of genetically testing all non-Jewish women age 30 years or older for BRCA1, BRCA2, RAD51C, RAD51D, BRIP1, and PALB2 mutations compared with the current practice of clinical criteria/FH-based testing (based on ≥ 10% BRCA1/BRCA2 mutation probability alone) (19). We present separate analyses for both UK and US populations. The standard clinical criteria/FH-based testing for BRCA1/BRCA2 mutations is compared in an incremental fashion with Strategy A: clinical criteria/FH-based panel testing for BRCA1/BRCA2/RAD51C/RAD51D/BRIP1/PALB2 mutations; and Strategy B: population-testing for BRCA1/BRCA2/RAD51C/RAD51D/BRIP1/PALB2 mutations. The model assumes that all women in the population screening arm and only those fulfilling clinical/FH criteria in the FH arm are offered genetic counseling and genetic testing. We assume that 71% will uptake genetic testing (from GCaPPS study) (7). The cost of pretest counseling is included (24,25). BRCA1/BRCA2-negative women are tested for RAD51C/RAD51D/BRIP1/PALB2 mutations (from the same DNA sample). A detailed description of all model assumptions is given in Supplementary Table 1 (available online). The model incorporates the increased risk of cardiovascular mortality (absolute increase = 3.03%) reported with premenopausal bilateral-oophorectomy in women who don’t take hormone replacement therapy (HRT) (26,27). Model outcomes included OC, BC, and excess deaths from heart disease. As per the National Institute of Health and Care Excellence (NICE) economic evaluation guidelines, costs and outcomes are discounted at 3.5% (28).
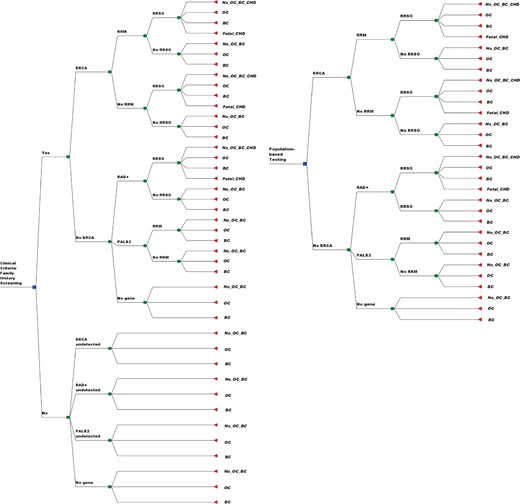
Decision analysis model. The right half of the model reflects a population-based approach to testing from BRCA1, BRCA2, RAD51C, RAD51D, BRIP1, and PALB2 mutations. The left half of the model reflects a clinical criteria/family history–based testing approach for the same. Each decision point in the model is called a “node,” and each path extending from a node is called a decision “branch.” Each branch represents a mutually exclusive course or outcome. Each decision is given a probability highlighted along the decision branch. The probabilities used in the model are explained in Table 1 and Supplementary Table S1 (available online). Values for each outcome are calculated. Cancer incidence was estimated by summing the probabilities of pathways ending in ovarian or breast cancer. Final outcomes of each path include development of breast cancer, ovarian cancer, no breast/ovarian cancer, and excess deaths from coronary heart disease. BC = breast cancer; CHD = coronary haeart disease; ICER = incremental cost-effectiveness ratio; No OC or BC = no ovarian cancer or breast cancer developed; OC = ovarian cancer; QALY = quality-adjusted life-years; RRM = risk-reducing mastectomy; RRSO = risk-reducing salpingo-oophorectomy.
Probabilities
We use the most up-to-date prevalence estimates for BRCA1/BRCA2 (29) and RAD51C, RAD51D (14), BRIP1 (13), and PALB2 (30). The probability of having a positive FH or fulfilling clinical criteria for non-AJ genetic testing is obtained from previously unpublished unselected control population data from the Australian Breast Cancer Family Registry (ABCFR). The different pathway probabilities are specified in Table 1 (explanation in Supplementary Table 2, available online). Cancer incidence was estimated by summing the probabilities of pathways ending in OC or BC. The possibility of both OC and BC occurring simultaneously is rare and presumed close to zero. The potential population impact was calculated by translating reduction in BC and OC incidence obtained across the population of non-AJ UK/US women.
Probabilities of different pathways in the model*
| Probability | Value (95% CI) [range] | Description | Source |
|---|---|---|---|
| P1 | 0.00677 (0.0059 to 0.0077) | BRCA1/BRCA2 mutation prevalence in a general population | Jervis 2015 (29) |
| P2 | 0.47 (0.34 to 0.56) | Probability that carrier will undergo RRM | Evans 2009 (82) |
| P3 | 0.96 [0.8–0.96] | Reduction in risk of ovarian cancer from RRSO | Finch 2006 (1), Rebbeck 2009 (2) |
| P4 | 0.202 [0.17–0.28] | Probability that BRCA1/BRCA2 carrier without RRSO will get ovarian cancer | Antoniou 2008 BOADICEA (83), Chen 2007 (84) |
| P5 | 0.02 (0.001 to 0.06) | Probability that a noncarrier will get ovarian cancer | CRUK 2015 (85) |
| 0.0128 (0.0126 to 0.0130) | Probability that a noncarrier will get ovarian cancer—US estimate | SEER (86) | |
| P6 | 0.0098 (0.0047 to 0.0179) | Probability of having a positive FH fulfilling non-AJ genetic testing criteria | ABCFR data |
| P7 | 0.1 | BRCA1/BRCA2 prevalence in those fulfilling clinical criteria or FH-positive individuals | Current testing guideline |
| P8 | 0.0056 (0.0049 to 0.0066) | BRCA1/2 mutation prevalence in FH-negative individuals | Jervis 2015 (29), ABCFR data |
| P9 | 0.911 (0.62 to 0.98) | Reduction in breast cancer risk from RRM without RRSO in BRCA1/2 carriers | Rebbeck 2004 (3) |
| P10 | 0.644 [0.42–0.67] | Probability that BRCA1/2 carriers without RRM will get breast cancer | Antoniou 2008 BOADICEA (83), Chen 2007 (84) |
| P11 | 0.129 [0.11–0.14] | Probability that a non-BRCA1/2 carrier will get breast cancer with screening | CRUK 2015 (85) |
| 0.124 (0.1236 to 0.1249) | Probability that a non-BRCA1/2 carrier will get breast cancer with screening—US estimate | SEER (86) | |
| P12 | 0.55 (0.30 to 0.75) | Probability that mutation carrier will follow up with RRSO | Manchanda 2012 (87) |
| P13 | 0.49 (0.37 to 0.65) | HR for breast cancer from RRSO alone in BRCA1/BRCA2 carriers | Rebbeck 2009 (2) |
| P14 | 0.95 (0.78 to 0.99) | Reduction in risk of breast cancer from RRM with RRSO in BRCA1/BRCA2 carriers | Rebbeck 2004 (3) |
| P15 | 0.002 (0.0003 to 0.0036) | RAD51C, RAD51D, BRIP1 mutation prevalence in unselected general population controls | Song 2015 (14), Ramus 2015 (13) |
| P16 | 0.089 (0.05 to 0.17) | Probability that RAD51C, RAD51D, BRIP1 carriers without RRSO will get ovarian cancer | Loveday 2012 (10), Loveday 2011 (11), Ramus 2015 (13) |
| P17 | 0.94 (0.83 to 0.98) | Reduction in ovarian cancer risk from RRSO in RAD51C, RAD51D, BRIP1 | Parker 2013 (26) |
| P18 | 0.62 (0.53 to 0.74) | HR of breast cancer from RRSO alone in RAD51C, RAD51D, BRIP1 | Parker 2009 (88) |
| P19 | 0.0122 (0.0074 to 0.017) | RAD51C, RAD51D, BRIP1 mutation prevalence in FH-positive (BRCA1/2-negative) individuals | Song 2015 (14), Ramus 2015 (13) |
| P20 | 0.00186 (0.00023 to 0.0034) | RAD51C, RAD51D, BRIP1 Mutation prevalence in FH-negative individuals | Song 2015 (14), Ramus 2015 (13) and ABCFR data |
| P21 | 0.0303 (0.011 to 0.043) | Risk of mortality from CHD after RRSO | Parker 2013 (26) |
| P22 | 0.8 (0.76 to 0.83) | Compliance with HRT | Read 2010 (89) |
| P23 | 0.71 (0.60 to 0.83) | HR of breast cancer risk from chemoprevention | Cuzick 2015 (90) |
| P24 | 0.163 (0.136 to 0.19) | Uptake of breast cancer chemoprevention | Smith 2016 (91) |
| P25 | 0.00125 (0.0008 to 0.0017) | PALB2 mutation prevalence in unselected general population controls | Slavin 2017 (30) |
| P26 | 0.44 (0.34 to 0.55) | Probability that PALB2 carriers without RRM will get breast cancer | Antoniou 2014 (17) |
| P27 | 0.0089 (0.0079 to 0.0099) | PALB2 mutation prevalence in FH-positive (BRCA1/2-negative) individuals | Buys 2017 (92) |
| P28 | 0.0012 (0.00073 to 0.0016) | PALB2 mutation prevalence in FH-negative individuals | ABFCR data, Buys 2017 (92), Slavin 2017 (30) |
| P29 | 0.0072 (0.0068 to 0.0076) | Excess risk of CHD after RRSO | Parker 2013 (26) |
A detailed explanation of the various probabilities is given in Supplementary Table 1 (available online). ABCFR = Australian Breast Cancer Family Registry; CHD = coronary heart disease; CI = confidence interval; CRUK = Cancer Research UK; FH = family history; HRT = hormone replacement therapy; RRM = risk-reducing mastectomy; RRSO = risk-reducing salpingo-oophorectomy.
Costs
All costs (Supplementary Table 3, available online) are reported at 2014 prices (31) and derived from a health care system/payer’s perspective. Costs were converted wherever needed using the Hospital and Community Health Service Index (32). As per NICE recommendations, future health care costs not associated with OC/BC or cardiovascular disease were not considered (28).
Life-Years
The analysis has a lifetime time horizon covering lifetime risks as well as long-term consequences. Female lifetables from the Office of National Statistics (UK women) and Surveillance, Epidemiology, and End Results (SEER; US women) were used for life expectancy data for women not developing OC/BC (33). To simplify the analysis, we used average estimates for ages of onset and survival for BRCA1/BRCA2-related BC and OC. Details of ages of onset and survival estimates used are in Supplementary Table 4 (available online). The average ages for BC/OC were 44.4/59.6 years, respectively, for BRCA1+BRCA2 carriers (34). The median ages of onset of sporadic OC/BC were 68/60 and 63/62 years in the US and US populations, respectively (from CRUK/SEER) (35–37). OC/BC outcomes were modeled using 10-year survival data.
Quality-Adjusted Life-Years
QALYs are recommended by NICE as the most suitable summary measure for economic evaluation of health outcomes. They adjust changes in length of life by potential alterations in quality of life, and thus reflect both mortality and health-related quality-of-life effects (28). QALY = (survival in life-years) × (utility weight). Calculating QALYs requires knowledge of utility weights for each health state in the model. Utility weight is an adjustment for quality of life. It indicates an individual’s preference for a specific health state where 1 = perfect health and 0 = death. The utility scores used are described in Supplementary Table 5 (available online).
Analysis
Figure 1 illustrates the decision model. Path probabilities (Supplementary Figure 1, available online) were multiplied to calculate each branch probability. The total costs and effects in terms of life-years and QALYs were estimated by weighting the values for each branch by the branch probability. The ICER was estimated by dividing the difference in cost by the difference in effect between strategies. ICER = (cost A – cost B)/(effect A – effect B). This ICER obtained is compared with the cost-effectiveness willingness-to-pay (WTP) thresholds from NICE of less than £30 000/QALY (UK analysis) (38) and US $100 000/QALY (US analysis) (39,40) to determine whether or not population screening for all women can be cost-effective compared with clinical criteria/FH-based testing. Additional scenario analyses were also undertaken: 1) no benefit of reduction in BC risk, 2) varying genetic testing costs to define UK and US cost thresholds for cost-effectiveness, 3) higher all-cause mortality from premenopausal oophorectomy, and 4) lower RRSO/RRM uptake.
Sensitivity analyses explored uncertainty in results and robustness of the model. In a one-way sensitivity analysis, each model parameter is varied individually to evaluate impact on results. Probabilities/utility weights were varied according to 95% confidence intervals/range, where available, or by +/−10%. Costs were varied by +/−30%. Given that model parameters/variables are likely to vary in parallel rather than independently, probabilistic sensitivity analysis (PSA) was also undertaken (28,41). It permits variables to be varied simultaneously across their distributions and is recommended by NICE (28). The PSA was fitted with appropriate distributions recommended in the literature (probabilities = beta; costs = gamma; utilities = log-normal) (42). A cost-effectiveness acceptability curve plotted the result of 10 000 simulations for all strategies. It depicts the proportion of cost-effective simulations for each strategy at the various WTP thresholds. The sum of the (cost-effective) proportions for all strategies taken together at any given WTP threshold is always 1.
Results
The comparison of decision model outcomes of the three different testing strategies for undiscounted and discounted lifetime costs, life-years (survival), and QALYs is given for both UK and US women in Table 2. Discounting reduces the overall cost difference as well as gain in life-years/QALYs. This is because future costs/outcomes are adjusted by discounting and cost-savings, which are generated through preventing future BCs/OCs, which are considered lower in value. Our results show that both newer strategies are cost-effective compared with the current clinical criteria/FH-based BRCA1/BRCA2 testing policy. Compared with clinical criteria/FH-based BRCA1/BRCA2 testing, clinical criteria/FH-based panel testing for BRCA1/BRCA2/RAD51C/RAD51D/BRIP1/PALB2 mutations is highly cost-effective: ICER = £7629.65/QALY or $49 282.19/QALY (0.04 days’ life-expectancy gained). A population-based panel testing strategy for BRCA1/BRCA2/RAD51C/RAD51D/BRIP1/PALB2 mutations is the most cost-effective strategy compared with current policy: ICER = £21 599.96/QALY (9.34 days’ life-expectancy gained) or $54 769.78/QALY (7.57 days’ life-expectancy gained).
Model outcomes for the different genetic testing strategies: Undiscounted and discounted costs, QALYs and ICER per QALY
| Undiscounted | Discounted | |||||||
|---|---|---|---|---|---|---|---|---|
| Strategy | Cost (UK = £, US = $) | Life-years | QALYs | Cost (UK = £, US = $) | Life-years | QALYs | ICER in £/QALY or $/QALY | |
| UK estimates | Standard FH-based testing for BRCA1/BRCA2 mutations* | £4423.25 | 52.2850 | 52.0822 | £1586.11 | 23.7621 | 23.6909 | –* |
| FH-based testing for BRCA1/BRCA2, RAD51C, RAD51D, BRIP1, PALB2 mutations | £4423.23 | 52.2851 | 52.0823 | £1586.38 | 23.7621 | 23.6909 | £7629.65 | |
| Population testing for BRCA1/BRCA2, RAD51C, RAD51D, BRIP1, PALB2 mutations | £4586.86 | 52.3107 | 52.1116 | £1779.73 | 23.7693 | 23.6999 | £21 599.96 | |
| US estimates | Standard FH-based testing for BRCA1/BRCA2 mutations* | $19 252.85 | 52.5063 | 52.3139 | $6795.73 | 23.8127 | 23.7478 | –* |
| FH-based testing for BRCA1/BRCA2, RAD51C, RAD51D, BRIP1, PALB2 mutations | $19 253.14 | 52.5064 | 52.3140 | $6797.35 | 23.8128 | 23.7479 | $49 282.19 | |
| Population testing for BRCA1/BRCA2, RAD51C, RAD51D, BRIP1, PALB2 mutations | $19 515.76 | 52.5271 | 52.3386 | $7207.90 | 23.8185 | 23.7553 | $54 769.78 | |
Reference strategy. FH = family history; ICER = incremental cost-effectiveness ratio; QALY = quality-adjusted life-years.
Results of the one-way sensitivity analysis (Figure 2; Supplementary Figures 2 and 3, available online) indicate that for Strategies A and B, model outcomes are not impacted that much by different model parameters (Supplementary Tables 2 and 3, available online), mutation prevalence, surgical prevention costs, utility scores, or treatment of OC/BC or cardiovascular disease. Despite varying parameters at extremes of their confidence intervals/ranges, the model remains cost-effective at the less than £30 000/QALY or $100 000/QALY thresholds. The model is cost-effective at the lower limits of RRSO (30%) and RRM (34%).
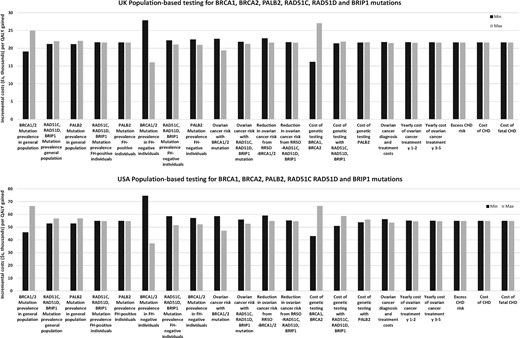
One-way sensitivity analysis: population screening for BRCA1, BRCA2, RAD51C, RAD51D, BRIP1, and PALB2 mutations in UK and US women. One-way sensitivity analysis for all probabilities, costs, and utilities in terms of ICER of UK and US population-based screening for BRCA1, BRCA2, RAD51C, RAD51D, BRIP1, and PALB2 mutations compared with a clinical criteria/family history–based approach for BRCA1 and BRCA2 testing. Y-axis: incremental cost-effectiveness ratio: cost (£ or $) per quality-adjusted life-year (discounted). X-axis: probability, cost, and utility parameters in the model. The model is run at both lower and upper values/limits of the 95% confidence interval or range of all probability parameters described in Table 1/the “Methods,” and both lower and upper values/limits of the cost and utility score parameters given in Table 2. Costs are varied by +/− 30%. “Maximum value” represents outcomes for the upper limit, and “minimum value” represents outcomes for the lower limit of the parameter.
PSA results (Figures 3 and 4) show that at £30 000/QALY, WTP threshold population testing for all gene mutations (Strategy B) is the preferred strategy in 83.7% of simulations and that clinical criteria/FH-based panel testing for all gene mutations (Strategy A) is preferred only in 16.2% of simulations. Correspondingly, in American women, strategy B is the preferred strategy, at $100 000/QALY WTP threshold, in 92.7% of simulations. A population testing strategy is more cost-effective than any clinical criteria/FH testing strategy, with Strategy B emerging as the most cost-effective. Taken together, this clearly indicates the cost-effectiveness and overall preference for a population testing approach for BRCA1/BRCA2/RAD51C/RAD51D/BRIP1/PALB2 mutations in the general population.
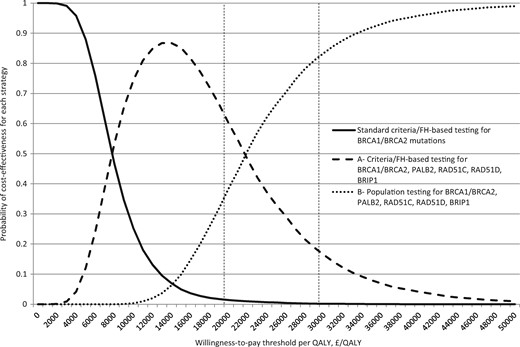
Probabilistic sensitivity analysis: UK women. Probabilistic sensitivity analysis in which all model parameters/variables are varied simultaneously across their distributions to further explore model uncertainty. X-axis: incremental cost-effectiveness ratio in terms of cost (£)/quality-adjusted life-year. Y-axis: proportion of simulations. The results of 10 000 simulations were plotted on a cost-effectiveness acceptability curve showing the proportion of simulations (y-axis) that indicated that the intervention was cost-effective at different willingness-to-pay thresholds (x-axis). The dotted line in Figure 4 marks the proportion of simulations found to be cost-effective at the £30 000 UK threshold used by the National Institute of Health and Care Excellence. Bold line curve: standard clinical criteria/family history–based testing for BRCA1/BRCA2 mutations. Curve A: clinical criteria/family history–based testing for BRCA1, BRCA2, RAD51C, RAD51D, BRIP1, and PALB2 mutations. Curve B: population-based screening for BRCA1, BRCA2, RAD51C, RAD51D, BRIP1, and PALB2 mutations. At any given point on the willingness-to-pay threshold scale, the sum of proportion of cost-effective simulations for all three strategies is always 1. At the £30 000/quality-adjusted life-year willingness-to-pay threshold, 16.2% simulations are cost-effective for clinical criteria/family history–based testing for all gene mutations (curve A) and 83.7% simulations are cost-effective for population testing for all gene mutations (curve B). A population testing strategy is more cost-effective than any clinical criteria/FH testing strategy.
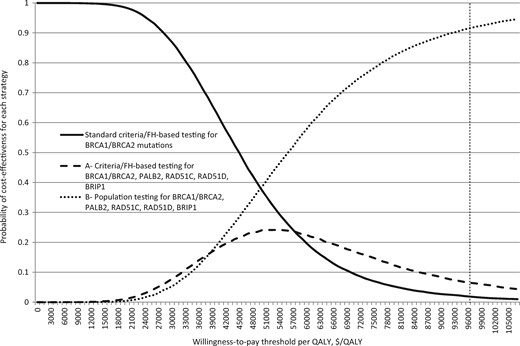
Probabilistic sensitivity analysis: US women. Probabilistic sensitivity analysis in which all model parameters/variables are varied simultaneously across their distributions to further explore model uncertainty. X-axis: incremental cost-effectiveness ratio in terms of cost ($)/quality-adjusted life-year (QALY). Y-axis: proportion of simulations. The results of 10 000 simulations were plotted on a cost-effectiveness acceptability curve showing the proportion of simulations (y-axis) that indicated that the intervention was cost-effective at different willingness-to-pay (WTP) thresholds (x-axis). The dotted line marks the proportion of simulations found to be cost-effective at the $100 000 US WTP threshold. Curve with bold line: standard clinical criteria/family history–based testing for BRCA1/BRCA2 mutations. Curve A: clinical criteria/family history–based testing for BRCA1, BRCA2, RAD51C, RAD51D, BRIP1, and PALB2 mutations. Curve B: population-based screening for BRCA1, BRCA2, RAD51C, RAD51D, BRIP1, and PALB2 mutations. At any given point on the WTP threshold scale, the sum of proportion of cost-effective simulations for all three strategies is always 1. At the $100 000/QALY WTP threshold, 5.8% simulations are cost-effective for clinical criteria/family history–based testing for all gene mutations (curve A), and 92.7% simulations are cost-effective for population testing for all gene mutations (curve B). A population testing strategy is more cost-effective than any criteria/family history testing strategy.
Scenario analyses are presented in Table 3. The alternative Strategies A and B still remain cost-effective at the UK/US WTP thresholds compared with the current clinical strategy, even if there is no reduction in BC risk from RRSO (ICER = £27 632.95/QALY or $72 221.37/QALY) and for lower RRM and RRSO rates. Population testing remains cost-effective until the genetic testing costs rise to £250/test or $772/test.
Scenario analysis: UK and US model outcomes for different scenarios
| Scenario analysis | ||||||||
|---|---|---|---|---|---|---|---|---|
| UK estimates | US estimates | |||||||
| Strategy A* | Strategy B† | Strategy A* | Strategy B† | |||||
| Scenarios | ICER/QALY, £ | LE gained, d | ICER/QALY, £ | LE gained, d | ICER/QALY, $ | LE gained, d | ICER/QALY, $ | LE gained, d |
| No reduction in BC risk from RRSO (p13 = 1, p18 = 1) | 9540.39 | 0.04 | 27 632.95 | 7.8 | 57 693.62 | 0.04 | 72 221.37 | 6.5 |
| Lowest cost-effective RRM (p2) uptake rate: p2 = 19% (UK), p2 = 8% (US) | 16 564.53 | 0.03 | 29 985.08 | 7.3 | 151 005.84 | 0.024 | 99 851.74 | 5.6 |
| Lowest cost-effective RRSO (p12) uptake rate: p12 = 22% (UK), p2 = 13% (US) | 7298.79 | 0.03 | 29 970.42 | 6.4 | 71 788.24 | 0.024 | 99 969.56 | 4.1 |
| Lower RRM (p2) plus RRSO (p12) cost-effective rates: UK (p2 = 36%; p12 = 36%); (p2 = 32%; p12 = 32%) | 9965.86 | 0.03 | 29 984.88 | 6.8 | 93 684.20 | 0.03 | 99 653.60 | 4.8 |
| Genetic testing cost £250 or $772 (thresholds at which population testing remains cost-effective) | 7629.65 | 0.04 | 29 896.23 | 9.4 | 49 282.19 | 0.04 | 99 947.44 | 7.6 |
Strategy A: FH-based testing for BRCA1, BRCA2, RAD51C, RAD51D, BRIP1, and PALB2 mutations. BC = breast cancer; ICER = incremental cost-effectiveness ratio; LE = life expectancy; QALY = quality-adjusted life-year; RRM = risk-reducing mastectomy; RRSO = risk-reducing salpingo-oophorectomy.
Strategy B: Population testing for BRCA1, BRCA2, RAD51C, RAD51D, BRIP1, and PALB2 mutations.
BRCA1/BRCA2/RAD51C/RAD51D/BRIP1/PALB2 testing can prevent 1.86%/1.91% of BC and 3.2%/4.88% of OC in UK/US women: 657/655 OC cases and 2420/2386 BC cases prevented per million. The overall proportion and number of BC/OC cases prevented as well as excess cardiovascular deaths from general (non-Jewish) population-based BRCA1/BRCA2/RAD51C/RAD51D/BRIP1/PALB2 testing are given in Table 4.
Overall impact of general (non-Jewish) population testing for BRCA1/BRCA2/ RAD51C/RAD51D/BRIP1/PALB2 mutations in women older than age 30 years*
| Population testing for BRCA1/BRCA2/ RAD51C/RAD51D/BRIP1/PALB2 mutations | UK women | US women |
|---|---|---|
| Proportion of BC cases prevented, % | 1.86 | 1.91 |
| No. of BC cases prevented per million women | 2420 | 2386 |
| No. of BC cases prevented in the total population (26.65M UK and 99.6M US women) | 64 493 | 237 610 |
| No. of deaths from BC prevented per million women | 523 | 367 |
| No. of deaths from BC prevented in the total female population | 13 930 | 36 591 |
| Proportion of OC cases prevented, % | 3.20 | 4.88 |
| No. of OC cases prevented per million women | 657 | 655 |
| No. of OC cases prevented in the total population (26.65M UK and 99.6M US women) | 17 505 | 65 221 |
| No. of OC deaths prevented per million | 461 | 460 |
| No. of OC deaths prevented in the total female population | 12 298 | 45 857 |
| No. of excess deaths from heart disease per million women | 25 | 25 |
| No. of excess deaths from heart disease in the total population (26.65M UK and 99.6M US women) | 666 | 2490 |
Discussion
Our analysis for the first time addresses the important topical issue of cost-effectiveness of a population-based strategy for testing moderate/high-penetrance OC/BC gene mutations in the general population. It justifies cost differences for different interventions by providing QALY-based health outcomes. This is required to guide policy decisions on health care resource allocation for disease prevention. Our findings that a population-based genetic testing strategy for OC/BC gene mutations outperforms any clinical criteria or FH strategy, with 84% to 93% of simulations being cost-effective on PSA (£30 000/QALY and $100 000/QALY thresholds), are extremely noteworthy. Such a population-based program implemented in women older than age 30 years could result in 17 505/65 221 fewer OC and 64 493/237 610 fewer BC cases in British/American women, respectively. This can have a much greater impact on the burden of disease than any current treatment strategy. Our data also highlight the need to move from BRCA1/BRCA2 testing to panel testing, incorporating additional RAD51C/RAD51D/BRIP1/PALB2 mutations within a clinical criteria/FH-based strategy itself. These results have important implications for clinical care and OC/BC prevention. They could also be valuable to program evaluators/managers, policy makers, and health care commissioners.
Long and Ganz (43) used our AJ decision analysis model (22) to evaluate systematic BRCA1/BRCA2 testing in the general non-Jewish population and found it not to be cost-effective (43). However, AJ estimates/parameters should not be used to evaluate general population testing, which may be a reason that their analysis gives apparently incorrect/different results. For example, they use AJ estimates for prevalence of FH of cancer. However, clinical/FH criteria are far more stringent and prevalence of such individuals is much lower in the general compared with the AJ population. These data were previously unpublished and obtained from the ABCFR control population for our analysis. Additionally, our current model and analysis are different and more comprehensive, use general non-AJ estimates, and compare two new panel testing strategies with the current gold standard of clinical criteria/FH-based BRCA1/BRCA2 testing.
Our analysis has several advantages. It fulfills various principles listed by NICE for economic analyses including preferred type of economic evaluation (28). We use the NICE guideline and clinical criteria–based current BRCA1/BRCA2 testing policy as the best practice comparator. Additionally, QALYs are used to measure health effects, utilities are incorporated, and costs and outcomes discounted at 3.5%. Model parameters are derived from well-established/proven information from the literature and up-to-date data from the PROMISE program, GCaPPS study, and Australian BC registry. The time horizon is sufficient to reveal important differences in costs and outcomes, and costs of pretest counseling plus testing are included. Apart from OC/BC outcomes, we also included excess coronary deaths from premenopausal oophorectomy (26). To avoid overestimating the advantages of population testing, we used conservative costs for OC/BC diagnosis, treatment, and management of recurrence (44). The extensive sensitivity analysis presented adds rigor to the results. Costs of counseling, RRSO, chemoprevention, and treatment of OC/BC/coronary disease do not influence the overall results. The results remain cost-effective even at extremes of BRCA1/BRCA2 prevalence/penetrance estimates. Our analysis also highlights the need for better precision around the prevalence and penetrance estimates of RAD51C/RAD51D/BRIP1/PALB2 mutations as the confidence intervals for these are extremely wide. This requires further research.
A limitation may be considering only cardiovascular mortality (not morbidity) from early oophorectomy. However, we include costs for all excess cardiovascular disease, and one-way sensitivity analysis shows that these parameters don’t substantially impact results. Another limitation may be our exclusion of increased lung/colorectal cancer mortality from premenopausal oophorectomy reported in the Nurses Health Study (26). However, this finding was not validated/reproduced in the 337 802 women EPIC study (45). Additionally, this excess mortality is confounded by smoking/risk-related behaviors. The NIH-AARP Diet and Health Study found that oophorectomy-associated increased lung cancer risk was limited to smokers (46). Additionally, cardiovascular risk can also be confounded by smoking. Besides, the cohort data show that RRSO is associated with an overall 77% reduction in all-cause mortality (47), which will further improve cost-effectiveness. Nevertheless, even if we assumed a higher all-cause mortality (1:8), the model remains cost-effective for population screening (ICER = £22 820/QALY and $58 561/QALY, 8.7 and 6.9 days’ life-expectancy gained).
We assume a 71% uptake of genetic testing. However, the true uptake in non-AJ women needs to be addressed in future studies. Acceptability/uptake of population-based panel testing is being assessed by us in the PROMISE pilot study (48). Premature surgical menopause is associated with worse sexual functioning and vasomotor symptoms without decreasing generic quality of life (49–52). While HRT ameliorates detrimental consequences of premature menopause, symptom levels are still higher in those retaining their ovaries (51). This can be offset by reduced cancer worry, decrease in perceived risk, and high satisfaction rates found with surgical prevention (49,50). These issues, along with a small (∼3%–4%) complication rate (53), should be part of informed consent and the RRSO decision-making process. While we assume 80% HRT compliance, the true compliance in a larger population-based cohort remains to be determined. It is important for these women to have long-term follow-up and monitoring of bone/cardiovascular health and receive psychosexual support.
The utility of concomitant hysterectomy along with RRSO has been debated. Proponents of hysterectomy cite the benefits of estrogen-alone HRT (no increased BC/heart disease risk) (54) and avoiding cervical smears. The impact and context of HRT in women undergoing premenopausal oophorectomy is completely different than that of older postmenopausal Women's Health Initiative (WHI) women. Short-term HRT in BRCA1/BRCA2 carriers undergoing premenopausal oophorectomy doesn’t increase BC risk (55). HRT is protective for heart disease in premenopausal oophorectomized women (26,27), will be stopped at age 50 years (age of menopause), and does not increase cardiovascular risk in the postmenopausal postintervention phase (54). Hysterectomy has higher morbidity, complication rates, and costs, longer operating time, and longer hospital stay/recovery. Hysterectomy is not routinely offered as an alternative to progesterone HRT or to tamoxifen in BC. With tamoxifen, the absolute increase in endometrial cancer (EC) risk is small (56), and The American Congress of Obstetricians and Gynecologists (ACOG)/Royal College of Obstetricians and Gynaecologists (RCOG) guidelines only recommend urgent investigation of unscheduled/abnormal bleeding (57,58). Recent reports suggest increased serous EC risk in BRCA1 (59,60). However, serous EC comprises approximately 7% of overall EC (61), the number of cases was low, confidence intervals were wide, absolute EC risk (∼3%) remained small, and overall EC risk was not statistically significantly increased (59,60). A recent cost-effectiveness analysis had limitations. It only included women undergoing mastectomy and lacked a disutility for hysterectomy (62). Further corroborating data are needed, and the issue of hysterectomy may then need revisiting. The risk-benefit profile doesn’t currently justify routine hysterectomy at RRSO for OC risk reduction (63), and most centers don’t practice this.
In line with a number of analyses in high-risk (2,64,65) and low-risk (66) women, our base model incorporates a reduction in BC risk with premenopausal oophorectomy. Conversely, a recent Dutch article (67) found no such effect. However, the follow-up was short (3.2 years) (67), and longer follow-up data are awaited. Nevertheless, our scenario analysis reconfirms the cost-effectiveness of Strategy A and Strategy B even if premenopausal oophorectomy doesn’t decrease BC risk. RAD51C/RAD51D/PALB2 have been considered single cancer genes only. However, should future evidence show both increased OC and BC, it would increase the cost-effectiveness of population testing.
Our model incorporates the impact of breast screening already prevalent and RRM. While RRM is weighted for a 21% complication rate, any reduction in QALYs is not included. Although RRM is linked with a negative impact on body image and sexual pleasure, no detrimental impact on sexual activity, habit, discomfort (68), anxiety, depression, or quality of life was reported (68–70). Besides, adverse consequences may be balanced by decreased anxiety, increased social activity (68), and high cosmetic satisfaction rates (69,71–73).
Genomic, clinical, and biological information is being combined through precision medicine initiatives like the 100 000 Genomes (74) and Moonshot (75) projects to optimize clinical decisions for personalized treatment. Importantly, these advances also offer the opportunity for personalized cancer prevention. This can have a much bigger impact on reducing the burden of disease but requires a shift in focus to the unaffected population. We show for the first time that the introduction of systematic genetic testing in the general population for BRCA1/BRCA2/RAD51C/RAD51D/BRIP1/PALB2 mutations is a cost-effective strategy that can reduce OC and BC incidence and save lives. This form of panel testing can potentially be expanded to include other gene mutations with established clinical utility for cancer prevention. Our findings pave the way for research studies in carriers ascertained through population means to evaluate and understand impact on psychological health, quality of life, and long-term health behavior and reconfirm uptake rates of screening/surgical prevention strategies. Additionally, big service redesign and implementation issues affecting major system change/intervention outcomes (76,77) need addressing before introducing such a program. Furthermore, a robust system/platform for monitoring and reclassifying (as required) variants of uncertain significance detected needs establishing. Other issues that need addressing include raising public/health professional awareness, education, delivery logistics, quality control, call-recall mechanisms, and fail-safe checks/processes for quality assurance. All these have additional costs. Further development/expansion of coordinated/integrated clinical pathways between primary and tertiary care involving general practitioners, geneticists, gynecologists, and breast teams are needed for managing high-risk women. Given the extreme cost-effectiveness (78) of AJ population BRCA testing, panel testing incorporating additional OC/BC genes would be cost-effective too and should be considered. The global cancer burden is expected to rise by 75% (79), and the number of BC/OC cases by 24%/27% in the United Kingdom and 34%/39% in the United States, respectively, by 2035 (80). Cancer prevention is the key to achieving long-term transformational change and cost-efficiencies in our health system. It is important that we seize the opportunity to facilitate implementation of genomics for cancer prevention in health care.
Funding
The study was funded by The Eve Appeal charity. The study is supported by researchers at the Barts Cancer Institute Cancer Research UK Centre for Excellence, Queen Mary University of London (C16420/A18066).
Notes
The funding body (The Eve Appeal charity) had no role in the study design, data collection, analysis, or interpretation, the writing of the report, or the decision to submit for publication. The research team was independent of funders.
RM developed the concept and design of the study. RM and RL developed the model. RM, RL, SP, VSG, AA, SS, RJM, JH, and CT were involved in the health economic and statistical analysis. JLH, RJM, AA, AL, SG, SR, and PDPP contributed data to the analysis. RM, RL, SP, and VSG prepared the tables and figures. RM and RL prepared the initial draft of the manuscript. All authors critically contributed to writing the manuscript and approved the final version of the manuscript.
IJ and UM have a financial interest in Abcodia, Ltd., a company formed to develop academic and commercial development of biomarkers for screening and risk prediction. IJ is a member of the board of Abcodia Ltd, a Director of Women’s Health Specialists Ltd, and received consultancy fees from Beckton Dickinson. RM declares research funding from The Eve Appeal and Cancer Research UK in population testing and from Barts and the London Charity outside this work, as well as an honorarium for grant review from the Israel National Institute for Health Policy Research. The other authors declare no conflicts of interest.
References
Annual estimates of the resident population by single year of age and sex for the United States: April 1, 2010 to July 1, 2016.

