


Abstract
Alternative polyadenylation (APA) is emerging as a major post-transcriptional mechanism for gene regulation, and dysregulation of APA contributes to several human diseases. However, the functional consequences of APA in human cancer are not fully understood. Particularly, there is no large-scale analysis in cancer cell lines.
We characterized the global APA profiles of 6398 patient samples across 17 cancer types from The Cancer Genome Atlas and 739 cancer cell lines from the Cancer Cell Line Encyclopedia. We built a linear regression model to explore the correlation between APA factors and APA events across different cancer types. We used Spearman correlation to assess the effects of APA events on drug sensitivity and the Wilcoxon rank-sum test or Cox proportional hazards model to identify clinically relevant APA events.
We revealed a striking global 3’UTR shortening in cancer cell lines compared with tumor samples. Our analysis further suggested PABPN1 as the master regulator in regulating APA profile across different cancer types. Furthermore, we showed that APA events could affect drug sensitivity, especially of drugs targeting chromatin modifiers. Finally, we identified 1971 clinically relevant APA events, as well as alterations of APA in clinically actionable genes, suggesting that analysis of the complexity of APA profiles could have clinical utility.
Our study highlights important roles for APA in human cancer, including reshaping cellular pathways and regulating specific gene expression, exemplifying the complex interplay between APA and other biological processes and yielding new insights into the action mechanism of cancer drugs.
3’ end processing and polyadenylation is an essential step of messenger RNA (mRNA) maturation. Recent transcriptome-wide studies have revealed at least 70% of human genes contain multiple polyadenylation sites, suggesting that alternative polyadenylation (APA) is highly prevalent (1,2). The 3’ untranslated region (3’ UTR) of mRNA harbors key RNA regulatory elements (3). Therefore, APA provides a means to engage or evade 3’ UTR mediated regulatory controls on mRNA metabolism (2,4). A large number of APA factors are required for appropriate polyadenylation processing, including cleavage and polyadenylation specificity factor (CPSF), cleavage stimulation factor (CSTF), cleavage factors I and II (CFI and CFII), as well as the poly(A) polymerase and other associated factors (5).
APA is dynamically regulated in response to a variety of physiological conditions (6,7), and recent studies have highlighted the important role of APA in cancer (8–11). However, the regulation and functional consequences of APA alterations in tumorigenesis are not fully understood. Here, we systematically analyzed global patterns of APA events in samples from The Cancer Genome Atlas (TCGA) (12) and Cancer Cell Lines Encyclopedia (CCLE) (13).
Methods
Data Resource
We downloaded pair-ended RNA-seq BAM files of 5838 patients tumor samples across 17 TCGA cancer types and 560 paired nontumor tissues samples (if avaliable), as well as 739 RNA-seq BAM files of cancer cell lines from the National Cancer Institute’s Genomic Data Commons (GDC) (https://gdc.cancer.gov) (12–14), as previously described (15). We also downloaded the gene expression data from GDC. In addition, we obtained the RNA-seq files of 531 samples from three other large-scale independent studies, including lung adenocarcinoma, renal cell carcinoma, and glioblastomas (16–18). To avoid the potential batch effects introduced by gene expression quantification, we recalculated gene expression as reads per kilobase per million mapped reads (RPKM) across all TCGA and CCLE samples. We then normalized the expression data using quantile normalization (19). We further obtained the RNA-seq files of 8 cancer cell lines from ENCODE (ENCSR000EYR, ENCSR310FIS, ENCSR000CPT) (20) and GEO (GSE42420) (9). We obtained the tumor purity data (21) and clinically actionable genes (22) from previous studies.
Characterization of APA Events From RNA-Seq Data
To characterize the dynamic APA events using standard RNA-seq from TCGA data sets, we utilized the well-established algorithm DaPars (https://github.com/ZhengXia/DaPars) to identify the alternative proximal polyA site and calculate the Percentage of Distal polyA site Usage Index (PDUI) for each transcript. Detailed methods are in the Supplementary Materials (available online).
Analysis of APA Core Factors and APA Events
To explore the correlation between APA factors and APA events in tumor samples across different cancer types with sample sizes of 100 or greater, we built a linear regression model to assess the relationship between the expression of APA factors and PDUI for each transcript. Detailed methods are in the Supplementary Materials (available online).
Effects of APA Events on Drug Sensitivity
To assess the effects of APA events on drug sensitivity, we downloaded the drug sensitivity data from the CCLE (http://www.broadinstitute.org/ccle/home) data portal (13) and Cancer Therapeutics Response Portal (CTRP; http://portals.broadinstitute.org/ctrp) (23). We used Spearman correlation to calculate the correlations between the PDUI of transcripts and the IC50 from CCLE or the area under the curve (AUC) from CTRP, as previous described (24). Please see the Supplementary Methods (available online).
Identification of Clinically Relevant APA Events
The clinically relevant APA events were identified as previously described (24). We obtained the clinical information associated with tumor samples, including tumor subtypes (defined as a distinct groups of patients based on molecular features or clinical features), disease stage (the extent of a cancer in the body, which is usually based on the size of the tumor), and patient overall survival time (range = 1–10 870 days) from TCGA maker papers or the GDC data portal (https://gdc-portal.nci.nih.gov/) (24,25). Please see the Supplementary Methods (available online).
Statistical Analysis
To compare PDUI or gene expression between two or more groups, we used the Wilcoxon rank-sum test or Kruskal-Wallis nonparametric analysis of variance (ANOVA) test. For correlation, we used Spearman correlation (Rs). For survival analysis, we used the Cox proportional hazards model, and survival curves were compared using the two-sided log-rank test. We used Benjamini and Hochberg adjustment for false discovery rate (FDR) (26) and considered an FDR of less than 0.05 as statistically significant in analyses where an FDR is presented. All statistical tests were two-sided, and P values of less than .05 were considered statistically significant.
Results
Global Shortening of APA Events in Cancer Cell Lines
To systematically investigate the global APA landscape in cancer patients and cancer cell lines, we utilized a well-established computational algorithm, DaPars (10), and identified a large number of APA events (Table 1). The number of samples and a detailed abbreviation name for each cancer type are listed in Table 1. Among these APA events, 2.4% in OV to 11.8% in KIRP are negatively correlated with their gene expression (Spearman correlation Rs < –0.3, FDR < 0.05) (Supplementary Table 1, available online), perhaps because the APA event is only one of the factors (eg, DNA methylation, transcription factor, etc.) regulating gene expression. Consistent with a previous study (10), we observed an overall shortening pattern in tumor samples vs paired normal samples (Figure 1; Supplementary Figure 1A, available online). We also observed an even more extensive global APA shortening in cancer cell lines than in tumor samples (Figure 1A;Supplementary Table 2, available online), ranging from 831 (14.4%) in Lung squamous cell carcinoma (LUSC) to 2027 (36.3%) in THCA (Figure 1B). We further examined the percentage of transcripts with preferred longer 3’ UTR isoform (PDUI > 0.5) in cancer cell lines across different cancer types, which ranged from 59.6% in THCA to 63.8% in KIRC. These are statistically significantly lower than in tumor samples, which ranged from 66.7% in LUSC to 73.2% in OV (Wilcoxon test P = 7.4 × 10⁻⁷) (Figure 1C), while there is no statistically significant difference between tumor and normal comparison (Supplementary Figure 1, B and C, available online). We observed that APA difference partially contributes to mRNA expression difference (APA shortening with upregulated mRNA expression or APA lengthening with downregulated mRNA expression), ranging from 36.0% in SKCM to 49.7% in LGG (Supplementary Figure 1D, available online).
Summary of alternative polyadenylation across different cancer types*
| Data source | Sample type | Normal | Tumor | Read length | No. of detected APA events | No. of average APA events | |
|---|---|---|---|---|---|---|---|
| Normal | Tumor | ||||||
| TCGA | Bladder urothelial carcinoma (BLCA) | 19 | 258 | 48 | 13 119 | 6909 | 7276 |
| TCGA | Brain lower grade glioma (LGG) | 0 | 486 | 48 | 13 267 | NA | 8206 |
| TCGA | Breast invasive carcinoma (BRCA) | 105 | 837 | 50 | 14 537 | 8498 | 8244 |
| TCGA | Skin cutaneous melanoma (SKCM) | 0 | 288 | 48 | 12 929 | NA | 7756 |
| TCGA | Glioblastoma multiforme (GBM) | 0 | 154 | 76 | 12 891 | NA | 8599 |
| TCGA | Head and neck squamous cell carcinoma (HNSC) | 42 | 426 | 48 | 13 197 | 6934 | 7412 |
| TCGA | Kidney chromophobe (KICH) | 25 | 66 | 48 | 11 888 | 8664 | 7363 |
| TCGA | Kidney renal clear cell carcinoma (KIRC) | 67 | 448 | 50 | 13 589 | 8397 | 8174 |
| TCGA | Kidney renal papillary cell carcinoma (KIRP) | 30 | 198 | 48 | 12 684 | 7795 | 7302 |
| TCGA | Liver hepatocellular carcinoma (LIHC) | 50 | 200 | 48 | 11 650 | 5123 | 6196 |
| TCGA | Lung adenocarcinoma (LUAD) | 58 | 490 | 48 | 13 737 | 7216 | 7383 |
| TCGA | Lung squamous cell carcinoma (LUSC) | 17 | 220 | 50 | 13 567 | 8387 | 8158 |
| TCGA | Ovarian serous cystadenocarcinoma (OV) | 0 | 412 | 75 | 14 338 | NA | 8234 |
| TCGA | Prostate adenocarcinoma (PRAD) | 52 | 378 | 48 | 12 527 | 7956 | 7555 |
| TCGA | Stomach adenocarcinoma (STAD) | 33 | 285 | 75 | 13 910 | 6647 | 8031 |
| TCGA | Thyroid carcinoma (THCA) | 59 | 496 | 48 | 12 656 | 8237 | 7929 |
| TCGA | Cervical squamous cell carcinoma and endocervical adenocarcinoma (CESC) | 3 | 196 | 48 | 12 700 | NA | 7623 |
| CCLE | Cancer cell lines | 0 | 739 | 101 | 11 503 | NA | 8347 |
| Other | Chinese_GBM | 0 | 274 | 101 | 11 837 | NA | 7871 |
| Other | Japanese_KIRC | 0 | 97 | 100 | 12 275 | NA | 8933 |
| Other | Korean_LUAD | 77 | 83 | 101 | 11 967 | NA | 7895 |
*APA = alternative polyadenylation; TCGA = The Cancer Genome Atlas.
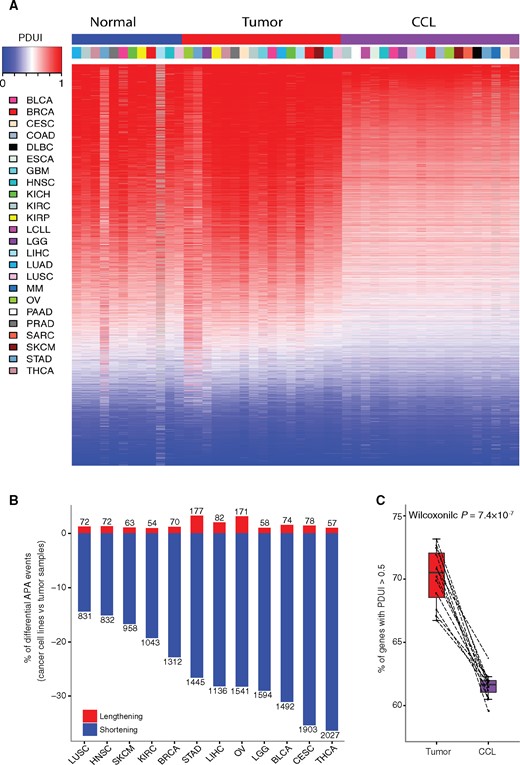
Global landscape of alternative polyadenylation (APA) events across patient samples and cancer cell lines. A) Global landscape of 7029 APA events across different cancer types in tumor samples (blue), normal samples (red), and cancer cell lines (purple). In the heatmap, red denotes transcripts with Percentage of Distal polyA site Usage Index (PDUI) greater than 0.5, while blue denotes transcripts with PDUI of less than 0.5. The columns are arranged by cancer type, and rows are arranged by mean PDUI of each APA event across all samples. B) Number of shortening (blue) and lengthening (red) APA events in cancer cell lines compared with tumor samples across 12 cancer types. C) Comparison of percentage of transcripts with PDUI greater than 0.5 divided by total number of APA events between tumor samples (red) and cancer cell lines (purple). The P value was calculated using a two-sided Wilcoxon test. The boxes show the median±1 quartile, with whiskers extending to the most extreme data point within 1.5 interquartile range from the box boundaries. APA = alternative polyadenylation; CCL = cancer cell lines; PDUI = Percentage of Distal polyA site Usage Index.
To rule out potential bias, we showed that cancer cell lines displayed a more shortening APA profile than tumor samples (Supplementary Figure 2, A and B, available online) regardless of the read length or coverage. We also observed overall weak or no correlation between tumor purity (21) and percentage of transcripts with PDUI greater than 0.5 across cancer types (Supplementary Figure 2C, available online), suggesting that tumor purity has little effect on our results.
To characterize the biological function of differentially regulated APA events, we performed functional enrichment analysis and observed that shortening APA events are highly enriched in gene ontology (GO) terms such as protein localization, transport, and cell cycle (Supplementary Figure 2D and Supplementary Table 3, available online), indicating that these cellular processes may be regulated by alterations of APA events and thus contribute to the distinctive features of cancer cell lines. Interestingly, these APA events are also highly enriched in GO terms related to the metabolic process, suggesting that APA events may be involved in different metabolic processes between cultured cancer cell lines and tumor samples (27).
Master Regulators for APA Events in Cancer
The 3’ end-processing machinery is composed of multiple protein factors, including four biochemically distinct protein complexes (CPSF, CSTF, CFI, and CFII) and several single proteins, such as PABPN1, RBBP6, and SYMPK (5). Among these, 22 genes are considered core factors (5). Previous reports have indicated that alterations in expression and/or activities of APA factors can influence APA site selection in specific cell types, such as CSTF2 (28) and NUDT21 (9). However, it is still unclear which APA factor(s) play the most important roles in APA regulation in human cancer. To address this issue, we used a linear regression model to evaluate relationships between 22 core APA factors with global APA events in tumor samples. Through positive correlation analysis, we found that PABPN1 may act as a dominant master regulator that broadly promotes usage of distal APA site in almost all cancer lineages, ranging from 14.5% in GBM to 39.8% in KIRC, which is much stronger than any other factors (Figure 2A). Based on limited cancer types or tissue types (sample size > 100), we did not observe that PABPN1 ranks as the top regulator in normal samples or in cancer cell lines. It is necessary to further investigate this with a larger number of samples. In the negative correlation analysis, the contribution of different APA regulators to global APA events varies among cancer types, suggesting that APA factors that promote the usage of proximal APA sites are more likely to be cancer specific or tissue specific (Supplementary Figure 3A, available online). Furthermore, we collected 63 more proteins identified in 3’ end cleavage and polyadenylation processing complex (5) and performed similar analysis. We observed that PABPN1 still ranks as the top, further suggesting PABPN1 as the master regulator in APA regulation (Supplementary Figure 3B, available online). Indeed, PABPN1 knockdown led to global shortening of APA events in U2OS, a human bone osteosarcoma epithelial cell line (29), and C2C12, a mouse myoblast cell line (30) (Figure 2B). Our results highlighted the importance of PABPN1 as a general determinant of usage of distal APA sites through pan-cancer analysis, likely due to PABPN1 acting prior to any other APA factors, and it can function well alone to bind the proximal APA site (29) or affect APA selection through its role in RNA stability (Figure 2C) (30,31).
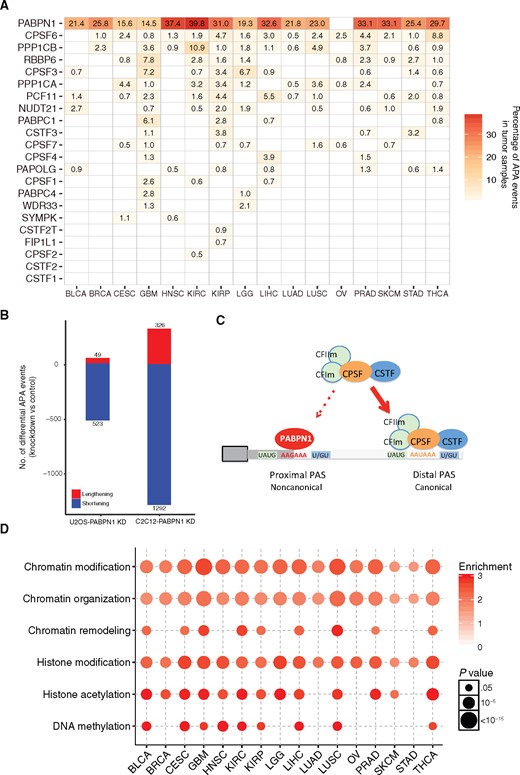
Key factors in regulation of alternative polyadenylation (APA) events. A) Percentage of APA events positively correlated with expression level of APA factors in tumor samples across cancer types. B) Global shortening of APA events upon PABPN1 knockdown in U2OS and C2C12 cell lines. C) A schematic model for the important role of PABPN1 in suppressing the usage of proximal APA site. D) Chromatin-related gene ontology (GO) terms enrichment analysis of top 10% of 20 532 genes correlated to APA events in tumor samples. Gene lists were provided in Supplementary Table 4 (available online). The circle color represents the enrichment score, while the circle size represents the statistically significant P value. Enriched GO terms were listed in Supplementary Table 5 (available online). APA = alternative polyadenylation; CPSF = cleavage and polyadenylation specificity factor; CSTF = cleavage stimulation factor.
We further extended our study to genome-wide analysis. PABPN1 ranks as 48th (top 0.2%) among all genes and ranks before any other APA factors (Supplementary Figure 3C, available online). Those genes that rank before PABPN1 are involved in more generalized biological processes such as RNA processing. We examined the top 10% genes of all 20 532 genes (Supplementary Table 4, available online) correlated to APA events and observed that these genes are highly enriched for roles in chromatin-related categories (Figure 2D;Supplementary Table 5, available online), suggesting a coordinating regulation of chromatin structure modification and APA processes. We also observed several enriched GO terms including RNA splicing and processing (Supplementary Figure 3D and Supplementary Table 6, available online). Remarkably, we also observed enriched GO terms in mitochondrial electron transport and oxidative phosphorylation, suggesting a potential role of energy metabolism in influencing APA events or vice versa.
Therapeutic Liability of APA Events
The drug sensitivity profile provides a systematic approach to link drug response to genetic and/or cellular features, such as gene expression (13,23,32). However, no systematic relationship between drug responses and APA events has been reported. Therefore, we performed comprehensive analysis on correlation of sensitivity to 24 US Food and Drug Administration (FDA)–approved anticancer drugs from CCLE with APA events across 321 cancer cell lines. Despite drugs not being designed to target APA events, we identified 214 statistically significantly correlated APA-drug pairs (|Rs| > 0.3, FDR < 0.05), suggesting a critical role of APA events in response to anticancer drugs. Interestingly, we found that top drugs correlated with APA events are pan-histone deacetylase (HDAC) inhibitors, such as Panobinostat, and DNA topoisomerase I inhibitors, such as Topotecan and Irinotecan (Figure 3A). We further observed global shortening in HDAC inhibitor–treated samples (33), suggesting a direct link between APA and HDAC. We also observed slightly more shortening events than lengthening events in HDAC3-specific knockdown samples (34,35) (Supplementary Figure 4, available online). This may due to the reason that other HDACs provide compensatory functions (36–39). These results suggest that chromatin-targeting drugs may act in part by modulating APA, consistent with our findings that chromatin modification and APA are closely linked.
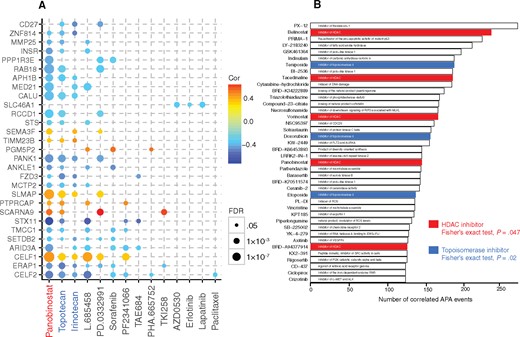
Therapeutic liability of alternative polyadenylation (APA) events in cancer cell lines. A) The statistically significant correlation of APA events with IC50 value of Cancer Cell Lines Encyclopedia drugs across cancer cell lines for three or more drugs. The circle color represents Spearman coefficient value, while the circle size represents the false discovery rate value. B) Top 40 drugs ranked based on the number of correlated APA events using Cancer Therapeutics Response Portal data: pan-histone deacetylase inhibitors, red. All statistical tests were two-sided. APA = alternative polyadenylation; HADc = pan-histone deacetylase.
To further confirm our findings, we explored the effect of APA events on drug sensitivity from the CTRP (13), which includes 481 small molecule compounds across 619 cancer cell lines. We identified 1516 APA events statistically significantly associated with drug sensitivity. We ranked the drugs based on the number of APA events correlated and found that the 40 top-ranked drugs are enriched in HDAC inhibitors (red, 5/40 vs 22/481, Fisher’s exact test, P = .047) and topoisomerase inhibitors (blue, 3/40 vs 5/481, P = .02) (Figure 3B). The consistency with CCLE data highlighted the close link between chromatin modification and APA.
Clinical Relevance of APA Events
There is no comprehensive analysis to identify clinically relevant APA events in cancer. We identified 326 differentially regulated APA events in paired normal and tumor samples, 345 APA events associated with tumor subtypes, 66 APA events associated with tumor stages, and 1707 APA events associated with overall survival (|Diff| ≥ 0.2, FDR < 0.05). We identified in total 1971 clinically relevant APA events (any of the above processes) (Supplementary Figure 5A and Supplementary Table 7, available online), and 37 of these events are in at least four cancer types (Figure 4A). By comparing PABPN1-dependent APA events obtained from previous reports (29–31), we observed that PABPN1-dependent APA events are enriched in clinically relevant APA events, suggesting the important role of PABPN1 in cancer (Supplementary Figure 5B, available online). Interestingly, tumor/normal differential APA events are also enriched in PABPN1-regulated APA events (Supplementary Figure 5C, available online). Among the differentially regulated APA events, most displayed a shortening pattern, which is consistent with our findings and a previous report (10). Most shortening APA events associated with worse survival, suggesting that use of a proximal polyadenylation site is associated with more aggressive status. For example, CSNK1D transcript exhibits statistically significant shortening, such as in LUSC (Diff = –0.23, FDR = 1.74 × 10⁻⁵) and KIRC (Diff = –0.23, FDR = 1.15 × 10⁻¹²) (Figure 4B). Shortening of CSNK1D transcript is associated with the worse survival in KIRP (Diff = 0.27, FDR = 0.01, hazard ratio [HR] = 0.60, 95% confidence interval [CI] = 0.48 to 0.75) (Figure 4B). Clinically, CSNK1D inhibition represents a promising therapeutic strategy in human breast cancer (40). Strikingly, we found that shortening of CSNK1D 3’ UTR in tumor samples leads to loss of several predicted RNA regulatory elements, such as microRNA binding sites and AU-rich elements (AREs) (41,42) (Figure 4B), which could lead to upregulation of CSNK1D expression. Moreover, the CRTC1 plays a crucial role in tumor formation (43); its transcript undergoes statistically significant 3’UTR shortening, and its shortening is associated with poor survival in LGG (Diff = 0.31, FDR = 0.004, HR = 0.75, 95% CI = 0.65 to 0.87) (Supplementary Figure 5D, available online). These results suggest that these genes potentially utilize APA to escape RNA destabilized elements and thus to play oncogenic roles in cancer.
![Clinical relevance of alternative polyadenylation (APA) events. A) Statistically significant differentially regulated and/or clinically relevant APA events identified in at least four cancer types. For each cancer type, the red and blue box indicates the statistically significant differential APA events between paired tumor and normal samples (red: Diff ≥ 0.2, false discovery rate [FDR] < 0.05; blue: Diff ≤ –0.2, FDR < 0.05), the lemon yellow box indicates the statistically significant differential APA events among tumor subtypes (|Diff| ≥ 0.2, FDR < 0.05), the purple box indicates the statistically significant differential APA events among tumor stages (|Diff| ≥ 0.2, FDR < 0.05), and the pink and light blue box indicates the lengthening APA events associated with worse (pink) or better (light blue) overall survival (|Diff| ≥ 0.2, FDR < 0.05). Complete clinically relevant APA events were listed in Supplementary Table 7 (available online). B) Schematic representation of gene last exon structure and predicted alternative polyadenylation site, miRNA binding site, and AU-rich elements (top). APA profile of CSNK1D in paired tumor and normal samples (left) and overall patient survival time for lengthening and shortening group (right). C) APA profile of NDE1 in paired tumor and normal samples (left), among BRCA tumor subtypes (middle), and STAD stages (right). The boxes show the median±1 quartile, with whiskers extending to the most extreme data point within 1.5 interquartile range from the box boundaries. APA = alternative polyadenylation; PDUI = Percentage of Distal polyA site Usage Index.](https://oup.silverchair-cdn.com/oup/backfile/Content_public/Journal/jnci/110/4/10.1093_jnci_djx223/4/m_djx223f4.jpeg?Expires=1749792491&Signature=HM9jVlfAcRGRzlSWWhMRnQfOCeL~dx2eaUiCdZ3EYxUfyn9Pt3sv0bYURz87I0TC0IB05fJ5tqMlBl5vf-L-Qn2SxMyhuFwcsGeoZ7p2StTGoNcUM0WbxirdW2LTEO8y~U9TXGg6pDOmmYj1rLh6gpm1fu9R1xA6Q5JDkDUUuQh3VowDROP9JsratMMwo0Qvg5a5YkT8JTj6yeQTkCRD8pYm-N~GEYh2dNVgVPf5bt8GA8BFrR8yGlJC8kiC4ddpFrzKiSBhMENLbn742bh73UbowrqzgBQ5LZAaA9Z0Oyq0NWgD8ETjACF~jaq4Xr-K64ZBPRzYy8QmZyGHnw~n2A__&Key-Pair-Id=APKAIE5G5CRDK6RD3PGA)
Clinical relevance of alternative polyadenylation (APA) events. A) Statistically significant differentially regulated and/or clinically relevant APA events identified in at least four cancer types. For each cancer type, the red and blue box indicates the statistically significant differential APA events between paired tumor and normal samples (red: Diff ≥ 0.2, false discovery rate [FDR] < 0.05; blue: Diff ≤ –0.2, FDR < 0.05), the lemon yellow box indicates the statistically significant differential APA events among tumor subtypes (|Diff| ≥ 0.2, FDR < 0.05), the purple box indicates the statistically significant differential APA events among tumor stages (|Diff| ≥ 0.2, FDR < 0.05), and the pink and light blue box indicates the lengthening APA events associated with worse (pink) or better (light blue) overall survival (|Diff| ≥ 0.2, FDR < 0.05). Complete clinically relevant APA events were listed in Supplementary Table 7 (available online). B) Schematic representation of gene last exon structure and predicted alternative polyadenylation site, miRNA binding site, and AU-rich elements (top). APA profile of CSNK1D in paired tumor and normal samples (left) and overall patient survival time for lengthening and shortening group (right). C) APA profile of NDE1 in paired tumor and normal samples (left), among BRCA tumor subtypes (middle), and STAD stages (right). The boxes show the median±1 quartile, with whiskers extending to the most extreme data point within 1.5 interquartile range from the box boundaries. APA = alternative polyadenylation; PDUI = Percentage of Distal polyA site Usage Index.
In contrast, several other genes displayed 3’UTR lengthening. For example, NDE1 showed lengthening in eight cancer types, as well as differential APA profile among tumor BRCA subtypes (Diff = 0.51, FDR < 2.2 × 10⁻¹⁶) and STAD stages (Diff = 0.28, FDR = 0.01) (Figure 4C). NDE1 can protect genome integrity during cell mitosis (44) and regulate cell cycle progression (45,46). Therefore, its lengthening may lead to enhanced negative regulation of NED1 expression through one more miRNA binding and several more AU-rich elements (Figure 4C), thus contributing to cancer genome instability and enhancing tumorigenesis. Other lengthening transcripts of interest are COL1A1 and COL1A2, which encode key components of type I collagen (Supplementary Figure 5, E and F, available online). Collagens are major components of the extracellular matrix and play an important role in tumor invasion and migration (47). Therefore, the lengthening of COL1A1 and COL1A2 may produce few proteins; thus it is involved in creating a tumorigenic microenvironment that facilitates tumor progression.
Alterations of APA Events in Clinically Actionable Genes
We further examined the APA profile of 135 clinically actionable genes, which includes therapeutic FDA-approved drug targets and/or their associated genes (22,48). Among these genes, 6.67% (GBM) to 31.9% (STAD) of them showed relatively large variance (interquartile range [IQR] ≥ 0.2), suggesting a novel layer of regulation of clinically actionable genes (Figure 5A). Several clinically actionable genes recurrently showed large variances across cancer types (Figure 5B). For example, CTNNB1, the key component of the Wnt signaling pathway (49), showed variant APA (IQR ≥ 0.2) in 16 cancer types. PIK3R1, the target of PI3K inhibitors (50), showed variant APA in 14 cancer types (Figure 5B). PABPN1 regulated the largest number of clinically actionable genes, which further confirmed the important roles of PABPN1 in cancer (Figure 5C;Supplementary Table 8, available online). For example, the top recurrently actionable genes, CTNNB1, PI3KR1, and FGFR2, are highly correlated with PABPN1 mRNA expression level in THCA (Rs = 0.66, P < 2.2 × 10⁻¹⁶), LGG (Rs = 0.47, P < 2.2 × 10⁻¹⁶), and KIRP (Rs = 0.66, P < 2.2 × 10⁻¹⁶), respectively (Figure 5D). Knockdown of PNBPN1 also led to shortening of CTNNB1 in U2OS and C2C12 cell lines. Among these APA events, CTNNB1 is strongly correlated with its APA status (Rs = –0.41, P < 2 × 10-16) and PIK3R1 is statistically significantly correlated with its APA status (Rs = –0.18, P = 5 × 10⁻⁵), while FGFR2 is not correlated with its APA status (Rs = –0.11, P = .16). The alterations of APA events in clinically actionable genes highlighted the necessity to consider the APA events in drug treatment.

Alterations of alternative polyadenylation (APA) events in clinically actionable genes in tumor samples. A) Distribution of interquartile range (IQR) of Percentage of Distal polyA site Usage Index (PDUI) of clinically actionable genes across different cancer types. B) Recurrent clinically actionable genes with IQRs of PDUI of 0.2 or greater in tumor samples. C) Number of APA events of clinically actionable genes correlated with expression level of APA core factors. D) Selected correlations (two-sided Spearman correlation test) between APA events of clinically actionable genes and PABPN1 expression level (left: CTNNB1; middle: PIK3R1; right: FGFR2). Complete correlations were listed in Supplementary Table 8 (available online). APA = alternative polyadenylation; IQR = interquartile range; PDUI = Percentage of Distal polyA site Usage Index.
Discussion
APA is an important and widespread event for gene regulation. With the large-scale RNA-seq data sets from both TCGA and CCLE, we provided a systemic view of the APA landscape in human cancer. Previous studies revealed global shortening of APA in tumor samples and cancer cell lines compared with normal samples (8,10,11). Strikingly, we observed an extensive global shortening in cancer cell lines compared with tumor samples, and these transcripts that undergo APA shortening are enriched in several cellular pathways, including protein transport, metabolism, and cell cycle. Taken together, this suggests that APA may play important roles in reshaping cellular pathways and regulating specific gene expression patterns in cancer cell lines that have been grown in culture medium. Cancer cell lines derived from tumors are the most frequently used models to study cancer biology, especially for drug response prediction and new anticancer drug development (13,32,51,52). However, cancer cell lines also display unique features compared with tumor samples, such as gene expression (53,54) and mutation (53). Our analysis added APA as a new dimension for a unique feature of cancer cell lines, and further investigation is necessary.
It is still unclear which factors are key players, especially in the aberrant APA that occurs in cancer. We showed that PABPN1 functions as a master regulator that promotes distal poly(A) site usage in different cancers. Our finding is consistent with the notion that PABPN1 acts prior to any other APA-related factors, and it can work alone to prevent the binding of other APA factors to proximal poly(A) sites or affect APA selection through its role in RNA stability (29–31). A previous study identified CSTF2 as the major factor by comparing the expression level between tumor and normal samples (10), while our study mainly focused on the correlations between PDUI and the expression level of APA factors within tumor samples. This inconsistency illustrates the complicated regulation of APA in cancer. As the master regulator, PABPN1 showed overall diverse expression among different cancers (ANOVA P = 2.5 × 10⁻¹³) and LUSC (P = .02), and PABPN1 expression is statistically significantly correlated with drug sensitivity of 31 drugs from the CTRP data set (Supplementary Figure 6, available online). Besides APA machinery–related components, we also identified other regulatory factors in APA regulation, such as factors involved in chromatin modification and remodeling. This is consistent with previous reports in human T cells (55) or yeast (56). More interestingly, genome-wide screening showed that mitochondrial electron transport and oxidative phosphorylation-related GO terms are highly associated with APA regulation. Considering that energy metabolism reprogramming is a hallmark of cancer (57) and ATP is a substrate of the polyadenylation process (58), our finding highlights the potential roles of energy metabolism as a new paradigm in the regulation of poly(A) site selection and vice versa.
We provided new evidence that differential APA profiles can affect the efficacy of drugs based on two independent pharmacogenomic data sets from CCLE and CTRP. We observed that the top drugs associated with APA events are HDAC inhibitors and/or DNA Topoisomerase inhibitors, highlighting the potential effects of those chromatin structure–targeted drugs on APA events, and that these drugs may yield new insights into the action mechanism of cancer drugs.
Finally, we identified an appreciable number of APA events with potential clinical relevance that could be potential biomarker candidates for further investigation. Despite the global shortening of APA profiles across tumor samples, we still observed clinically relevant lengthening APA events, such as NDE1, which functions as a guardian of genome integrity (45). We also identified a great variance of APA events among multiple clinically actionable genes, such as CTNNB1. Our results highlighted the importance and complexity of APA events in cancer treatment.
This study has some limitations. Despite the large computational effort, our analysis was the initial step to understand the regulation of APA events across different cancer types. We did not include all molecular measurements in analysis, such as miRNA expression. Moreover, further functional experiments are necessary to understand the molecular mechanisms of APA in cancer.
Funding
We gratefully acknowledge contributions from the TCGA Research Network. This work was supported by the Cancer Prevention and Research Institute of Texas (RR150085 to LH), the National Institutes of Health (GM046454 to ABS, UL1 TR000371 to CC, AG045828 to ZC, and GM114424 to SHY), an endowment from the Houston Endowment, Inc. (to ABS), The Welch Foundation (AU-1731 to ZC), the Biomedical Research Grant (RG-414673), the American Lung Association, and the UTHealth Pulmonary Center of Excellence Discovery Award (to HKQ).
Notes
The study sponsors had no role in design of the study; the collection, analysis, or interpretation of the data; the writing of the manuscript; or the decision to submit the manuscript for publication.
Author contributions: LH conceived and designed the study; YXiang, YYe, ZZ, YYang, LD, CC, TM, NC, and YK performed data analysis; YXiang, YL, FMO, HKQ, YXia, MRB, REK, ZC, SHY, ABS, GBM, and LH interpreted results; YXiang, GBM, and LH wrote the manuscript with input from other authors; LH supervised the whole project.
References
Author notes
Yu Xiang and Youqiong Ye contributed equally to this work.

