


Abstract
Despite growing therapeutic relevance of ERBB2 amplifications in colorectal cancer (CRC), little is known about ERBB2/ERBB3 mutations. We aimed to characterize these subsets of CRC.
We performed a retrospective analysis of 419 CRC patients from MD Anderson (MDACC) and 619 patients from the Nurses’ Health Study (NHS)/Health Professionals Follow-Up Study (HPFS) with tissue sequencing, clinicopathologic, mutational, and consensus molecular subtype (CMS) profiles of ERBB2/ERBB3 mutant patients. A third cohort of 1623 CRC patients with ctDNA assays characterized the ctDNA profile of ERBB2 mutants. All statistical tests were two-sided.
ERBB2 mutations occurred in 4.1% (95% confidence interval [CI] = 2.4% to 6.4%), 5.8% (95% CI = 4.1% to 8.0%), and 5.1% (95% CI = 4.0% to 6.2%) of MDACC, NHS/HPFS, and ctDNA patients, respectively. ERBB3 mutations occurred in 5.7% (95% CI = 3.7% to 8.4%, 95% CI = 4.0% to 7.8%) of patients in both tissue cohorts. Age, stage, and tumor location were not associated with either mutation. Microsatellite instability (MSI) was associated with ERBB2 (odds ratio [OR] = 5.98, 95% CI = 2.47 to 14.49, P < .001; OR = 5.13, 95% CI = 2.38 to 11.05, P < .001) and ERBB3 mutations (OR = 3.48, 95% CI = 1.51 to 8.02, P = .002; OR = 3.40, 95% CI = 1.05 to 10.96, P = .03) in both tissue cohorts. Neither gene was associated with TP53, APC, KRAS, NRAS, or BRAF mutations in tissue. However, PIK3CA mutations were strongly associated with ERBB2 mutations in all three cohorts (OR = 3.68, 95% CI = 1.83 to 7.41, P = .001; OR = 2.25, 95% CI = 1.11 to 4.58, P = .02; OR = 2.11, 95% CI = 1.25 to 3.58, P = .004) and ERBB3 mutations in the MDACC cohort (OR = 13.26, 95% CI = 5.27 to 33.33, P < .001). ERBB2 (P = 0.08) and ERBB3 (P = .008) mutations were associated with CMS1 subtype. ERBB2 (hazard ratio [HR] = 1.82, 95% CI = 1.23 to 4.03, P = .009), but not ERBB3 (HR = 0.88, 95% CI = 0.45 to 1.73, P = .73), mutations were associated with worse overall survival.
MSI and PIK3CA mutations are associated with ERBB2/ERBB3 mutations. Co-occurring PIK3CA mutations may represent a second hit to oncogenic signaling that needs consideration when targeting ERBB2/ERBB3.
ERBB2 amplifications are present in 3% to 4% of metastatic colorectal cancers (mCRC) and are enriched in patients with RAS/BRAF wild-type tumors (1–3). Amplifications result in resistance to anti–epidermal growth factor receptor (anti-EGFR) antibodies but may be vulnerable to treatment with anti-ERBB2 antibodies (4). In the HERACLES trial, the combination of trastuzumab and lapatinib resulted in a 30% response rate in heavily pretreated patients, while the combination of trastuzumab and pertuzumab has shown activity in the My Pathway Study (5,6). Despite growing awareness of ERBB2 amplifications as a potential therapeutic target for mCRC, little is known about the impact of mutations in ERBB2/ERBB3. In The Cancer Genome Atlas (TCGA) survey of colorectal cancer, 4.0% of patients had an ERBB2 mutation and 6.3% had an ERBB3 mutation (1). Although ERBB3 mutations are relatively uncommon, mCRC has one of the highest rates among solid malignancies (7).
Preclinical work suggests that many ERBB2 mutations are activating in CRC and result in increased MAPK activation, which can be inhibited with ERBB2 directed tyrosine kinase inhibitors in vitro and in xenograft mouse models of CRC (8). Similarly, anti-ERBB2 therapy has shown in vitro activity in ERBB3 mutant models of CRC, where concurrent ERBB2 activation appears important for mutant ERBB3 induced signaling alterations (9). While the V842I mutation in ERBB2 and V104M mutation in ERBB3 are the most prevalent alterations in mCRC, other variants have been reported, and the prevalence and functional significance of most individual variants are poorly described (9–13).
Understanding the prevalence, functional impact, and concurrent alterations present in patients with these mutations is important to establishing optimal targeting of this pathway. Additionally, given the potential for characteristics such as stage and sex to affect the distribution of biomarkers in colorectal cancer, it is necessary to characterize uncommon alterations across multiple cohorts to ensure that associations are robust and not due to underlying cohort characteristics (3). With this in mind, using distinct cohorts, we aimed to 1) describe the prevalence of ERBB2/ERBB3 mutations in a large population of patients with next-generation sequencing (NGS), 2) explore the clinical, pathologic, and molecular characteristics associated with these mutations, 3) assess co-occurring molecular alterations that may result in resistance to anti-ERBB2 therapy, and 4) determine frequency of ERBB2 mutations in patients undergoing ctDNA mutational profiling.
Methods
Patient Population
This study consisted of three cohorts that were assembled retrospectively with institutional review board approval at the MD Anderson Cancer Center (MDACC), and a waiver of written consent was obtained. Databases were deidentified, and the study was performed in accordance with MDACC Institutional Review Board guidelines for deidentified databases. Cohort 1 (n = 419) included patients with stage I–IV CRC who were seen at MDACC between March 1, 2012, and June 30, 2014, and had targeted exome sequencing performed (Supplementary Methods, available online). An additional 20 mCRC patients with an ERBB2 mutation detected as part of their standard clinical care were added to cohort 1 to increase the sample size of ERBB2 mutant patients for comparison of baseline characteristics and survival. These additional patients had ERBB2 sequencing performed using a CLIA-certified 46-gene NGS panel that has been previously described but had limited coverage of ERBB2 and as such was not used to calculate the prevalence of ERBB2 mutations (14). Cohort 2 (n = 619) utilized publicly available clinical data and exome sequencing from patients who developed CRC within the NHS/HPFS. Patients were stage I–IV, and sequencing methods have been previously described (15). The median tumor sequencing depths were 906× in the MDACC cohort and 89× in the NHS/HPFS. Cohort 3 included 1624 mCRC patients who received a Guardant360 ctDNA assay (Guardant Health, Redwood City, CA) as part of their care between June 1, 2014, and May 31, 2016, and contains only molecular data. Only ERBB2 and not ERBB3 mutations are included on the Guardant360 assay. Assay details are available publicly from Guardant Health (www.guardanthealth.com/guardant360), and all exons of ERBB2 are covered. ctDNA copy number alterations are defined as a 1+ if the plasma copy number is 1.15–2.39, 2+ if the plasma copy number is 2.40–3.99, and 3+ if the plasma copy number is 4.0 or greater. The 50th percentile for the ERBB2 plasma copy number is 2.4, and the 90th percentile is 4.0. Details regarding consensus molecular subtyping for the MDACC tissue cohort are available in the Supplementary Methods (available online).
Statistical Analysis
Variable comparisons were performed using the Mann-Whitney test for continuous variables and the χ2/Fisher exact test for categorical variables and assessment of odds ratios for associations as appropriate. Disease-free survival (DFS) was defined as the time from surgical resection of a patient’s primary tumor until disease recurrence and was calculated for patients with stage I–III disease. Overall survival (OS) was defined as the time from diagnosis until death and was calculated for early-stage (I–III) and metastatic patients separately. Multivariable survival analysis utilized a Cox regression model, with ERBB2 and ERBB3 mutation status and stage entered into the model after satisfying the proportional hazards assumption on a plot of cumulative hazards functions and their logarithms for the covariates. Relative allele frequency was defined as the allele frequency of an ERBB2 or ERBB3 mutation divided by the maximum allele frequency detected in a sample. Statistical analyses were performed using GraphPad Prism, version 6.07 (La Jolla, CA), and IBM SPSS, version 23.0 (Armonk, NY). Genomic visualization tools from cBioPortal (16) were used. All statistical tests were two-sided, and a P value of less than .05 was considered statistically significant.
Results
Cohort Characteristics
Differences across cohorts are summarized in Table 1. Important differences include an older age and higher proportion of females, earlier stage, right-sided, microsatellite instability (MSI), and CpG Island Methylator Phenotype (CIMP) low tumors in the NHS/HPFS compared with the MDACC and ctDNA cohorts. These differences are explained by the higher proportion of early-stage female patients in the NHS/HPFS, which alters the distribution of many of the other characteristics.
Baseline characteristics of sequencing cohorts assessed in this study*
| Nurses’ Health/Health Professionals Follow-Up Study | MD Anderson cohort | ctDNA cohort | P | |
|---|---|---|---|---|
| No. (% of total) | 619 | 419 | 1623 | |
| Median age (IQR), y | 71 (65–77) | 55 (46–65) | 60 (50–69) | <.001 |
| Sex, No. (%) | ||||
| Female | 380 (61.4) | 195 (46.5) | 724 (44.6) | <.001 |
| Male | 239 (38.6) | 224 (53.5) | 898 (55.4) | |
| Stage, No. (%), % | ||||
| I | 152 (27.0) | 0 (0.0) | <.001 | |
| II | 187 (33.2) | 99 (23.6) | ||
| III | 159 (28.2) | 92 (22.0) | ||
| IV | 65 (11.5) | 228 (54.4) | ||
| Unknown | 56 | 0 | ||
| Primary, No. (%) | ||||
| Left sided | 303 (49.0) | 247 (59.7) | <.001 | |
| Right sided | 315 (51.0) | 167 (40.3) | ||
| Unknown | 1 | 5 | ||
| MSI status, No. (%) | ||||
| Stable | 438 (82.8) | 342 (92.4) | <.001 | |
| Unstable | 91 (17.2) | 28 (7.6) | ||
| Unknown | 90 | 49 | ||
| Molecular phenotype, No. (%) | ||||
| TP53 mutant | 304 (49.1) | 227 (54.2) | 868 (53.5) | .14 |
| APC mutant | 352 (56.9) | 227 (54.2) | 663 (40.9) | <.001 |
| KRAS mutant | 174 (28.1) | 156 (37.2) | 485 (29.8) | .004 |
| NRAS mutant | 27 (4.4) | 16 (3.8) | 79 (4.9) | .63 |
| BRAF mutant | 126 (20.4) | 49 (11.7) | 128 (7.9) | <.001 |
| PIK3CA mutant | 130 (21.0) | 78 (18.6) | 219 (13.5) | <.001 |
| CIMP status, No. (%) | ||||
| CIMP-high | 99 (19.6) | 58 (32.4) | <.001 | |
| CIMP-low | 405 (80.4) | 121 (67.6) | ||
| Unknown | 119 | 237 | ||
CIMP = CpG island methylator phenotype; IQR = interquartile range; MSI = microsatellite instability.
ERBB2 Mutation Prevalence (Tissue) and Patient Characteristics
As shown in Table 2, ERBB2 mutations were noted in 17/419 (4.1%, 95% confidence interval [CI] = 2.4% to 6.4%) MDACC patients and 36/619 NHS/HPFS patients (5.8%, 95% CI = 4.1% to 8.0%). Specific mutations are summarized in Figure 1. The most common ERBB2 mutations were I655V (n = 6), V842I (n = 7), and R678Q (n = 8). All other mutations occurred in two or fewer patients. ERBB2 prevalence was not associated with stage, age, sex, or location in either cohort. ERBB2 mutations were strongly associated with MSI in the MDACC (odds ratio [OR] = 5.98, 95% CI = 2.47 to 14.49, P < .001) and NHS/HPFS cohorts (OR = 5.13, 95% CI = 2.38 to 11.05, P < .001). Similarly, CIMP-high tumors were associated with ERBB2 mutations in the NHS/HPFS (OR = 2.85, 95% CI = 1.29 to 6.31, P = .007) but not the MDACC cohort (P = .86).
Baseline characteristics and mutational profile of patients with colorectal cancer and ERBB2 or ERBB3 mutations
| Characteristic | Nurses’ Health Study/ Health Professionals Follow-Up Study | MD Anderson cohort | ||||||||||
|---|---|---|---|---|---|---|---|---|---|---|---|---|
| ERBB2 WT | ERBB2 MT | P* | ERBB3 WT | ERBB3 MT | P* | ERBB2 WT | ERBB2 MT† | P | ERBB3 WT | ERBB3 MT | P* | |
| No. (% of total) | 583 (94.2) | 36 (5.8) | 584 (94.3) | 35 (5.7) | 402 (95.9) | 17 (4.1) | 395 (94.3) | 24 (5.7) | ||||
| No. by stage | ||||||||||||
| I (% of stage I) | 142 (26.8) | 10 (30.3) | .61 | 145 (27.2) | 7 (23.3) | .73 | 0 (0) | 0 (0) | .19 | 0 (0) | 0 (0) | .10 |
| II (% of stage II) | 174 (32.8) | 13 (39.4) | 175 (32.8) | 12 (40.0) | 92 (22.9) | 7 (41.2) | 89 (22.5) | 10 (41.7) | ||||
| III (% of stage III) | 153 (28.9) | 6 (18.2) | 150 (28.1) | 9 (30.0) | 90 (22.4) | 2 (11.8) | 88 (22.3) | 4 (16.7) | ||||
| IV (% of stage IV) | 61 (11.5) | 4 (12.1) | 63 (11.8) | 2 (6.7) | 220 (54.7) | 8 (47.1) | 218 (55.2) | 10 (41.7) | ||||
| Unknown | 53 | 3 | 51 | 5 | 0 | 0 | ||||||
| Median age (IQR), y | 71 (65–77) | 71 (66–77) | .68 | 75 (66–79) | 71 (65–77) | .14 | 56 (46–66) | 55 (46–65) | .83 | 55 (47–66) | 55 (46–65) | .80 |
| Sex, No. (%) | ||||||||||||
| Female | 357 (61.2) | 23 (63.9) | .86 | 354 (60.6) | 26 (74.3) | .11 | 186 (46.3) | 15 (40.5) | .50 | 184 (46.6) | 11 (45.8) | .94 |
| Male | 226 (38.8) | 13 (36.1) | 230 (39.4) | 9 (25.7) | 216 (53.7) | 22 (59.5) | 211 (53.4) | 13 (54.2) | ||||
| Primary, No. (%) | ||||||||||||
| Left-sided | 289 (49.7) | 14 (38.9) | .21 | 293 (50.3) | 10 (28.6) | .01 | 238 (59.9) | 23 (63.9) | .64 | 234 (59.2) | 13 (54.2) | .57 |
| Right-sided | 293 (50.3) | 22 (61.1) | 290 (49.7) | 25 (71.4) | 159 (40.1) | 13 (36.1) | 156 (40.0) | 11 (45.8) | ||||
| Unknown | 1 | 0 | 1 | 0 | 5 | 1 | 5 | 0 | ||||
| MSI status, No. (%) | ||||||||||||
| Stable | 423 (84.6) | 15 (51.7) | <.001 | 423 (83.9) | 15 (60.0) | .002 | 332 (93.0) | 20 (69.0) | <.001 | 326 (93.1) | 16 (80.0) | .03 |
| Unstable | 77 (15.4) | 14 (48.3) | 81 (16.1) | 10 (40.0) | 25 (7.0) | 9 (31.0) | 24 (6.9) | 4 (20.0) | ||||
| Unknown | 83 | 7 | 80 | 10 | 45 | 8 | 45 | 4 | ||||
| Molecular phenotype, No. (%) | ||||||||||||
| TP53 mutant | 293 (50.3) | 11 (30.6) | .02 | 282 (50.0) | 12 (34.3) | .07 | 216 (53.7) | 23 (62.2) | .32 | 213 (53.9) | 14 (58.3) | .67 |
| APC mutant | 333 (57.1) | 19 (52.8) | .61 | 339 (58.0) | 13 (37.1) | .02 | 213 (53.0) | 21 (56.8) | .66 | 209 (52.9) | 18 (75.0) | .04 |
| KRAS mutant | 165 (28.3) | 9 (25.0) | .67 | 162 (27.7) | 12 (34.3) | .40 | 149 (37.1) | 13 (35.1) | .82 | 144 (36.5) | 12 (50.0) | .18 |
| NRAS mutant | 24 (4.1) | 3 (8.3) | .23 | 26 (4.5) | 1 (2.9) | .65 | 15 (3.7) | 1 (2.7) | .47 | 14 (3.5) | 2 (8.3) | .23 |
| BRAF mutant | 116 (19.9) | 10 (27.8) | .25 | 112 (19.2) | 14 (40.0) | .003 | 45 (11.2) | 6 (16.2) | .36 | 45 (11.4) | 4 (16.7) | .44 |
| PIK3CA mutant | 117 (20.1) | 13 (36.1) | .02 | 123 (21.1) | 7 (20.0) | .88 | 69 (17.2) | 16 (43.2) | <.001 | 61 (15.4) | 17 (70.8) | <.001 |
| CIMP status, No. (%) | ||||||||||||
| CIMP-high | 88 (18.5) | 11 (39.3) | .007 | 82 (17.3) | 13 (52.0) | <.001 | 54 (31.6) | 4 (40.0) | .86 | 54 (31.6) | 4 (36.4) | .95 |
| CIMP-low | 388 (81.5) | 17 (60.7) | 393 (82.7) | 12 (48.0) | 117 (68.4) | 6 (60.0) | 114 (68.4) | 7 (63.6) | ||||
| Unknown | 111 | 8 | 109 | 10 | 231 | 27 | 224 | 13 | ||||
| CMS subtype, No. (%) | ||||||||||||
| I (% of CMS I) | 37 (21.8) | 5 (55.6) | .08 | 34 (20.5) | 8 (66.7) | .008 | ||||||
| II (% of CMS II) | 84 (49.4) | 1 (11.1) | 83 (50.0) | 2 (16.7) | ||||||||
| III (% of CMS III) | 15 (8.8) | 1 (11.1) | 15 (9.0) | 1 (8.3) | ||||||||
| IV (% of CMS IV) | 34 (20.0) | 2 (22.2) | 34 (20.5) | 2 (16.7) | ||||||||
Variable comparisons were performed using the Mann-Whitney test for continuous variables and the χ2/Fisher exact test for categorical variables and assessment of odds ratios for associations, as appropriate. CIMP = CpG island methylator phenotype; CMS = consensus molecular subtype; IQR = interquartile range; MSI = microsatellite instability; MT = mutant; WT = wild-type.
An additional 20 ERBB2 mutant patients identified from our clinical sequencing database were included in the ERBB2 mutant cohort for assessment of baseline characteristics. These patients were not included in assessment of prevalence or prevalence by stage.
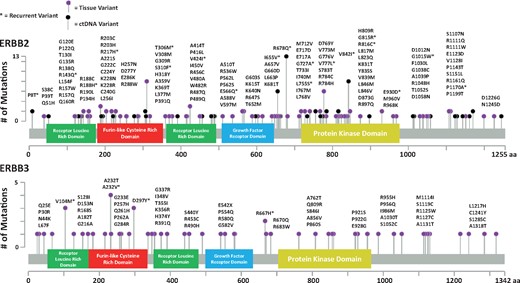
Summary of protein coding alterations noted in ERBB2 and ERBB3 mutant colorectal cancer patients from the MD Anderson Cancer Center and the Nurses’ Health Study/Health Professionals Follow-Up Study. aa = amino acid.
Mutational profiles are summarized in Table 2 and Figure 2. Rates of APC, KRAS, NRAS, and BRAF mutations were similar between ERBB2 mutated and wild-type (WT) patients. PIK3CA mutations were more common in MDACC and NHS/HPFS ERBB2 mutant patients (OR = 3.68, 95% CI = 1.83 to 7.41, P < .001; OR = 2.25, 95% CI = 1.11 to 4.58, P = .02). In the subset of patients with available CMS subtyping information, there were trends toward ERBB2 mutations being associated with CMS-I subtype (P = .08). Nine of 53 ERBB2 mutant patients with NGS coverage of ERBB3 had concurrent ERBB2 and ERBB3 mutations (17.0%). Of 207 MDACC patients with copy number information, 18 had ERBB2 amplifications, one of which co-occurred with an ERBB2 P1170A mutation.
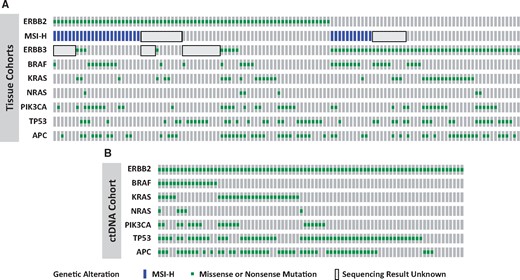
Molecular profile of ERBB2 and ERBB3 mutant colorectal cancer patients from the MD Anderson Cancer Center, the Nurses’ Health Study/Health Professionals Follow-Up Study, and a ctDNA cohort. A) Patients with tissue-based sequencing. B) Patients with ctDNA-based assays. MSI = microsatellite instability.
ctDNA ERBB2 Landscape
As seen in Table 3, 82/1623 patients (5.1%, 95% CI = 4.0% to 6.2%) with a ctDNA assay had detectable ERBB2 mutations, nine (11.0%) of whom had concurrent ERBB2 amplifications. Two of these were 2+ amplifications, and seven were 3+ amplifications (mean copy number = 21.5, 95% CI = 2.80 to 40.26) for the nine ERBB2 mutants with amplifications. If restricting the analysis to only patients with one or more detectable alterations in their ctDNA, ERBB2 mutations were present in 82/1397 patients (5.9%, 95% CI = 4.7% to 7.2%). Concurrent TP53 (OR = 2.14, 95% CI = 1.32 to 3.48, P = .002), APC (OR = 2.24, 95% CI = 1.42 to 3.53, P < .001), BRAF (OR = 2.92, 95% CI = 1.64 to 5.21, P < .001), and PIK3CA (OR = 2.11, 95% CI = 1.25 to 3.58, P = .004) mutations were more common among ERBB2 mutant patients, as were ERBB2 amplifications (OR = 3.15, 95% CI = 1.50 to 6.61, P = .001). Recurring alterations present in two or more patients included S310F (n = 7), V424I (n = 3), R678Q (n = 5), and V777L (n = 4).
ctDNA ERBB2 landscape of 1623 patients with a Guardant 360 panel
| Characteristic | ERBB2 WTNo. (%) | ERBB2 MTNo. (%) | P* |
|---|---|---|---|
| No. (% of total) | 1541 (94.9) | 82 (5.1) | |
| Molecular phenotype | |||
| TP53 mutant | 817 (53.0) | 58 (70.7) | .002 |
| APC mutant | 633 (41.1) | 50 (61.0) | <.001 |
| KRAS mutant | 460 (29.9) | 27 (32.9) | .55 |
| NRAS mutant | 74 (4.8) | 5 (6.1) | .59 |
| BRAF mutant | 118 (7.7) | 16 (19.5) | <.001 |
| PIK3CA mutant | 204 (13.2) | 20 (24.4) | .004 |
| ERBB2 amplified | 58 (3.8) | 9 (11.0) | .001 |
Variable comparisons were performed using χ2. MT = mutant; WT = wild-type.
ERBB3 Mutation Prevalence and Patient Characteristics
ERBB3 mutations were noted in 24/419 (5.7%, 95% CI = 3.8% to 8.4%) MDACC patients and 35/619 (5.7%, 95% CI = 4.1% to 7.8%) NHS/HPFS patients. As seen in Figure 1, the V104M (n = 3), A232T (n = 4), A232V (n = 4), D297Y (n = 3), and R667H (n = 2) mutations were the only recurring variants across combined cohorts. Prevalence was not associated with stage, age, or sex in either cohort but was associated with right-sided location in the NHS/HPFS cohort (OR = 2.53, 95% CI = 1.19 to 5.35, P = .01). ERBB3 mutations were associated with MSI in both cohorts (OR = 3.40, 95% CI = 1.05 to 10.96, P = .03; OR = 3.48, 95% CI = 1.51 to 8.02, P = .002) and CIMP-H status in the NHS/HPFS cohort (OR = 5.19, 95% CI = 2.29 to 11.79, P < .001).
Table 2 and Figure 2 demonstrate that no consistent mutation was found to co-occur with ERBB3 mutations. APC mutations were more common among ERBB3 mutants in the MDACC cohort (75.0%), but less common among the NHS/HPFS patients (37.1%). In the NHS/HPFS cohort, BRAF mutations appeared more common among ERBB3 mutant patients (OR = 2.81, 95% CI 1.39 to 5.70, P = .003), but this was not reproduced in the MDACC cohort (OR = 1.56, 95% CI = 0.51 to 4.76, P = .44). Similarly, PIK3CA mutations appeared more common among ERBB3 mutant patients in the MDACC cohort (OR = 13.26, 95% CI = 5.27 to 33.33, P < .001) but not in the NHS/HPFS (OR = 0.94, 95% CI = 0.40 to 2.20, P = .88). ERBB3 mutations were statistically significantly associated with CMS-I subtype (P = .008). There were no ERBB3 amplifications among 207 evaluable MDACC patients.
Clinical Course
Survival follow-up was only available in the MDACC cohort and was assessed with a median follow-up of 41.7 months for metastatic patients and 103.8 months for early-stage patients. Results are summarized in Figure 3. Among patients with metastatic disease, ERBB2 mutant patients had a worse OS than wild-type patients (median [SD] = 34.7 [3.6] vs 44.8 [2.7] months, hazard ratio [HR] = 1.82, 95% CI = 1.23 to 4.03, P = .009), while ERBB3 mutations did not impact OS (median [SD] = 48.5 [10.1] vs 44.7 [2.3] months, HR = 0.88, 95% CI = 0.45 to 1.73, P = .73). Two patients with metastatic disease and concurrent ERBB2 and ERBB3 mutations died 12.5 and 44.4 months after diagnosis with metastatic disease. Among the five ERBB2 mCRC patients who received anti-EGFR therapy, one patient had disease control for 21 months on FOLFIRI + cetuximab, two had progressive disease within two months on FOLFIRI + cetuximab and irinotecan + cetuximab, another had progressive disease after three months on FOLFIRI + cetuximab, and one patient received vemurafenib, cetuximab, and irinotecan as part of a clinical trial and had disease control for 10 months before progressing due to a concurrent BRAF mutation. Among the two ERBB3 mutant patients who received anti-EGFR therapy, one had disease control for 6.5 months using irinotecan + panitumumab before progressing and another had disease control for 14 months before progressing after receipt of FOLFIRI + anti-EGFR.
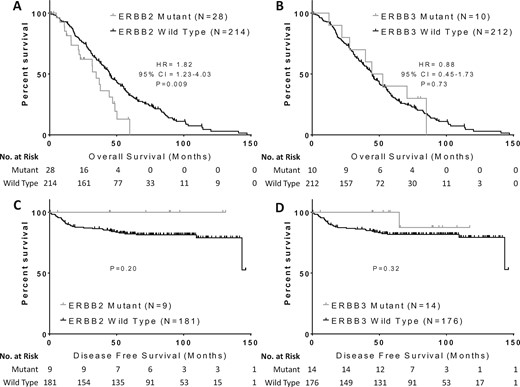
Impact of ERBB2 and ERBB3 mutations on clinical outcomes in colorectal cancer. Overall survival was compared in patients with metastatic colorectal cancer and (A)ERBB2 or (B)ERBB3 mutations compared with wild-type patients, while disease-free survival was compared in early-stage colorectal cancer patients with (C)ERBB2 or (D)ERBB3 mutations compared with wild-type patients. Groups were compared with the log-rank test and Cox proportional hazards models. All P values are two-sided. CI = confidence interval; HR = hazard ratio.
Among early-stage patients, none of the nine ERBB2 mutant patients had a recurrence, while only one of 14 ERBB3 mutant patients had a recurrence (Figure 3, C and D). DFS was not statistically significantly different among patients with ERBB2 (P = .20) or ERBB3 (P = .32) mutations. OS also did not differ by ERBB2 (P = .27) or ERBB3 (P = .08) mutation status among early-stage patients (data not shown). A multivariable model (Table 4) including early-stage and metastatic patients was developed including the variables of stage, ERBB2 mutation, and ERBB3 mutation status. Neither ERBB2 nor ERBB3 mutations were associated with OS. The model included 225 events among 413 evaluable patients.
Multivariable overall survival analysis*
| Variable | Hazard ratio (95% CI) | P† |
|---|---|---|
| Stage | ||
| II | 1.00 (reference) | |
| III | 1.27 (0.72 to 2.23) | .41 |
| IV | 10.61 (6.70 to 16.80) | <.001 |
| ERBB2 mutant | 1.32 (0.67 to 2.60) | .43 |
| ERBB3 mutant | 0.90 (0.50 to 1.63) | .73 |
| Variable | Hazard ratio (95% CI) | P† |
|---|---|---|
| Stage | ||
| II | 1.00 (reference) | |
| III | 1.27 (0.72 to 2.23) | .41 |
| IV | 10.61 (6.70 to 16.80) | <.001 |
| ERBB2 mutant | 1.32 (0.67 to 2.60) | .43 |
| ERBB3 mutant | 0.90 (0.50 to 1.63) | .73 |
Model included 413 patients with 225 events. CI = confidence interval.
Calculated with Cox proportional hazards model. P values are two-sided.
Functional Significance of Individual Variants
For variants present in more than one patient, we assessed the literature for functional characterization, and the evidence is summarized in Supplementary Tables 1 and 2 (available online). Among recurring ERBB2 mutations, P8T, I655V, and P1170A variants have been previously reported as germline SNPs with no presumed pathogenic consequences. The V842I, S310F, and V777L variants appear to be activating, while the R143Q, R188H, T306M, V424I, E566Q, R678Q, G727A, and E930D variants have few functional data to support their role in oncogenic transformation. Among recurring ERBB3 variants, V104M and A232T/V have sufficient evidence to suggest that they are likely pathologic, while R667H and D297Y have unknown functional significance. As seen in Figure 4, the relative allele frequency of recurrent or confirmed activating mutations was noted at higher allele frequencies, suggesting that subclonal alterations are less likely to be active.
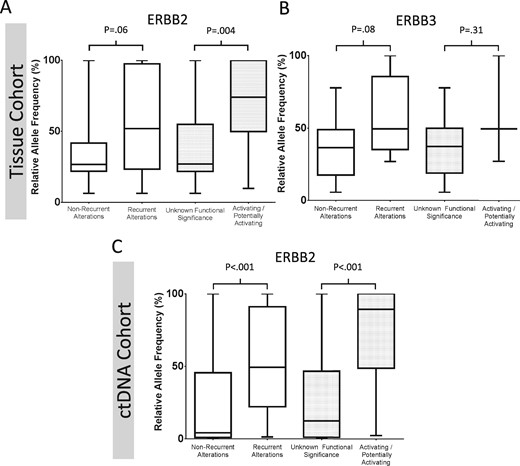
Box and whisker plot demonstrating the relative allele frequency of detected ERBB2 and ERBB3 mutations stratified by whether mutations are recurrent or confirmed to be functionally activating. Patients with tissue-based assays and detected (A)ERBB2 or (B)ERBB3 mutations are shown on the top row, while patients with ctDNA detected ERBB2 variants are shown in (C). Values represent the median, interquartile range, and range. Functional characterization is based on the literature review in Supplementary Tables 1 and 2 (available online). Groups were compared using the Mann-Whitney test, and P values are two-sided.
Discussion
In our analysis of a combined 2681 patients, we noted an ERBB2 mutation prevalence ranging between 4.1% and 5.8% across three cohorts, while ERBB3 had a mutation prevalence of 5.7% in two cohorts. Our results suggest a higher frequency of both ERBB2 and ERBB3 mutations than reported in many prior cohorts, where rates of mutations have ranged from 0.6% to 3.6% (1,2,4–6,9,10,17,18). The higher mutation prevalence in the MDACC cohort may have been due to the high depth of coverage (median = 906×), allowing an assessment of lower-frequency mutations. However, the consistency of our findings across cohorts highlights the robustness of our results. Given that both tissue and the ctDNA cohort all covered the entire coding region of both genes, we feel that our established mutation prevalence is a valid estimation of the true prevalence (15,19).
Among the clinicopathologic characteristics associated with ERBB2 or ERBB3 mutations, only MSI status was consistent across all cohorts. The strong association of MSI-H tumors with mutations in ERBB2 has been previously reported by Kloth et al., who noted concurrent ERBB2 mutations in 14/93 patients (15.0%) with MSI, BRAF wild-type tumors (20). Notably, no ERBB2 mutations were observed among 15 BRAF mutant MSI-H patients, leading the authors to hypothesize that ERBB2 mutations were specific to MSI-H CRCs. However, in our larger cohort, we noted nine patients who were MSI-H with concurrent BRAF and ERBB2 mutations. This differential finding may be due to the small sample size of the previous study. We also noted an enrichment of ERBB3 mutations among MSI-H tumors in both tissue cohorts, a finding that has not been previously reported, suggesting that the association between ERBB family mutations and MSI-H tumors may be driven by aberrations in a common pathway rather than a single recurrent alteration. Both BRAF alterations and ERBB family alterations may be driving a similar pathway in MSI-H tumors. Of note, we also noted an enrichment of ERBB2/ERBB3 mutations among CIMP-H tumors in the NHS/HPFS cohort. Given the shared biology between CIMP-H and MSI-H phenotypes, this provides further support for a potential common aberrant pathway in ERBB family members and MSI-H biology.
One potential explanation for the association of ERBB family mutations with MSI-H tumors could be that MSI-H tumors have an overall increased mutation burden. When reviewing the co-occurring driver gene mutations in Table 2, it is noted that patients with either ERBB2 or ERBB3 mutations do not have a disproportionate number of other key oncogenes outside of PIK3CA. However, the increased burden of ERBB2/ERBB3 mutations among MSI-H tumors may still be due to a higher rate of mutagenesis occurring due to mismatch repair. Despite this possible explanation, the strong association between MSI and ERBB2/ERBB3 mutations suggests that screening patients with MSI-H tumors for ERBB2/ERBB3 mutations may be a potential enrichment strategy for trials with targeted agents focused on the ERBB family.
The noted association between PIK3CA and ERBB2/ERBB3 mutations in our study is an important consideration for targeted therapies. Previous reports have shown that ERBB3 mutations alone are not sufficient to result in oncogenic transformation (9). In these patients, co-occurring ERBB2 alterations are important to drive ERBB3 signaling. The high rate of concurrent PIK3CA mutations we noted in the MDACC cohort may serve as a “second hit” for tyrosine kinase activity that cooperatively drives cellular proliferation in ERBB3 mutant patients. This second hit may also be important for ERBB2 mutant patients. PIK3CA mutations have previously been shown to occur more frequently in RAS mutant mCRC and have been associated with decreased benefit from ERBB2 targeted therapy in breast cancer (21,22). These co-occurring alterations may indicate an addiction to tyrosine kinase signaling as a common driver pathway. Targeting individual alterations in this pathway may be less effective than considering a global strategy to inhibit vertically and horizontally integrated signaling cascades, and an attempt to target the ERBB family alone in mCRC may not have been successful in the SUMMIT trial due to redundant pathway activation in adjacent nodes not suppressed by neratinib alone (23,24). This strategy has recently been effective in BRAF mutant mCRC, where concurrent cetuximab, vemurafenib, and irinotecan improved progression-free survival compared with cetuximab and irinotecan (24).
Notably, the ctDNA cohort exhibited an ERBB2 mutation rate that was similar to both tissue testing platforms. Although the ctDNA cohort lacks clinical annotation, the samples are likely from a more heavily pretreated population compared with tissue cohorts. While some patients in the MDACC tissue cohort have received anti-EGFR therapy, the NHS/HPFS includes only anti-EGFR-naïve patients, who have ERBB2 mutation rates comparable to ctDNA. Some resistance mechanisms such as MET and EGFR alterations have been previously shown to occur at a greater prevalence among anti-EGFR-treated patients in ctDNA following evolutionary pressures (25,26). This was not observed for ERBB2 mutation prevalence, which may suggest that these mutations do not contribute meaningfully to acquired resistance to anti-EGFR therapy, with the caveat that prevalence in ctDNA cohorts may be affected by other factors such as tumor shedding and assay technical characteristics. We did, however, note increased prevalence of other confirmed mechanisms of resistance to anti-EGFR agents, such as BRAF/PIK3CA mutations and ERBB2 amplifications in ERBB2 mutant ctDNA patients. While this fact may support our philosophy of pathway redundancy as a common theme in CRC, it may also be indicative of prior anti-EGFR therapy, leading to multiple concurrent clones emerging with diverse mechanisms of resistance, as we have previously noted (26). The higher rates of concurrent mutations in ERBB2 mutant tumors may also be a function of tumor heterogeneity, which is better detected with ctDNA. Unfortunately, without single-cell sequencing techniques, we are unable to establish the biologic significance of co-detected mutations.
Though our study provides valuable insights into the biology of ERBB2/ERBB3 mutated colorectal cancer, it is limited by its retrospective nature and the heterogeneity of the included cohorts. Though the noted association of ERBB2 but not ERBB3 mutations with worse overall survival is hypothesis-generating, the inability to perform a robust multivariable analysis limits the ability to assess whether ERBB2 is an independent prognostic variable in these patients.
In summary, we noted ERBB2 and ERBB3 mutations in between 4.1% to 5.8% and 5.7% of patients, respectively, and show a strong association with MSI and PIK3CA mutations. These concurrent PIK3CA alterations may suggest a synergistic addiction to master regulator cell signaling pathways that may require a multipronged attack to effectively suppress.
Funding
JL was the recipient of a Canadian Association of Medical Oncologists Research Fellowship, the American Society of Clinical Oncology–J. Edward Mahoney Foundation Young Investigator Award, and the Royal College of Physicians and Surgeons of Canada Detweiler Fellowship. JSD is supported in part by a grant from the Duncan Family Institute for Cancer Prevention and Risk Assessment. SK is the recipient of National Institutes of Health R01 grants that supported this research (CA 172670 and CA 187238).
Notes
Affiliations of authors: Gastrointestinal Medical Oncology (JML, MJO, SK, KR), Sheikh Khalifa Bin Zayed Al Nahyan Institute of Personalized Cancer Therapy (AMB, AMJ, KS), Department of Epidemiology (YY), Department of Epidemiology (WW, JSD), Institute for Applied Cancer Science (CAB, FMB), and Department of Pathology (RB), The University of Texas MD Anderson Cancer Center, Houston, TX; Guardant Health, Inc., Redwood City, CA (KCB, RBL).
The funders had no role in the design of the study; the collection, analysis, and interpretation of the data; the writing of the manuscript; and the decision to submit the manuscript for publication.
Disclosures: None.

