


Abstract
Investigators have used administrative claims to better understand cancer outcomes when a research question cannot feasibly be examined within a study. The Prostate Cancer Prevention Trial (PCPT) showed that seven years of finasteride reduced prostate cancer (PC) risk by 25% in men age 55 years or older. However, it was unclear whether the observed reduction in PC for finasteride participants would be maintained after finasteride discontinuation.
We examined PC diagnoses identified by PCPT study records and Medicare claims (finasteride = 9423, placebo = 9457). A Medicare-defined PC diagnosis algorithm was defined using diagnosis and procedure codes. Multivariable Cox regression was used to examine time to PC within prespecified follow-up windows (<6.5, 6.5–7.5, and >7.5 years) using time-dependent covariates interacting with intervention assignment to account for the PCPT protocol–specified end-of-study biopsy at seven years. All statistical tests were two-sided.
Median follow-up using the linked database was 16 years. Overall, finasteride arm participants had a 21.1% decrease in the hazard ratio of PC (hazard ratio [HR] = 0.79, 95% confidence interval [CI] = 0.74 to 0.84, P < .001). The beneficial effect of finasteride in reducing the hazard ratio of PC was most pronounced in the first 7.5 years (HR = 0.71, 95% CI = 0.66 to 0.77, P < .001), consistent with the original study findings; after 7.5 years, there was no increased risk of PC for finasteride arm participants (HR = 1.10, 95% CI = 0.96 to 1.26, P = .18).
Finasteride provides a substantial reduction in PC through 16 years of follow-up. There was no strong evidence that the benefit of finasteride diminished after the end-of-study follow-up. Utilizing Medicare claims to augment PCPT follow-up illustrates how the novel use of secondary data sources can enhance the ability to detect long-term outcomes from prospective studies.
Prostate cancer (PC) is the most commonly diagnosed cancer in men in the United States; 161 360 cases will be diagnosed and 26 730 men will die of the disease in 2017 (1,2). Large randomized trials have been conducted examining interventions to reduce PC risk. In the mid-1990s, investigators launched the Prostate Cancer Prevention Trial (PCPT) to examine whether finasteride, a 5-alpha reductase inhibitor (5-ARI) that inhibits the development of the potent androgens that fuel malignancy, could prevent the development of PC. The PCPT was a large, placebo-controlled, double-blind randomized trial that showed that seven years of finasteride reduced PC risk by 25% (3). Because the trial was limited to seven years of follow-up, it was unclear if the trial duration was sufficient to determine the maximum benefit of the intervention. Moreover, a concern was that the reduced risk of PC seen in subjects receiving finasteride might not be maintained after finasteride discontinuation.
Investigators have used administrative claims data to better understand cancer outcomes when a research question cannot feasibly be examined within the context of a study. Medicare claims data have been linked to cancer registry data, but rarely to clinical records from randomized clinical trials (4). We established a linkage between the clinical records from the PCPT and Medicare claims data. The use of Medicare claims to provide indicators of long-term follow-up for clinical trial participants allows critical research questions to be examined at minimal cost. We previously used this approach to investigate late effects of treatment interventions (5,6). This linkage can be especially powerful for examining issues related to PC, as Medicare participants are primarily age 65 years or older and PC is a disease of older men (7). We used this linkage to examine patterns of PC diagnoses in PCPT subjects beyond the seven years of study follow-up.
Methods
Clinical Trial Details
The PCPT was conducted by SWOG, a National Cancer Institute–sponsored network group. The trial randomly assigned 18 880 eligible men from 1993 to 1997 to finasteride or placebo daily for seven years. Eligible men must have been age 55 years or older with normal digital rectal examination and prostate-specific antigen (PSA) of 3.0 ng or less per milliliter. Men were followed for seven years. The trial results indicated a 25% reduction in the prevalence of PC in men receiving finasteride (3). Finasteride participants had worse, though short-lived, sexual function symptoms and fewer urinary symptoms (3,6,8).
Data Linkage to Medicare Claims
To examine PC risk beyond the seven-year study period, we linked PCPT clinical records to participants’ Medicare claims data according to common social security number, sex, and date of birth. Medicare claims were available from 1999 to 2011. The linkage enabled PC to be identified by both clinical records and Medicare claims. Because all men in the PCPT were at risk of a PC diagnosis, all were included in this analysis.
A linkage to the Medicare database required that participants have had one or more years of continuous Medicare Parts A&B coverage at any time after PCPT registration to ensure sufficient coverage time to identify a PC diagnosis. Because Medicare claims are not applicable for HMO individuals, participants must simultaneously have had no HMO coverage for one or more continuous years. Medicare records included physician supplier Part B, hospital outpatient, and hospital inpatient claims. Participants need not have been age 65 years or older at random assignment, but instead, could have aged into the Medicare claims cohort. The date of death was based on the SWOG clinical record when available, or on Medicare records. Trial demographic factors (age 55–59 years vs 60–64 years vs 65 years or older), race (black vs nonblack), and positive family history of PC in a first-degree relative (yes vs no) were obtained from patient self-report.
Written informed consent for the clinical protocol was previously obtained for all participants. Approval to conduct this research was obtained from the Institutional Review Board of Cancer Research and Biostatistics (Seattle, WA).
Definition of Prostate Cancer Diagnoses
Multiple claims-based algorithms for identification of prostate cancer were examined; the specificity, sensitivity, positive predictive value, and negative predictive value of the algorithms were calculated based on comparisons with SWOG PC diagnoses (assumed to be the “gold standard”) among men with concurrent coverage in both databases, and a best algorithm was identified (Supplementary Methods and Supplementary Table 1 and 2, available online). A Medicare-defined diagnosis was identified as any hospital claim—or two or more physician or outpatient claims at least 30 days apart but no more than six months apart—for PC using ICD9 code 185. Multiple (≥2) ICD9 185 codes to identify PC have previously been used (9). Because the ICD9 code for PC does not distinguish different Gleason levels, no categorization by grade was possible using claims. Any participant with a procedure code for radical prostatectomy (ICD9 and HCPCS codes in Supplementary Table 1, available online) was also considered to have PC, even without a diagnosis code. If participants had a PC diagnosis identified in both the study clinical record and Medicare claims, the earliest date of diagnosis was used.
Statistical Analysis
To estimate the rate of PC by arm, and to incorporate time until evidence of an event and to account for the potential competing risk of death, we used cumulative incidence to derive estimates of PC at five, 10, and 15 years after registration. Participants who died were censored at their date of death; if no death was observed, the date of last contact was used (derived either from SWOG or Medicare data).
The PCPT was designed to detect PC either by “for-cause” biopsies based on annual screenings with digital rectal exams suspicious for PC, by an elevated PSA (> 4.0 ng/mL, adjusted for finasteride use), or by end-of-study biopsies at year 7, recommended for all men for whom PC had not been previously diagnosed. This approach was used to avoid potential bias by random assignment due to the known effect of finasteride on PSA level. Therefore, a bolus of PCs was detected at year 7, complicating inference based on traditional modeling techniques. To formally test the intervention effect, Cox regression was used to examine time to PC, with the intervention assignment (0 = placebo, 1 = finasteride) as the main predictor variable (10). Although this model will give the average overall effect of the intervention throughout the entire follow-up period, it does not account for potential differing treatment effects within critical periods of follow-up. Thus in additional analyses, we established a 12-month window around the seven-year end-of-study biopsy time and examined the intervention effect within the first 6.5 years, from 6.5 years to 7.5 years, and after 7.5 years in separate models. The variables defining these periods were modeled as time-dependent covariates (coded as “1” when within the period and “0” otherwise) interacting with intervention assignment. This approach reflects Cox regression with a change point and allows separate estimation of the effect of the intervention within the different defined periods of follow-up (11,12). Proportional hazards within each time window were assessed by testing the interaction of intervention with the log of time.
In some instances, gaps in observation occurred between the participant’s last recorded date of SWOG contact and the start of Medicare coverage. After the start of Medicare coverage, gaps also occurred for participants who dropped out of Medicare for more than 3 months and then regained coverage (gaps <3 months were ignored to allow for minor administrative switching between plans). In either case, participant time at risk in the Cox model included only the time under observation. Regression covariates included age, race, and family history of PC, as these factors are related to prostate cancer diagnosis. Two-sided tests are reported, and a P value of less than .05 was considered statistically significant.
Results
Participant Characteristics
A total of 18 880 eligible participants (finasteride = 9423; placebo = 9457) from the PCPT were randomly assigned to finasteride or placebo. All are included in this analysis; 75.1% (n = 14 176) had a linkage to Medicare claims (finasteride = 7069; placebo = 7107).
Participants were well balanced by age, race, ethnicity, PC in a first-degree relative, and PSA level at study entry (Table 1). Participant characteristics by arm among those with a Medicare linkage were also well balanced. The median time from trial random assignment to the end of Medicare coverage for those linked to the Medicare database was 16 years for both the finasteride (range = 3.7–18.0 years) and placebo (range = 2.8–18.0 years) groups. The total numbers of years under Medicare observation were 106 496 for finasteride and 106 771 for placebo. Of the 14 176 participants with a link to Medicare, 2037 (14.4%) had a gap in coverage between the end of SWOG observation and the beginning of Medicare observation. The median length of the gap was 1.6 years.
Descriptive characteristics of PCPT participants by treatment arm
| Variable | All PCPT No. (%) | Linked to Medicare No. (% of all PCPT) | ||
|---|---|---|---|---|
| Placebo | Finasteride | Placebo | Finasteride | |
| All men | 9457 | 9423 | 7107 (75.2) | 7069 (75.0) |
| Age, y | ||||
| <60 | 2956 (31.3) | 2955 (31.4) | 2267 (76.7) | 2299 (77.8) |
| 60–64 | 2827 (29.9) | 2970 (31.5) | 2150 (76.1) | 2238 (75.4) |
| ≥65 | 3674 (38.9) | 3498 (37.1) | 2690 (73.2) | 2532 (72.4) |
| Race or ethnic group* | ||||
| Non-Hispanic white | 8724 (92.3) | 8682 (92.1) | 6591 (75.6) | 6549 (75.4) |
| Non-Hispanic black | 354 (3.7) | 359 (3.8) | 263 (74.3) | 252 (70.2) |
| Hispanic | 236 (2.5) | 261 (2.8) | 155 (65.7) | 180 (69.0) |
| Other | 143 (1.5) | 121 (1.3) | 98 (68.5) | 88 (72.7) |
| Prostate cancer in a first-degree relative | ||||
| Negative | 8002 (84.6) | 7965 (84.5) | 6038 (75.5) | 5950 (74.7) |
| Positive | 1455 (15.4) | 1458 (15.5) | 1069 (73.5) | 1119 (76.7) |
| PSA level at study entry, ng/mL | ||||
| 0.0–1.0 | 4639 (49.1) | 4493 (47.7) | 3481 (75.0) | 3411 (75.9) |
| 1.1–2.0 | 3311 (35.0) | 3397 (36.1) | 2473 (74.7) | 2517 (74.1) |
| 2.1–3.0 | 1507 (15.9) | 1533 (16.3) | 1153 (76.5) | 1141 (74.4) |
Race/ethnicity obtained by patient self-report. PCPT = Prostate Cancer Prevention Trial; PSA = prostate-specific antigen.
Prostate Cancer Diagnoses
We identified 3244 participants diagnosed with PC, 1805 in the placebo arm and 1439 in the finasteride arm. In total, 895 (528 placebo, 367 finasteride) diagnoses were derived from SWOG clinical records alone, 959 (455 placebo, 504 finasteride) from Medicare records alone, and 1390 (822 placebo, 568 finasteride) from both databases. Of the 2349 diagnoses identified by Medicare claims, 1879 (80.0%) were identified based on an ICD9 diagnosis of PC alone, 78 (3.3%) based on a procedure code for prostatectomy alone, and 392 (16.7%) based on both an ICD9 code and a procedure code.
Long-term Cumulative Incidence of Prostate Cancer
The cumulative incidence of PC based on SWOG clinical records alone through 7.5 years is illustrated in Figure 1A, which also indicates the bolus of cases identified by the end-of-study biopsy (at year 7). For comparison, the cumulative incidence of PC using both SWOG and Medicare claims is shown in Figure 1B.
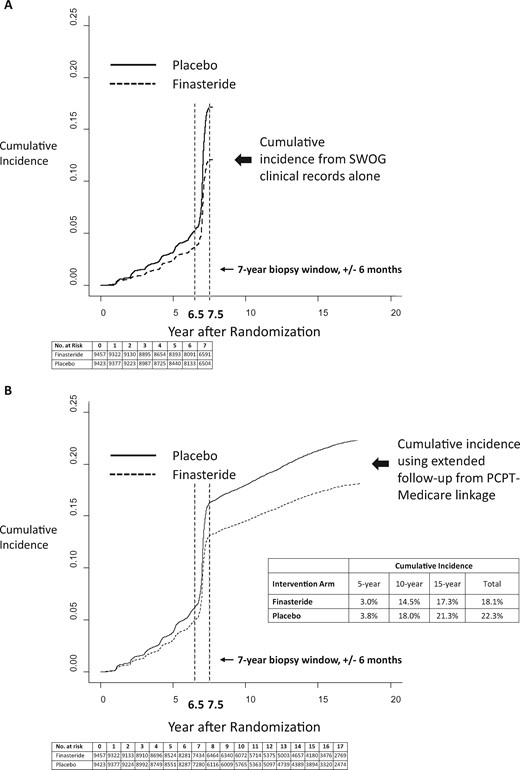
Cumulative incidence of prostate cancer by type of database. Cumulative incidence of prostate cancer was identified using SWOG clinical records alone (A) compared with using the combination of SWOG clinical records and Medicare claims data (B) by intervention arm (finasteride vs placebo). Cumulative incidence curves are drawn on the same scale. The time point of 7.5 years is highlighted to indicate the end of case ascertainment on the main component of the Prostate Cancer Prevention Trial. The time point of 6.5 years is also highlighted to indicate the beginning of the end-of-study biopsy window. The curves representing the cumulative incidence of death as a competing risk were suppressed to emphasize the examination of the cumulative incidence of prostate cancer diagnoses. PCPT = Prostate Cancer Prevention Trial.
Over the entire period, the cumulative incidence of PC was 22.3% for placebo arm participants and 18.1% for finasteride participants (Figure 1B). In total through the first 7.5 years, finasteride arm participants had a 29.1% decreased hazard ratio of PC (hazard ratio [HR] = 0.71, 95% confidence interval [CI] = 0.66 to 0.77, P < .001) (Figure 2). In contrast, after 7.5 years, the confidence interval for the intervention effect included 1.0 (HR = 1.10, 95% CI = 0.96 to 1.26, P = .18) (Figure 2). This result indicates there was no strong statistical evidence that the cumulative incidence curves were either converging or diverging after 7.5 years. Indeed, a test for heterogeneity (interaction test) was strongly statistically significant (P < .001), illustrating the differing patterns of association between intervention assignment and prostate cancer diagnosis before and after the 7.5-year time point (Figure 2). Therefore, while previous reductions were maintained, there was also no added benefit due to finasteride.
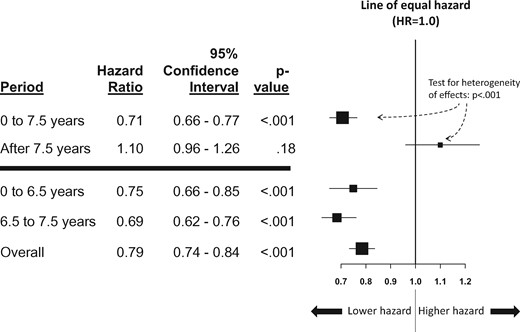
Forest plot of the hazard ratio of time to prostate cancer for finasteride vs placebo. The vertical line indicates the line of equal hazard (1.0). The boxes indicate the estimated hazard ratio, and the horizontal lines around each box indicate the 95% confidence intervals. Hazard ratios to the left of the line of equal hazard indicate reduced hazard (ie, risk) of prostate cancer for participants in the finasteride arm, and to the right, reduced hazard of prostate cancer for participants in the placebo arm. Hazard ratios and P values were from multivariable Cox regression analyses adjusted for age (55–59, 60–64, 65+ years), race (black, nonblack), and family history of prostate cancer. The primary comparison between 0–7.5 years vs >7.5 years is shown above the horizontal blue bar, including the test for heterogeneity (interaction test). All statistical tests were two-sided. HR = hazard ratio.
A decrease in the hazard ratio of PC was evident for finasteride arm participants within the first two periods (0 to 6.5 years and 6.5 to 7.5 years) (Figure 2). Throughout the entire course of follow-up, finasteride arm participants had a 21.1% decrease in the hazard ratio of PC in regression analysis (HR = 0.79, 95% CI = 0.74 to 0.84, P < .001) (Figure 2).
There was no evidence that the proportional hazards assumption was violated within any time window (P = .50, P = .23, and P = .51, respectively) (Figure 3, A–C, respectively). Additional sensitivity analyses provided consistent results under alternative algorithms for identifying PC using Medicare claims (Supplementary Methods and Supplementary Figure 1, available online). When radiation therapy codes were also used to identify prostate cancer diagnoses, the results were similar (Supplementary Methods and Supplementary Tables 3 and 4, available online).
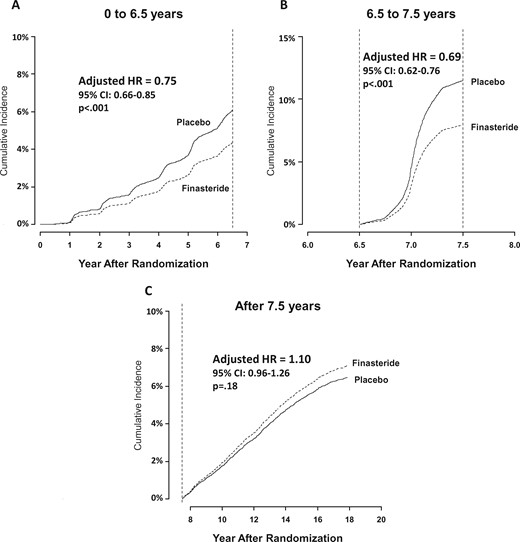
Cumulative incidence of prostate cancer by arm and follow-up time period. A) Initial 6.5 years of follow-up only. B) Those individuals with no prostate cancer event prior to 6.5 years, with time at 6.5 years set to zero and follow-up censored at 7.5 years. C) Individuals with no prostate cancer event prior to 7.5 years, with time at 7.5 years set to zero. For each panel, the curves representing the cumulative incidence of death as a competing risk were suppressed to emphasize the examination of the cumulative incidence of prostate cancer diagnoses. P values were derived from Cox regression with a change point and were two-sided. There was no evidence that the proportional hazards assumption was violated within any time window (Panel A, p = .50; Panel B, p = .23; Panel C, p = .51). CI = confidence interval; HR = hazard ratio.
Analyses to Evaluate Potentially Biased Assessment Using Medicare Claims
To evaluate the potential for biased detection of PC by intervention arm using Medicare claims, we examined both prostate cancer–specific and overall health care utilization patterns in the first year under Medicare observation. The total number of prostate cancer screening claims (13 228 vs 12 457 starting at random assignment and 12 455 vs 11 807 starting at 7.5 years after random assignment) (see claim codes for prostate cancer screening in the Supplementary Methods, available online), the total number of unique hospital inpatient or physician outpatient visits (3204 vs 3277), and the total number of overall claims (302 183 vs 308 279) were similar for finasteride and placebo participants, respectively. Further, among the 1390 participants identified as having PC in both databases, there was no evidence of a differential pattern by arm in the difference in diagnosis dates (P = .88) (Supplementary Methods and Supplementary Table 5, available online). Finally, among those who survived event-free by the end of the PCPT trial period, patterns of baseline demographic and clinical risk factors were similar between participants with and without a linkage to Medicare data, and between finasteride and placebo participants, both overall and in the subset with a linkage to Medicare data (Supplementary Table 6, available online). Therefore, there was no statistical evidence that the use of Medicare claims introduced bias by arm with respect to the identification of PC cases through increased prostate cancer screening, increased care utilization, or the timing of PC diagnoses.
Discussion
By linking PCPT clinical records to Medicare claims, we examined the risk of PC in individuals randomly assigned to finasteride or placebo well beyond the protocol-specified follow-up of seven years. The use of Medicare records identified 42.0% more cases of PC according to diagnostic and procedure codes. Consistent with the original report, we found that finasteride arm participants had a decreased risk of PC both prior to the seven-year biopsy assessment window (25.2%) and including the seven-year biopsy window (29.1%). Importantly, although there was no added benefit of finasteride use in preventing PC after treatment was discontinued, there was also no strong evidence that finasteride participants had more PCs than other participants after completing finasteride use, which could occur if, on average, finasteride use simply delayed, rather than prevented, PC diagnosis. With an overall median follow-up of 16 years, finasteride arm participants had a 21.1% decreased risk of PC, raising the intriguing possibility that time-limited use of finasteride can reduce PC diagnoses over the long term.
Studying interventions to prevent cancer can be challenging. Often cancer prevention trials involve following a large number of participants for many years, as the number of cancers occurring during the study is likely to be small. For this reason, the costs of conducting such studies are very high (13,14). The innovative use of “passive” follow-up to identify cancers using claims data or electronic health records could reduce such costs. A combined approach could leverage the years of design, monitoring, and analysis experience of clinical trial groups to launch trials, including baseline data collection, random intervention assignment, short-term follow-up, and quality assurance; long-term follow-up could then be obtained by utilizing secondary clinical or administrative data sources such as Medicare claims. Figure 1 graphically illustrates the benefit of this approach, showing how using Medicare claims allowed investigators to extend median follow-up for PCPT participants from seven to 16 years. To enable use of a secondary data source, one requirement would be the collection of a common subject identifier (such as the social security number) to link clinical to administrative records, or alternatively, the commitment of participating clinical centers to provide access to participants’ electronic health records to investigators. In both cases, prospective participant consent would ensure that the linkage between clinical and administrative records would be conducted in a timely fashion. This approach could be advantageous in any disease setting where events are rare, such as adjuvant breast cancer and early-stage PC.
Administrative data have been used to identify new cancer cases, recurrent cancer cases, quality of cancer care, and long-term toxicities from cancer treatment (15–19). Several studies have relied on Medicare claims to examine outcomes of PC or its treatments in observational study settings (20,21). One limitation is the absence of information about Gleason grade to distinguish high-grade cancers. Also, specific claims for the use of oral medications such as finasteride—which can now be obtained using Medicare Part D claims—were not available for use with this study. An additional concern is misclassification bias when administrative records alone are the data source (17,22). In our study, misclassification bias is likely in some instances. This could occur if PC diagnosis codes were used for screening tests for PC. Alternatively, subjects with certain procedure claims (ie, orchiectomy, radiation therapy) were not coded as prostate cancer cases in the absence of an ICD9 diagnosis code given the possibility of uncertain attribution to a prostate cancer diagnosis, although a sensitivity analysis including radiation therapy codes showed similar results. Importantly, estimates of sensitivity (83.3%) and specificity (96.3%) using Medicare claims to identify cases was high for the primary claims-based algorithm used in this analysis (Supplementary Methods and Supplementary Table 2, available online); however, the positive predictive value was lower (67.8%). One distinguishing characteristic of our study is that the intervention arm was determined by random assignment in a large, prospective prevention trial, and the proportion of cases successfully linked to claims was high (75.1%). In addition, our findings rely on the combination of clinical records and administrative claims, rather than administrative claims alone, and the findings were robust under different claims-based algorithms (Supplementary Figure 1, available online) (19). Nonetheless, one quarter of participants lacked an administrative Medicare claim, leaving open the possibility of differential ascertainment of prostate cancer diagnosis by claims data.
The use of secondary data sources may be especially vital when controversy surrounds particular study findings. The net clinical benefit of the PCPT findings of a 24.8% reduction in prostate cancer prevalence was questioned given an observed increase in high-grade cancers (23). The safety label for 5-ARI drugs currently informs health care professionals about a potentially increased risk of being diagnosed with a more serious form of prostate cancer (24). However, subsequent research suggested that finasteride administration induced artefacts and biases in PC detection; by accounting for these biases, the increase in high-grade cancers diminished (25). For men receiving finasteride, long-term follow-up using Medicare claims has indicated no evidence of additional adverse events, and long-term survival analysis using the Social Security Death Index found no increased or decreased risk of death (HR = 1.02, 95% CI = 0.97 to 1.08, P = .46) (6,26). The absence of a survival difference was confirmed in a separate recent study (27). Given the numerous adverse consequences of PC treatment and the outcomes of those treatments (28), the potential to reduce new PC cases using finasteride could have substantial public health implications.
Using an innovative linkage between the PCPT and Medicare claims, we found that finasteride provides a substantial reduction in risk of PC through a median of 16 years of follow-up. Together with prior research, finasteride emerges as a low-cost generic drug with minimal side effects, a reduction in PC diagnoses during seven years of finasteride use that is maintained after completion, and no beneficial or harmful impact on survival. The use of Medicare claims data to augment follow-up for PCPT participants illustrates how the use of secondary data sources can enhance the ability to detect outcomes over the long term from prospective studies.
Funding
This work was supported by the National Cancer Institute of the National Institutes of Health (grant numbers UG1CA189974, 5UM1CA182883, and U10CA37429).
Notes
Affiliations of authors: SWOG Statistical Center, Public Health Sciences Division, Fred Hutchinson Cancer Research Center, Seattle, WA (JMU, CT, CMT, WEB, PJG, SDR); Columbia University Medical Center, New York, NY (DLH); Medical Center, CHRISTUS Santa Rosa Hospital, San Antonio, TX (IMTJr).
The content is solely the responsibility of the authors and does not necessarily represent the official views of the National Institutes of Health.
The study funder had no role in the design and conduct of the study; collection, management, analysis, or interpretation of the data; preparation, review, or approval of the manuscript; or the decision to submit the manuscript for publication.
The authors have conflicts of interest to report.
References
Centers for Disease Control and Prevention. Cancer prevention and control. Cancer among men. http://www.cdc.gov/cancer/dcpc/data/men.htm. Accessed April 27, 2017.
Food and Drug Administration. FDA Drug Safety Communication: 5-alpha reductase inhibitors (5-ARIs) may increase the risk of a more serious form of prostate cancer.

