


Abstract
Exercise effects in cancer patients often appear modest, possibly because interventions rarely target patients most in need. This study investigated the moderator effects of baseline values on the exercise outcomes of fatigue, aerobic fitness, muscle strength, quality of life (QoL), and self-reported physical function (PF) in cancer patients during and post-treatment.
Individual patient data from 34 randomized exercise trials (n = 4519) were pooled. Linear mixed-effect models were used to study moderator effects of baseline values on exercise intervention outcomes and to determine whether these moderator effects differed by intervention timing (during vs post-treatment). All statistical tests were two-sided.
Moderator effects of baseline fatigue and PF were consistent across intervention timing, with greater effects in patients with worse fatigue (Pinteraction = .05) and worse PF (Pinteraction = .003). Moderator effects of baseline aerobic fitness, muscle strength, and QoL differed by intervention timing. During treatment, effects on aerobic fitness were greater for patients with better baseline aerobic fitness (Pinteraction = .002). Post-treatment, effects on upper (Pinteraction < .001) and lower (Pinteraction = .01) body muscle strength and QoL (Pinteraction < .001) were greater in patients with worse baseline values.
Although exercise should be encouraged for most cancer patients during and post-treatments, targeting specific subgroups may be especially beneficial and cost effective. For fatigue and PF, interventions during and post-treatment should target patients with high fatigue and low PF. During treatment, patients experience benefit for muscle strength and QoL regardless of baseline values; however, only patients with low baseline values benefit post-treatment. For aerobic fitness, patients with low baseline values do not appear to benefit from exercise during treatment.
There is evidence from randomized controlled trials (RCTs) that exercise has beneficial effects on fatigue, physical fitness, quality of life (QoL), and self-reported physical function (PF) during and post cancer treatment (1–7). The magnitude of these effects, however, is often small to moderate (2,3,8–10). One explanation for these modest effects may be the lack of specifically targeting those patients who are most likely to benefit from exercise interventions. For other types of supportive care interventions, such as psychosocial interventions, greater effects on distress and QoL are often found in patients with higher distress (11–13) and lower QoL (14). Consequently, some RCTs have screened for distress prior to enrolling patients into a psychosocial intervention (15–18). In our previous meta-analysis on individual patient data (IPD), we found that 36% of RCTs evaluating the effects of psychosocial interventions specifically targeted patients with psychosocial symptoms and, in general, these RCTs showed larger intervention benefits (19). Thus, targeting psychosocial interventions to patients with worse symptoms and QoL seems useful and economical. Whether this principle is also the case for exercise interventions is unknown.
Only a limited number of exercise intervention studies have evaluated the moderator effect of baseline fatigue, physical fitness (ie, aerobic fitness and muscle strength), QoL, and PF on intervention effects in patients with cancer (20–24). Studying these moderator effects may help to identify subgroups of patients for whom exercise interventions are especially beneficial or futile (25,26). Results from previous RCTs have shown that the effects of exercise interventions on fatigue were greater in patients with higher baseline fatigue (22,23). Also, exercise intervention effects on QoL were greater in patients who had completed chemotherapy with higher baseline fatigue (20) and in patients with lymphoma with lower baseline QoL (21). Comparably, in patients undergoing allogeneic stem cell transplantations, greater effects on physical fitness were found in unfit patients compared with fit patients (27).
The aims of exercise interventions differ across the cancer continuum. Exercise interventions during primary cancer treatment, especially chemotherapy, typically aim to prevent declines in functioning and ameliorate treatment side-effects, while exercise interventions post-treatment aim to improve functioning (28). Therefore, it may also be important to identify when targeting exercise interventions to baseline values of fatigue, physical fitness, QoL, and PF would be most useful. Because it may be important to prevent declines in functioning during primary cancer treatment in all patients regardless of baseline functioning, we studied whether the benefit from exercise during cancer treatment was independent of baseline value. Conversely, post-treatment, we hypothesized greater benefits on fatigue, physical fitness, QoL, and PF in patients with worse baseline values.
Using data collected in the Predicting Optimal Cancer Rehabilition and Supportive Care (POLARIS) study (26), this IPD meta-analysis aimed to study the moderator effects of baseline values on the exercise response for fatigue, physical fitness, QoL, and PF and to examine whether these moderator effects differ by intervention timing (during vs post-treatment).
Methods
Study Inclusion and Characteristics
The POLARIS study is an international collaboration in which IPD of RCTs were harmonized for pooled analyses (26). POLARIS included RCTs that evaluated the effects of exercise and/or psychosocial interventions on QoL compared with a wait list, usual care, or attention control group in adult (≥18 years) patients with cancer. Eligible studies were identified via systematic searches in electronic databases, reference checking of systematic reviews, meta-analyses, and personal communication with collaborators, colleagues, and other experts in the field. Details of the study design, procedures, search strategies, study inclusion, sample, and quality were published previously (4,26). The study protocol was registered in PROSPERO in February 2013 (CRD42013003805).
IPD from 34 (n = 4519 patients) of 69 RCTs (response 49%) evaluating the effects of exercise were included (4). These 34 RCTs were a representative sample of the published RCTs evaluating exercise intervention effects on QoL and PF (4). The moderator effects of demographic, clinical, and intervention-related variables for QoL (4), physical fitness (6), and fatigue (7) are reported elsewhere.
Exercise Interventions
Details of the different exercise interventions were published previously (4). Study, intervention, and exercise characteristics of included studies and preintervention values of fatigue, physical fitness, QoL, and PF are presented in Table 1. Of 34 RCTs, 17(33,35–50) focused on patients with breast cancer, five (34,51–54) on various cancer types, five (23,55–58) on prostate cancer, three (59–61) on hematological cancer, one (62) on colorectal cancer, and one (63) on lung cancer. Two RCTs (29–32) included patients with breast and colon cancer, of which results were published in separate reports. Three RCTs specifically targeted patients with menopausal symptoms (38), lymphedema (risk) (47), or multiple physical or psychosocial problems (53), but no studies specifically targeted patients with fatigue, low fitness, or poor QoL. Fourteen (23,33,40,41,43–45,48–50,52,56–58) RCTs excluded patients who participated in regular physical activity or exercise.
Descriptives of study, intervention, and exercise characteristics of included studies (n = 34) and baseline values of outcomes of participants (n = 4519)
| Characteristic | No. of studies | No. of participants in the studies |
|---|---|---|
| Study characteristics | ||
| Country | ||
| United States | 8 | 860 |
| The Netherlands | 7 | 1360 |
| Australia | 6 | 899 |
| Canada | 4 | 518 |
| Germany | 4 | 367 |
| United Kingdom | 3 | 360 |
| Spain | 1 | 16 |
| Norway | 1 | 139 |
| Sample size | ||
| 0–100 | 13 | 799 |
| >100–200 | 13 | 1678 |
| >200–300 | 7 | 1712 |
| >300 | 1 | 330 |
| Cancer type* | ||
| Breast cancer | 19 | 2754 |
| Mixed cancer types | 5 | 819 |
| Prostate cancer | 5 | 426 |
| Haematological | 3 | 311 |
| Colon cancer | 3 | 158 |
| Lung cancer | 1 | 51 |
| Intervention characteristics | ||
| Intervention timing | ||
| Pre-during-post cancer treatment | 1 | 80 |
| During and/or post cancer treatment | 3 | 418 |
| During cancer treatment | 13 | 1808 |
| During chemotherapy | 4 | 820 |
| During radiotherapy | 1 | 141 |
| During chemotherapy and/or radiotherapy | 4 | 524 |
| During androgen deprivation therapy | 4 | 326 |
| Post cancer treatment | 17 | 2213 |
| Intervention delivery mode† | ||
| Supervised | 25 | 3091 |
| Unsupervised | 10 | 1513 |
| Intervention duration | ||
| ≤ 12 weeks | 13 | 1523 |
| 12–24 weeks | 11 | 1824 |
| >24 weeks | 10 | 1172 |
| Type of control group‡ | ||
| Usual care | 19 | 2582 |
| Wait-list | 9 | 1364 |
| Attention control | 7 | 607 |
| Exercise characteristics | ||
| Frequency, times per week† | ||
| 2 | 19 | 2742 |
| 3–4 | 8 | 1081 |
| ≥ 5 | 6 | 730 |
| Unknown | 1 | 51 |
| Intensity§ | ||
| Low-moderate | 2 | 327 |
| Moderate | 13 | 1528 |
| Moderate-high | 16 | 1926 |
| High | 2 | 389 |
| Unknown | 3 | 525 |
| Type‖ | ||
| Aerobic exercise | 12 | 1374 |
| Aerobic + resistance exercise | 16 | 2253 |
| Resistance exercise | 5 | 774 |
| Resistance + impact exercise | 4 | 332 |
| Mean session duration¶ | ||
| 0–30 min | 10 | 1486 |
| >30–60 min | 19 | 2479 |
| >60 min | 4 | 502 |
| Unknown | 2 | 137 |
| Outcome measure | ||
| Fatigue | 31 | 4366 |
| Aerobic fitness | 21 | 2742 |
| Upper body muscle strength | 19 | 2546 |
| Lower body muscle strength | 18 | 2258 |
| Quality of life | 34 | 4519 |
| Physical function | 34 | 4519 |
n + 2, because two (29–32) RCTs included patients with breast and colon cancer with separate reports.
n + 1, because one RCT (31) included both a supervised (2 times per week) and an unsupervised (5 times per week) exercise study arm.
n + 1 because one RCT (33) included both a usual care and an attention control group.
n + 2, because one RCT (31) included a moderate intensity and moderate-high intensity study arm, and another RCT (34) included both a moderate and a vigorous intensity exercise study arm.
‖n + 3, because one RCT (31) had combined aerobic and resistance exercise study arm and an aerobic exercise study arm, one RCT (35) had an aerobic exercise and a resistance exercise study arm, and one RCT (23) had a combined resistance and aerobic exercise study arm and a combined resistance and impact loading exercise arm.
n + 1 because one RCT (31) had a study arm with 30 min/session and one with 60 min/session.
Outcome Variables
The current analyses used outcomes assessed at pre- and postintervention. Table 2 presents the different measures used to assess the outcomes. Fatigue, QoL, and PF were assessed by self-report. Physical fitness was measured objectively by assessing aerobic fitness and upper (UBMS) and lower body muscle strength (LBMS). To allow pooling of the different measures or questionnaires, we recoded the individual scores (pre- and postintervention) into z-scores by subtracting the mean preintervention score from the individual score and dividing the result by the standard deviation (SD) preintervention per measurement instrument. Subsequently, the pooled z-scores were used for further analyses.
Instruments used to assess the outcome measures and the baseline values
| Outcome measure | No. of studies (references) | Mean (SD) total sample* | Mean (SD) during treatment | Mean (SD) post-treatment |
|---|---|---|---|---|
| Fatigue (n = 4272) | ||||
| FACIT | 8 (35,37,39,43,46,55,59,62) | 37.1 (11.0) | 36.0 (11.5) | 39.1 (9.6) |
| MFI, general fatigue | 6 (29–31,34,53,60,61) | 12.1 (4.3) | 10.7 (4.1) | 13.5 (4.0) |
| EORTC QLQ-C30, fatigue | 5 (23,42,54,56,57) | 29.1 (22.3) | 24.9 (19.3) | 32.3 (23.8) |
| SF-36, vitality | 4 (36,38,41,47) | 55.3 (18.7) | 50.0 (9.5) | 55.7 (19.2) |
| Schwartz Cancer Fatigue Scale | 3 (49,50,58) | 10.4 (3.9) | 9.8 (4.0) | 10.6 (3.9) |
| FAQ, total | 2 (45,48) | 38.4 (21.8) | 38.4 (21.8) | N/A |
| Revised Piper Fatigue Scale | 2 (33,52) | 2.7 (1.9) | 2.4 (2.0) | 3.1 (1.8) |
| CIS, total | 1 (51) | 57.0 (26.1) | 57.0 (26.1) | N/A |
| Missing, n = 94 | ||||
| Aerobic fitness (n = 2322) | ||||
| PeakVO2, ml/kg/min | 11 | 23.5 (7.2) | 22.4 (7.1) | 24.2 (7.0) |
| Directly | 8 (29,30,34,35,37,42,59,60,62) | |||
| Indirectly via a submaximal exercise test | 2 (33,54) | |||
| Directly or indirectly, based on patient’s preference | 1 (52) | |||
| 400 meter walk test, s | 4 (23,55–57) | 272.6 (49.4) | 268.4 (50.4) | 282.3 (53.8) |
| 6 minute walk test, m | 2 (61,63) | 441.9 (109.2) | N/A | 441.9 (109.2) |
| 12 minute walk test, m | 1 (43) | 986.3 (222.8) | 986.3 (222.8) | N/A |
| Endurance test at 70% of Wmax, s | 1 (31) | 743.7 (530.0) | 743.7 (530.0) | N/A |
| Modified Balke test, s | 1 (62) | 367.3 (291.1) | 364.0 (300.1) | 383.2 (269.5) |
| Steptest, heartrate in beats per minute | 1 (39) | 120.4 (16.0) | 120.4 (16.0) | N/A |
| Missing, n = 2 | ||||
| Upper body muscle strength (n = 2255) | ||||
| Chest press, 1 repetition maximum, kg | 10 (23,35,44,47,55–58) | 34.0 (16.4) | 44.2 (16.1) | 24.5 (9.5) |
| Handgrip strength, kg | 4 (29,30,34,37,60) | 35.8 (10.3) | 32.9 (7.4) | 37.3 (11.2) |
| Elbow flexion with handheld dynamometer, Nm | 1 (31) | 29.9 (12.4) | 29.9 (12.4) | N/A |
| Chest press, number of repetitions at 30-35% body mass | 1 (40) | 0.1 (0.5) | N/A | 0.1 (0.5) |
| Sum upper body muscle strength (4 groups), N | 1 (61) | 154.1 (50.6) | N/A | N/A |
| Sum of left and right grip strength, kg | 1 (62) | 70.5 (22.5) | 71.9 (21.8) | 68.9 (23.6) |
| Upright row and shoulder press, stage | 1 (39) | 6.8 (3.1) | 6.8 (3.1) | N/A |
| Missing, n = 79 | ||||
| Lower body muscle strength (n = 2056) | ||||
| Leg press, 1 repetition maximum, kg | 9 (23,44,47,49,50,55–58) | 101.9 (43.6) | 124 (51.6) | 89.8 (32.7) |
| Quadriceps torque, Nm | 5 (29,30,33,45,48,60) | 104.6 (35.7) | 103.3 (28.5) | 107.5 (47.8) |
| Leg extension, 1 repetition maximum, kg | 1 (35) | 54.9 (26.6) | 54.9 (26.6) | N/A |
| Knee extension with handheld dynamometer, Nm | 1 (31) | 67.6 (19.1) | 67.6 (19.1) | N/A |
| Leg press, number of repetitions at 100–110% body mass | 1 (40) | 13.5 (7.2) | N/A | 13.5 (7.2) |
| Sum of lower body muscle strength (4 groups), N | 1 (61) | 186.1 (58.7) | N/A | N/A |
| Missing, n = 107 | ||||
| Quality of life (n = 4419) | ||||
| EORTC-QLQ-C30, global QoL | 17 (23,29,30,34,40,45,48–51,53–58,60,63) | 69.6 (19.0) | 71.7 (18.7) | 67.8 (18.7) |
| FACT-G, total score | 10 (33,35–37,39,41,43,46,59,62) | 81.3 (14.3) | 79.2 (14.6) | 84.1 (13.5) |
| SF-36, general health | 6 (38,42,47,49,50,52) | 66.3 (19.6) | 52.6 (13.9) | 68.7 (19.8) |
| Cares-SF, global QoL | 1 (44) | 48.2 (9.1) | N/A | 48.2 (9.1) |
| Missing, n = 100 | ||||
| Physical function (n = 4433) | ||||
| EORTC-QLQ-C30, physical function | 17 (23,29,30,34,40,45,48–51,53–58,60,63) | 83.4 (16.1) | 86.7 (14.5) | 79.6 (16.5) |
| FACT-G, physical well-being | 10 (33,35–37,39,41,43,46,59,62) | 21.9 (5.4) | 20.6 (5.9) | 23.7 (3.9) |
| SF-36, physical function | 6 (38,42,47,49,50,52) | 81.6 (17.6) | 85.6 (14.4) | 80.9 (18.0) |
| Cares-SF, physical function | 1 (44) | 46.6 (7.0) | N/A | 46.6 (7.0) |
| Missing, n = 86 | ||||
The SD values of the total group can be used to interpret the effect sizes, which are expressed in SD scores. CARES-SF = Cancer Rehabilitation Evaluation System-Short Form; CIS = Checklist Individual Strength; EORTC QLQ-C30 = European Organisation for Research and Treatment of Cancer Quality of Life Questionnaire–Core 30; FACT-G = Functional Assessment of Cancer Therapy-General; FACIT = Functional Assessment of Chronic Illness Therapy – Fatigue; FAQ = Fatigue Assessment Questionnaire; MFI = Multidimensional Fatigue Inventory; N/A = not applicable; peakVO2 = peak oxygen uptake; SF-36 = Short Form-36 Health Survey.
Statistical Analysis
Moderator effects of the baseline value of the outcome were studied using a one-step approach. Linear mixed model analyses with a two-level structure (1: patient, 2: study) were used to consider the clustering of patients within studies by using a random intercept on study level. The postintervention value (z-score) of the outcome was regressed on the intervention and adjusted for the baseline value (z-score) to limit regression to the mean (64,65). Moderator effects were examined by adding the interaction term of the moderator variable with the intervention into the regression model. We added a 3-way interaction of intervention × baseline value × intervention timing, along with the three corresponding two-way interactions to the model and intervention timing. A statistically significant three-way interaction indicates that the moderator effects of the baseline value of the outcome differ between interventions offered during vs post cancer treatment. In this case, we tested the moderator effects separately for interventions during and post cancer treatment. In case the three-way interaction was not statistically significant, the moderator effect of the baseline value (baseline value × intervention) was tested in the total group (ie, both during and post-treatment). We used the likelihood ratio test to compare models with and without interaction terms. Additionally, regression coefficients, 95% confidence intervals (CI), and corresponding P values of the interaction term were examined. In case the model improved statistically significantly by adding the interaction term or in case the interaction term was statistically significant, stratified analyses were conducted for intervention timing and for subgroups of baseline fatigue, aerobic fitness, UBMS, LBMS, QoL, and PF. For two-way interactions, we considered P ≤ .05 as statistically significant. For three-way interactions, we chose a cutoff of P ≤ .10 to reduce the risk for missing potential moderator effects. For the stratified analyses, we categorized the baseline values into four groups of SD scores (<-1 SD vs -1 SD to mean vs ≥mean to 1 SD vs >1 SD). The SD scores can be translated to the scores of the original measurement instrument of interest. All analyses were adjusted for age, sex, and cancer type. Because supervised exercise showed to have greater effects on all outcomes compared with unsupervised exercise (4,6,7), we conducted sensitivity analyses in the subgroup of patients who had received a supervised exercise intervention. All statistical tests were two-sided.
Results
Baseline values of fatigue, physical fitness, QoL, and PF are presented in Table 2. As also reported previously (4,6,7), linear mixed model analyses showed that exercise statistically significantly reduced fatigue (β=−0.17, 95%CI=−0.22 to −0.12, P < .001; I2 =37.8%, P = .02) and improved aerobic fitness (β = 0.28, 95%CI = 0.22 to 0.33, P < .001; I2=81.0%, P < .001), UBMS (β = 0.18, 95%CI = 0.13 to 0.24, P < .001; I2=65.6%, P < .001), LBMS (β = 0.27, 95%CI = 0.22 to 0.33, P < .001; I2=84.7%, P < .001), QoL (β = 0.15, 95%CI = 0.10 to 0.19, P < .001; I2=18.1%, P = 18), and PF (β = 0.18, 95%CI = 0.13 to 0.23, P < .001; I2=38.1%, P = .01) overall compared with the control condition.
Three-way interactions were statistically significant for aerobic fitness (Pinteraction = .04), UBMS (Pinteraction = .10), LBMS (Pinteraction = .05), and QoL (Pinteraction = .07) but not for fatigue (Pinteraction = .89) and PF (Pinteraction = .65) (Table 3). These interactions indicate that the moderator effects of the baseline values of aerobic fitness, UBMS, LBMS, and QoL differed between exercise interventions offered during vs post cancer treatment, whereas they did not differ for fatigue and PF.
Moderator effects of baseline values on the exercise intervention effect on outcome measures for the total group or stratified for interventions during and post cancer treatment in case of statistically significant moderator effect of timing
| Outcome measure | Three-way interaction | Moderator effect in total group | Moderator effect during cancer treatment | Moderator effect post cancer treatment | ||||
|---|---|---|---|---|---|---|---|---|
| P* | βinteraction (95%CI) | P* | βinteraction (95%CI) | P* | βinteraction (95%CI) | P* | βinteraction (95%CI) | |
| Fatigue | .89 | 0.007 (−0.10 to 0.11) | .05 | −0.05 (−0.10 to 0.000) | – | – | – | – |
| Aerobic fitness | .04 | −0.11 (−0.22 to −0.004) | – | – | .002 | 0.11 (0.04 to 0.18) | .95 | 0.002 (−0.08 to 0.08) |
| Upper body muscle strength | .10 | −0.10 (−0.21 to 0.02) | – | – | 1.00 | −0.00 (−0.09 to 0.09) | <.001 | −0.11 (−0.17 to −0.05) |
| Lower body muscle strength | .05 | −0.12 (−0.24 to 0.002) | – | – | .57 | 0.02 (−0.06 to 0.10) | .01 | −0.10 (−0.18 to −0.02) |
| Quality of life | .07 | −0.09 (−0.19 to 0.006) | – | – | .38 | −0.03 (−0.11 to 0.04) | <.001 | −0.13 (−0.19 to −0.06) |
| Physical function | .65 | −0.02 (−0.12 to 0.08) | .003 | −0.07 (−0.12 to −0.03) | – | – | – | – |
P values were calculated using a two-sided likelihood ratio test and examining the interaction term of the linear mixed model analyses. Analyses are adjusted for age, sex and cancer type. CI = confidence interval.
Across intervention timing, baseline PF statistically significantly moderated the exercise intervention effect on PF (Pinteraction = .003), and baseline fatigue statistically significantly moderated the exercise intervention effects on fatigue (Pinteraction = .05) (Table 3). The exercise intervention effect on PF was statistically significant when baseline PF was less than 1 SD greater than the mean (Table 4 and Figure 1). The exercise intervention effect on fatigue was statistically significant when baseline values of fatigue were at least 1 SD less than the mean.
Exercise intervention effects on outcomes for the total group and stratified per subgroup based on baseline standard deviation score, in case of statistically significant moderator effects of the baseline values
| Outcome | Overall effect | <1 SD below mean | 1 SD below mean to mean | Mean to 1 SD above mean | >1 SD above mean | Ptrend* | |||||
|---|---|---|---|---|---|---|---|---|---|---|---|
| n | β (95% CI) | n | β (95% CI) | n | β (95% CI) | n | β (95% CI) | n | β (95% CI) | ||
| All studies | |||||||||||
| Fatigue† | 3846 | −0.17 (−0.22 to −0.12)‡ | 649 | −0.03 (−0.13 to 0.08) | 1430 | −0.17 (−0.25 to −0.09)‡ | 1124 | −0.20 (−0.30 to −0.11)‡ | 643 | −0.22 (−0.37 to −0.07)‡ | <.001 |
| Physical function | 3984 | 0.18 (0.13 to 0.23)‡ | 649 | 0.27 (0.11 to 0.42)‡ | 890 | 0.22 (0.11 to 0.34)‡ | 1727 | 0.19 (0.12 to 0.25)‡ | 718 | 0.03 (−0.07 to 0.12) | <.001 |
| During cancer treatment | |||||||||||
| Aerobic fitness | 1374 | 0.25 (0.18 to 0.33)‡ | 211 | 0.07 (−0.12 to 0.26) | 510 | 0.20 (0.09 to 0.31)‡ | 453 | 0.32 (0.22 to 0.43)‡ | 200 | 0.38 (0.15 to 0.60)‡ | <.001 |
| Upper body muscle strength | 1106 | 0.25 (0.16 to 0.35)‡ | – | – | – | – | – | – | – | – | – |
| Lower body muscle strength | 1019 | 0.29 (0.20 to 0.37)‡ | – | – | – | – | – | – | – | – | – |
| Quality of life | 1914 | 0.15 (0.07 to 0.22)‡ | – | – | – | – | – | – | – | – | – |
| Post cancer treatment | |||||||||||
| Aerobic fitness | 843 | 0.33 (0.24 to 0.41)‡ | – | – | – | – | – | – | – | – | – |
| Upper body muscle strength | 904 | 0.10 (0.04 to 0.15)‡ | 168 | 0.21 (0.12 to 0.30)‡ | 458 | 0.19 (0.13 to 0.25)‡ | 180 | −0.04 (−0.16 to 0.08) | 98 | −0.06 (−0.17 to 0.06) | <.001 |
| Lower body muscle strength | 646 | 0.26 (0.18 to 0.34)‡ | 89 | 0.38 (0.25 to 0.51)‡ | 363 | 0.30 (0.21 to 0.39)‡ | 129 | 0.20 (−0.01 to 0.40)§ | 65 | 0.03 (−0.33 to 0.40) | <.001 |
| Quality of life | 1960 | 0.15 (0.09 to 0.21)‡ | 311 | 0.36 (0.17 to 0.55)‡ | 538 | 0.19 (0.06 to 0.32)‡ | 741 | 0.12 (0.03 to 0.21)‡ | 370 | −0.02 (−0.13 to 0.08) | .01 |
P value of the two-sided trend test. CI = confidence intervals; df = degrees of freedom; SD = standard deviation.
Higher scores on the fatigue scale indicate more fatigue.
P ≤ .05, P value of the two-sided linear mixed model analyses Analyses are adjusted for age, sex, and cancer type.
.05 < P ≤ .10. P value of the two-sided linear mixed model analyses. Analyses are adjusted for age, sex, and cancer type.
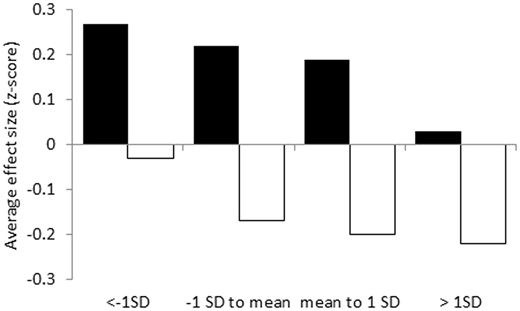
Exercise intervention effects on physical function (black bars) and fatigue (white bars) during and post cancer treatment, stratified for subgroups based on preintervention standard deviation (SD) score. Results were obtained using linear mixed model analyses with a two-level structure (1: patient, 2: study) to consider the clustering of patients within studies by using a random intercept on study level.
For exercise interventions during treatment, we found that the exercise intervention effect on aerobic fitness was moderated statistically significantly by its baseline value (Pinteraction = .002, Table 3) such that patients with low baseline aerobic fitness (≤1 SD below mean) did not statistically significantly benefit from the exercise intervention, whereas greater and statistically significant benefits were found in patients with higher aerobic fitness at baseline (Table 4; Figure 2).
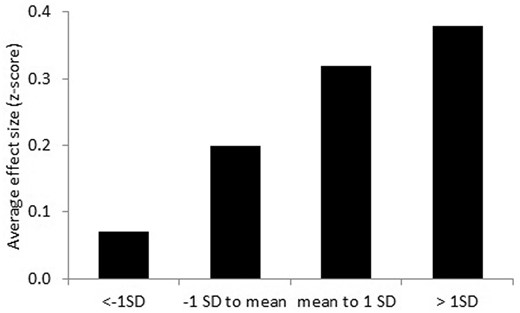
Exercise intervention effect on aerobic fitness during cancer treatment, stratified for subgroups based on preintervention standard deviation score. Results were obtained using linear mixed model analyses with a two-level structure (1: patient, 2: study) to consider the clustering of patients within studies by using a random intercept on study level.
For exercise interventions posttreatment, baseline values of UBMS (Pinteraction < .001), LBMS (Pinteraction = .01), and QoL (Pinteraction < .001) statistically significantly moderated the exercise intervention effects (Table 3). Stratified analyses of the exercise intervention effects post-treatment showed greater effects on UBMS and LBMS for patients with baseline values less than the mean, whereas effects on QoL were particularly pronounced for patients with baseline values of at least 1 SD less than the mean (Table 4; Figure 3).
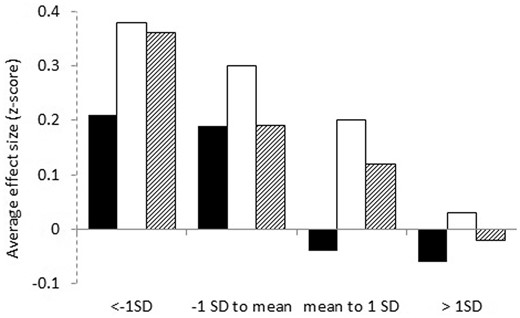
Exercise intervention effect on upper body muscle strength (black bars), lower body muscle strength (white bars) and quality of life (dashed bars) post cancer treatment, stratified for subgroups based on preintervention standard deviation score. Results were obtained using linear mixed model analyses with a two-level structure (1: patient, 2: study) to consider the clustering of patients within studies by using a random intercept on study level.
Results of the sensitivity analyses in patients who had received supervised exercise interventions were only slightly different. The moderator effect of the baseline value of aerobic fitness during cancer treatment was less pronounced (βinteraction = 0.07, 95%CI = −0.01 to 0.16, P = .08) (data not shown). Additionally, for UBMS, the difference in the moderator effect of baseline values between interventions during and post cancer treatment was greater (β3-way interaction = −0.21, 95%CI = −0.32 to −0.09, P < .001), but it did not change the conclusions.
Discussion
In this IPD meta-analysis, we investigated whether the effects of exercise interventions during treatment on fatigue, physical fitness, QoL, and PF were equally effective across patients with different baseline values, and whether the effects of exercise interventions on these outcomes post-treatment were greater in patients with worse baseline values. We found that baseline values did not statistically significantly moderate the exercise intervention effect on these outcomes during cancer treatment except for aerobic fitness. For exercise interventions post cancer treatment, baseline values of UBMS, LBMS, and QoL moderated the exercise intervention effect on these outcomes, with stronger effects in patients with worse baseline values and no statistically significant benefits for patients with baseline values more than 1 SD greater than the mean. For aerobic fitness, we found greater effects of exercise interventions during treatment in patients with higher baseline aerobic fitness, whereas baseline values did not moderate the exercise intervention effects post-treatment. Greater effects on fatigue and PF were found for patients with worse baseline fatigue and PF both during and post-treatment.
Our findings may have important clinical implications for identifying which subgroups of patients may benefit the most or least from exercise during and post cancer treatment for these specific outcomes. Although exercise should be encouraged for most patients with cancer (66), our results indicate that depending on the aim of the exercise intervention, certain subgroups of patients may not gain benefits for certain outcomes. Exercise interventions during treatment are effective in maintaining UBMS, LBMS, and QoL, regardless of the baseline value. Offering exercise interventions post treatment to patients with a relatively high UBMS, LBMS, and QoL (>1 SD greater than the mean on respective measures) does not appear to further improve these outcomes. A previous RCT in patients with lymphoma during or post chemotherapy also found greater effects on QoL in patients with lower baseline values (21), but this study did not disentangle differences in the moderator effects across timing of intervention delivery.
Our finding that exercise interventions during cancer treatment showed better effects on aerobic fitness in patients with higher baseline aerobic fitness was unexpected and counterintuitive. The stratified analysis showed, however, that it was only patients with values lower than 1 SD below the mean who did not benefit statistically significantly. This finding suggests that a minimum level of aerobic fitness may be needed to obtain an aerobic fitness response to an exercise intervention during cancer treatment. Perhaps, despite often being tailored to an individual’s capacity, exercise interventions during intensive cancer treatments may be too difficult for patients with low aerobic fitness, resulting in lower adherence. Previous studies have found aerobic fitness to be a predictor of exercise adherence during chemotherapy (67–69). Lower adherence to exercise during chemotherapy in patients with lower aerobic fitness may be caused by more comorbidities, toxicities, illness, or fatigue (67,69,70), as well as by limited exercise history (71) or low muscle strength (69). This may particularly be the case for unsupervised exercise, because our sensitivity analyses indicated that the moderator effect of baseline aerobic fitness was less pronounced for supervised exercise. A second possible explanation may be an inadequate exercise stimulus to improve aerobic fitness, either because exercise specialists may be too conservative when tailoring the exercise intervention to patients with low fitness during treatment, or because, related to variations in methods used to prescribe exercise intensity, patients may not be able to reach prescribed intensity targets (72,73). Future studies should clarify if and how patients with low aerobic fitness can adhere to and benefit from exercise interventions during cancer treatment. They should study how to better tailor exercise interventions during treatment to patients with low aerobic fitness, or whether it is better to offer these patients an aerobic exercise intervention after completion of cancer treatment, as this was shown to be effective for patients with various baseline fitness levels in the current meta-analysis. The discrepancy between findings for muscle strength and aerobic fitness may indicate that it is more feasible for patients with low muscle strength to perform resistance exercises during cancer treatment than for patients with low aerobic fitness to perform aerobic exercises.
In contrast to objective measures of physical fitness, greater exercise intervention effects were found for self-reported PF for patients with worse baseline values, regardless of intervention timing. Although physical fitness and PF are related, they are not the same constructs and may therefore produce different results (74). Our data suggest that exercise interventions may improve patient reports of PF during and post cancer treatment in patients with low PF, whereas the influence of the patient’s objectively assessed baseline muscle strength and aerobic fitness on the intervention effects on these outcomes differed across intervention timing. This nonlinear relationship between objective functional capacity (ie, physical fitness) and patient-reported performance (ie, physical function) indicates that improved capacity is not necessarily a prerequisite for improved patient-reported functioning (75) and that improving PF may also require behavioral changes, adaptations to the physical environment, or support from the social environment (76). Additionally, symptoms such as fatigue may also influence self-reported functioning, regardless of physical fitness (77).
Our finding that patients with worse baseline fatigue had greater fatigue reductions supports results of previous explorative studies in patients who completed cancer treatment (20,22) and in patients during androgen deprivation therapy (23). This finding highlights the importance of targeting subgroups of patients whose fatigue is 1 SD worse than the mean value, because they may benefit the most from exercise with respect to fatigue. Results showed that exercise will neither benefit PF of patients with high baseline values (>1 SD greater than mean) nor will it benefit fatigue in patients with low symptoms of fatigue (<1 SD less than mean). Obviously, post cancer treatment, there is no or little room for improvement in these symptoms if they are not present or only marginally present. Perhaps during treatment, patients with no or minimal symptoms (often post-surgery) are not prone to developing them, and therefore, no statistically significant preventive effects of exercise are found for these measures. The lack of appropriately targeted interventions in previous studies may have underestimated the effects of exercise, particularly on fatigue and PF, and post-treatment. Future studies should therefore consider targeting exercise interventions to specific subgroups of patients. More recent exercise studies have begun to target patients with symptoms such as arthralgia (78) and fatigue (79) and to tailor exercise prescriptions to key physiological characteristics, such as bone health and muscle strength (80).
Strengths of this IPD meta-analyses include the large sample size, allowing us to assess the moderator effects with interaction tests, using uniform analytic procedures across all RCTs, and to conduct subsequent stratified analyses. However, some caution is warranted in generalizing these results to all patients with cancer. The IPD study population may be somewhat biased toward patients with breast cancer and those who are more interested in exercise and may have fewer comorbidities (81), less fatigue (32,81,82) and distress (83), and higher QoL (82). Additionally, this paper focused exclusively on fatigue, physical fitness, QoL, and PF. Moderator effects of baseline values of other relevant outcomes, including depression, sleep, and menopausal symptoms, and long-term health outcomes (eg, cardiovascular risk, cancer recurrence, and survival) should be investigated in future studies. Finally, there was considerable heterogeneity in the content of the exercise interventions, the measures to assess the outcomes with potentially different psychometric properties and responsiveness, and the types of cancer treatments. Therefore, our findings on moderator effects of baseline values should be confirmed in large single studies with homogeneous patient populations, uniform treatment protocols, and validated outcome measures.
In conclusion, the effects of exercise interventions post cancer treatment on UBMS, LBMS, and QoL appear to be greater in patients with worse baseline values, whereas exercise interventions during cancer treatment are equally effective for these outcomes regardless of baseline values. This finding indicates that, when using exercise for rehabilitation after cancer treatments, it may be useful to target specific exercise interventions to patients with low muscle strength and poor QoL. Likewise, when aiming to benefit fatigue and PF during and post cancer treatment, exercise interventions should be targeted to patients with high levels of fatigue and low levels of PF, because they show the most benefits on these outcomes. Further research is necessary to identify how to improve aerobic fitness in patients with low aerobic fitness during cancer treatment. Although exercise is likely beneficial for most patients with cancer, exercise interventions targeted to specific subgroup of patients stand to have the greatest impact on patient outcomes and the highest cost-effectiveness.
Funding
This work was supported by the Alpe d’HuZes foundation/Dutch Cancer Society (VU 2011–5045) via the “Bas Mulder Award” granted to L. M. Buffart.
Notes
Affiliations of authors: Department of Epidemiology and Biostatistics, Amsterdam UMC, Vrije Universiteit Amsterdam, Amsterdam Public Health Research Institute, Amsterdam, the Netherlands (LMB, MGS); Department of Medical Oncology, Amsterdam UMC, Vrije Universiteit Amsterdam, Cancer Center Amsterdam, Amsterdam, the Netherlands (LMB); Julius Center for Health Sciences and Primary Care, University Medical Center Utrecht, University of Utrecht, Utrecht, the Netherlands (AMM, JKvV); Department of Public and Occupational Health, Amsterdam Public Health research institute, Amsterdam UMC, Vrije Universiteit Amsterdam, Amsterdam, the Netherlands (MJC, WvM); Exercise Medicine Research Institute, Edith Cowan University, Joondalup, WA, Australia (RUN, DAG, DRT); Division of Psychosocial Research and Epidemiology (NKA) and Center for Quality of life, Netherlands Cancer Institute (MMS, WHvH), Amsterdam, the Netherlands; Division of Cancer Control and Population Science, National Cancer Institute, Bethesda, MD (PBJ); Department of Clinical Psychology, VU University Amsterdam, Amsterdam, the Netherlands (IMVL); Department of Otolaryngology-Head and Neck Surgery, Amsterdam Public Health Research Institute and Cancer Center Amsterdam, Amsterdam University Medical Center, Amsterdam, the Netherlands (IMVL); Division of Physical Activity, Prevention and Cancer, German Cancer Research Center (DKFZ) and National Center for Tumor Diseases (NCT), Heidelberg, Germany (KS, MES); Yale School of Public Health, New Haven, CT (MLI); School of Public Health and Social Work, Institute of Health and Biomedical Innovation, Queensland University of Technology, Kelvin Grove, QLD, Australia (SH); The George Washington University School of Nursing, Washington, DC (KAG); European University and Research Institute, Madrid, Spain (AL); Fundación GIAFyS Cancer, Miranda de Ebro, Spain (FHR); Department of Epidemiology, Maastricht University, Maastricht, the Netherlands (IM); University Medical Centre Groningen, University of Groningen, Center for Rehabilitation, Groningen, the Netherlands (EvW); Department of Medical Psychology, Amsterdam UMC, University of Amsterdam, Amsterdam, the Netherlands (HK); Department of Health Psychology, University Medical Center Groningen, University of Groningen, Groningen, The Netherlands (MMG); Department of Health Sciences, Faculty of Science, Vrije Universiteit Amsterdam, Amsterdam Public Health Research Institute, Amsterdam, the Netherlands (MMG); Physical Activity for Health Research Center, University of Edinburgh, Edinburgh, UK (NM); School of Sports, Exercise and Health Sciences, University of Loughborough, Loughborough, UK (AJD); Robertson Centre for Biostatistics, Institute of Health and Wellbeing, University of Glasgow, Glasgow, UK (AM); Institute of Psychiatric and Psychosomatic Psychotherapy, Central Institute of Mental Health, Mannheim, Heidelberg University, Heidelberg, Germany (MB); Faculty of Health, University of Antwerp, Antwerp, Belgium (MB); National Advisory Unit on Late Effects after Cancer Treatment, Department of Oncology (LT) and Department of Clinical Service (LT), Oslo University Hospital, Oslo, Norway; Athleticum – Competence Center for Sports- and Exercise Medicine and Institute for Medical Psychology, University Medical Center Hamburg-Eppendorf, Hamburg, Germany (KlHS); Freemasons Foundation Centre of Men’s Health, School of Medicine, University of Adelaide, Adelaide, SA, Australia (CES); School of Medicine & Public Health (ELJ) and Priority Research Centre for Physical Activity and Nutrition (RCP), The University of Newcastle, Callaghan, NSW, Australia; Lane Fox Respiratory Research Unit, Guy’s and St Thomas’ NHS Foundation Trust, London, UK (GA); Department of Medical Oncology (KP, JmW) and Department of Radiation Oncology (KP), National Center for Tumor Diseases (NCT) and Heidelberg University Hospital, Heidelberg, Germany; Netherlands Cancer Institute/Antoni van Leeuwenhoek Hospital, Amsterdam, the Netherlands (MvB, HSO, GSS); University of Twente, Enschede, the Netherlands (WHvH); Department of Respiratory Medicine, Kings College London, London, UK (RG); Department of Public Health Science, College of Medicine and Cancer Institute, Pennsylvania State University, Hershey, PA (KHS, JmW); Knight Cancer Institute and School of Nursing, Oregon Health & Science University, Portland, OR (KMWS); Netherlands Comprehensive Cancer Organisation (IKNL), Utrecht, the Netherlands (MJV); Department of Hematology, Amsterdam UMC, University of Amsterdam, Amsterdam, the Netherlands (MJK); Department of Rehabilitation, Amsterdam UMC, University of Amsterdam, Amsterdam Movement Sciences Research Institute, Amsterdam, the Netherlands (FN); Johns Hopkins School of Nursing, Johns Hopkins School of Medicine, Sidney Kimmel Comprehensive Cancer Center, Baltimore, MD (JrW); Amsterdam School of Communication Research (ASCoR), University of Amsterdam, Amsterdam, the Netherlands (JB); Faculty of Kinesiology, Sport, and Recreation, University of Alberta, Edmonton, AB, Canada (KSC).
The authors have no conflicts of interest to disclose. The funders had no role in the design of the study; the collection, analysis, and interpretation of the data; the writing of the manuscript; and the decision to submit the manuscript for publication.
References
Author notes
Disclaimer: The content is solely the responsibility of the authors and does not necessarily represent the official views of the (U.S.) National Institutes of Health.

