


Abstract
Most sand flies and mosquitoes require a bloodmeal for egg production, but when blood-sources are scarce, some of them can reproduce without it, so called facultative autogeny. The evolution of autogenous reproduction is thought to involve a trade-off between the benefit of reproducing in the absence of bloodmeal hosts versus the quantitative cost of reduced fecundity and/or or qualitative effect on reduced offspring development and survivorship. We blood-fed (BF) some Phlebotomous papatasi (Scopoli) sand fly females on mice while keeping others (from the same cohort) not BF. We then compared the fecundity of BF and non-blood-fed (NBF) females and also evaluated their egg mass and hatching rate, larval development rate and survivorship, pupa mass and eclosion rates, and progeny fecundity. Among NBF females, only 55% became gravid and produced three times less mature oocytes than BF ones. Autogenous females laid 3.5 and 5.7 times fewer eggs in individual and multi-female bioassays, respectively. Egg mass and hatching rate were not affected by blood-feeding. Individual-larvae bioassays suggested reduced survival during larval stages in the autogenous group. In multi-larvae bioassays, overall and especially pupae survival was significantly reduced in the autogenous group. Development rate was slower and pupal mass was reduced in progeny from autogenous mothers. These effects were particularly apparent at high larval density. Mothers’ blood-feeding history did not affect daughter’s fecundity. Studies on the costs of autogeny provides insights on the evolution of blood feeding. Moreover, it also provides insights regarding potential implications of autogeny to the emergence of vector-borne diseases.
Blood-feeding arthropods evolved during the Mesozoic era with the rise of terrestrial vertebrates (Balashov 1984, Lehane 1991, Ribeiro 1995). Given that blood is a highly nutritious resource, blood-feeding evolved independently in several arthropod groups such as ticks, bugs, fleas, mosquitoes, and others (Balashov 1984, Lehane 1991, Ribeiro 1995, Lehane 2005). Blood-feeding arthropods could be classified into obligate blood-feeders that feed exclusively on blood as adults and (some) as immatures (e.g., ticks, lice, fleas, bed bugs, adult tsetse flies), reproductively obligate blood-feeders where females require bloodmeal for egg production (e.g., mosquitoes, sand flies, midges), and reproductively facultative blood-feeders that will blood-feed if a suitable vertebrate host is available but can otherwise develop and lay eggs without a bloodmeal (Spielman 1964, Balashov 1984, Lehane 1991). Reproductively obligate hematophagy is also termed ‘anautogeny’ whereas reproductively facultative hematophagy, where female can develop at least one egg without obtaining a bloodmeal, is termed ‘autogeny’ (Spielman 1957, O’Meara and Edman 1975, Lehane 2005). Autogeny could either be obligatory, with first batch of eggs always laid with no preceding bloodmeal, or facultative, with the size of the first egg batch depending on whether or not the female was able to find a bloodmeal (Lehane 2005).
Facultative autogeny has been observed in mosquitoes, sand flies, tabanids, flesh flies, and black flies, and it is thought as an adaptation for situations where or when bloodmeal sources are hard to come by (Corbet 1967, Rockel 1969, Baxter et al. 1973, O’Meara 1979, Takaoka and Noda 1979, Lounibos et al. 1982, Strickman et al. 2012). Using a mathematical modeling approach, Tsuji et al. (1990) showed that autogeny is evolutionarily advantageous when host searching time is high and the relative cost of autogeny (measured as the ratio of autogenous to anautogenous fecundity) is low. Indeed, with respect to the effect of host searching time, O’Meara and Edman (1975) showed that in a site devoid of deer 94% of Aedes taeniorhynchus females were autogenous whereas in a site with deer 74% were autogenous. Autogeny depends on the ability of the larval stage to accumulate a sufficient amount of nutrients because females use their body resources for egg production (Rockel 1969, Zakharkin et al. 2001, Lehane 2005). Hence, with respect to the relative cost of autogeny, Tsuji et al.’s (1990) model posited that high larval habitat quality should promote autogeny due to higher gravidity (percent females becoming gravid) and productivity (number of eggs developed/laid) of the emergent adult females. Indeed, it was shown that gravidity of autogenous Wyeomyia smithii and productivity of autogenous Culex tarsalis were higher when larvae were fed on high-quality diets (Spadoni et al. 1974, Lounibos et al. 1982). Furthermore, for the same reason of reducing the cost-ratio of autogeny to anautogeny, Tsuji et al.’s (1990) model posited that larval habitat quality should promote autogeny by enhancing survivorship and faster development rates of offspring of autogenous females. Other factors shown, empirically, to be associated with autogeny include higher rearing temperatures, adult sugar feeding (O’Meara and Petersen 1985, Ariani et al. 2015), and adult mating (O’Meara 1979, O’Meara and Petersen 1985). Autogeny was shown to also be genetically determined. Some quantitative trait loci affecting autogenetic capacity were described, but the specific genes responsible for this trait are still unknown (Spielman 1957, Ariani et al. 2015).
The topic of autogeny has not been well studied in sand flies, which are key vectors of Leishmaniases and other bacterial and viral pathogens worldwide (Ready 2013). Autogeny in sand flies was first reported by Dolmatova (1946), who found that Phlebotomus papatasi from eastern Georgia, possessed the autogenic trait, but that specimens of the same species from Tajikistan did not. Since then, autogeny was described in several species including Phlebotomus mascittii, Phlebotomus panamensis, Phlebotomus sanguinarius, Phlebotomus bergeroti, Phlebotomus gomezi, and Lutzomyia lichyi (Hertig et al. 1960, Johnson 1961, Ready et al. 1981, Montoya-Lerma 1992, Kassem et al. 2003). Different species and isolated populations of the same species may vary with respect to the existence of this trait or on its degree (Schmidt 1965, Hanafi et al. 1999). In Ph. bergeroti laboratory population, 86% females were autogenous (Kassem et al. 2003). In Ph. gomezi, some populations are only anautogenous and some were only facultatively autogenous (Johnson 1961). Furthermore, reciprocal crossing indicated that autogenous and anautogenous individuals could not interbreed, or at least do not produce fertile eggs (Johnson 1961, Chelbi and Zhioua 2007). Chelbi and Zhioua (2007) showed that flies of the Tunisian strain of Ph. papatasi were facultatively autogenous with gravidity rates depending on the availability of a bloodmeal source. They also reported that a reference colony of the Turkish strain of Ph. papatasi was only anautogenous. As expected, and as shown by other studies (Schmidt 1965, Benkova and Volf 2007), productivity of autogenous P. papatasi flies was significantly lower than that of the anautogenous flies (Chelbi and Zhioua 2007). However, interestingly, survivorship to adulthood of their offspring did not differ, suggesting that the cost of autogeny, in this case, was mostly ‘quantitative’ (in terms of overall fecundity) but not ‘qualitative’ (in terms of offspring growth rate and survivorship).
The evolution of autogeny as a reproductive life-history strategy is assumed to reflect a trade-off between the benefit of reproducing in the absence of bloodmeal hosts versus the quantitative or qualitative cost of reduced fecundity and/or offspring survivorship (Tsuji et al. 1990). As indicated above, high relative cost of autogeny should preclude the evolution of autogeny (Tsuji et al. 1990). For this reason, it is of great importance to characterize the relative cost of autogeny both in terms of its quantitative as well as its qualitative effects. In this study, we used Ph. papatasi as a model species to address this question. This species is the main vector of Leishmania major, which is the etiological agent of cutaneous Leishmaniasis in North Africa, Middle East, and central Asia (Killick-Kendrick 1999, Colacicco-Mayhugh et al. 2010, Ready 2013). With a series of oviposition and larval development bioassays, we evaluated the effect of autogeny by comparing fecundity, egg hatching, egg size, larval development rate and survivorship, pupa mass and eclosion rates, as well as fecundity of first-generation daughters of blood-fed (BF) and non-blood-fed (NBF) females.
Materials and Methods
Ethics Statement
As part of the sand fly colony maintenance, sand fly blood-feeding on ICR white mice was conducted at the SoBran research facility, Gateway University Research Park in North Carolina under SoBran Inc. Protocol number UNC-002-2016 dated 12/12/2018.
Phlebotomus papatasi Colony Maintenance and Experimental Conditions
In this study, we used our laboratory colony of Ph. papatasi sand flies that originated from Abkük, Turkey (April 2004). The colony was maintained as described in Lawyer et al. (2017) in incubators (Model: 6030–1, Caron, Marietta, Ohio) at 26°C, 85% RH, and 14:10 (L:D) reversed photoperiod. Larvae were reared in oviposition jars (500 ml Nalgene jars [Model 81063]), with a 2.2-cm layer of orthodontic plaster (Whip-Mix, [Model: 5577352], Henry Schein) on the bottom to ensure moist substrate and drainage. They were fed ad-libitum on standard larval food made of fermented mixture of rabbit dung and rabbit chow (at 1:1 ratio). Flies were BF at SoBran (Greensboro, NC) on live anesthetized ICR mice (Envigo). All experiments were performed in the same incubators and at the same settings.
Experimental approach
The basic experimental approach was to experimentally blood-feed half of a sand fly cohort on anesthetize mice and leave the other half unfed. This provided us with an experimental anautogenous and autogenous lines, respectively. With the first sand fly cohort, we tested the effect of blood-feeding on the percent of females becoming gravid (gravidity rate) and the number of mature oocytes produced (productivity). With the subsequent sand fly cohort, we conducted single-female oviposition bioassays where we compared oviposition rates of BF and NBF females. Subsequent two cohorts (cohorts 3 and 4) were used for multifemale oviposition bioassays where oviposition rates of 15 BF or NBF females was compared. Eggs laid by these females was used to assess differences in egg mass (cohort 4 only), and hatching rate (cohort 3 and 4) of eggs of BF and NBF females. Using neonates of cohort 3 females, we evaluated larval survival to adulthood using single-larva bioassays. We also conducted assessment of larval survival and development time to adulthood using multi-larvae bioassays using groups of neonates originated from eggs laid by cohort 5 females. Finally, assessment of intergenerational effect was done by assessing the effect of blood-feeding status of cohort 5 mothers on their adult daughter’s fecundity (see Supp Table 1 [online only]).
Establishment of the Autogenous and Anautogenous Sand Fly Groups
About 3- to 5-d-old adult flies of the same cohort were split into two groups, each within a separate adult holding cage. Females of one group were BF on anesthetize mice for 1 h (hereafter, BF group) and females of the other received sugar water (20% sucrose, presented in a soaked cotton pad placed on top of the cage’s mesh cover) (hereafter, NBF group). For most bioassays, except gravidity and fecundity testing, females of both groups were transferred the next day into separate oviposition jars. Both groups received a sugar-meal daily. Females were left in their dried-bottom jars (to arrest oviposition) for another 3 d to complete egg production (following Marayati et al. 2015). Females were then either dissected to assess their gravidity status and number of eggs produced or were left to oviposit in their respective jars (as described below). Larvae hatching from eggs of BF or NBF females were then monitored to evaluate their development and survivorship (as described below).
Assessment of Fecundity
Overall fecundity is a product of the fraction of females that become gravid (gravidity rate) and their productivity (number of eggs produced and laid). To estimate gravidity, 10 d following the blood-feeding date, we dissected 50 females from the BF and NBF groups. Dissections were done on a microscope slide with physiological saline by first severing the fly’s head, then nicking the fly’s abdomen at its sixth tergite and gently pulling the ovaries plus the gut away using an entomological needle (Lawyer et al. 2017). Entire ovaries were observed, and developmental stage of the eggs was determined (following, Magnarelli et al. 1984). Females were defined as gravid if their ovaries contained mature oocytes (Magnarelli et al. 1984). The number of such mature oocytes was then counted visually using a dissecting scope (Olympus SZ61). We quantified oviposition rates in two ways: individual oviposition assays and group oviposition assays. In the first, BF and NBF females (n = 35 females for each group) were introduced individually into 30-ml glass vials with a pair of moist filter papers on the bottom 1-wk post-blood-feeding (of the former). Females were then given up to seven days to oviposit, during which access to a sugar-meal was provided daily. By the end of the seventh day, filter papers were pulled out, photographed (T3i Canon with 100-mm macro lens) and eggs were counted from high quality digital photos using the counting tool in Adobe Photoshop (Adobe Photoshop CS5 2010, Adobe, San Jose, CA). In the group oviposition assays, we used 20 sand flies (15 females with 5 males) (n = 9 jars for each group). BF (2-d post-bloodmeal) and NBF (of same age) flies of the same cohort were introduced into small oviposition jars (125-ml clear Nalgene cups with moist plaster on a bottom and covered by fine mesh cloth). Females were given nine days to oviposit. The plaster base of the oviposition jar was then photographed, and number of eggs laid counted (as described above). These eggs were then used for quantifying egg mass and egg hatching rates.
Egg Mass
Eggs laid in the group oviposition bioassays (described above) were used here. Eggs from each oviposition jar (n = 9 oviposition jars for each blood-feeding group) were water-washed using a sonicating machine (Waterpik water flosser, #WP-100W, Water Pik, Inc, Canada) dried on a filter paper, and split into one to three subsamples. Subsamples (n = 21 for NBF and n = 26 for BF) were weighed with Mettler Toledo, XSE105 scale (at 0.01 mg accuracy) and then photographed to determine egg numbers. The mean egg mass was then determined by dividing subsample egg mass by the actual number of eggs in that subsample.
Egg Hatching Rate
A known number of eggs (53.81 ± 1.15, mean ± SE) from each oviposition jar (n = 8 for each blood-feeding group) were placed on 9-cm diameter Petri dishes with wet filter paper and photographed to obtain the actual number of eggs. Plates were sealed with parafilm, placed into the rearing chamber (under standard conditions), and were checked daily for hatching. Each neonate found was recorded and transferred into larval rearing jars to assess larval growth and survival.
Larval Growth and Survival
We evaluated growth and survival using single larva- and multi-larvae bioassays. In the single larva bioassay, we used small Petri dishes (3-cm diameter) with a moist filter paper as a substrate. A single first-instar neonate larva was gently transferred using a fine artistic brush from the Petri dish described above. Larvae were given fresh larval food ad-libitum and monitored daily, recording their survival and developmental stage (n = 53 larvae for each blood-feeding group). In the multi-larvae bioassays, 0.5 mg (mean ± SE of 178 ± 10 eggs) of eggs from oviposition jars of either BF (n = 8) or NBF (n = 7) females were placed into small larval rearing jars (125-ml clear Nalgene pots with moist plaster base). Number of eggs in each larval jar was enumerated as described above. Larvae were fed ad-libitum and monitored daily. Pupae mass was recorded upon pupation (at 0.01 mg accuracy) and sex were recorded upon eclosion.
Intergenerational Effect: Effect of Mother’s Blood-Feeding History on Progeny’s Fecundity
Newly eclosed adults from pupae of BF or NBF mothers were grouped into separate adult holding cages; sugar-meals were provided daily for both groups. After 7 d, females of each group were separated into two cages, with females of one cage BF on mice (as described above) and females of the other group were provided with sugar-meal only. Ten days later, female flies were dissected to assess gravidity and number of eggs produced. This procedure was repeated three times using early (first week), mid (second week), and late (third week) eclosing pupae. This design allowed us to evaluate if autogenous or anautogenous fecundity of daughters was affected by the blood-feeding status of their mothers. From NBF mothers, we dissected 47 and 55 NBF and BF daughters, respectively; from BF mothers, we dissected 120 and 135 NBF and BF daughters, respectively.
Statistical Analyses
To compare fraction gravid females between the BF and NBF, we used contingency tables. Number-of-eggs-developed by either mothers or daughter flies, number of eggs laid, mean egg mass, and development times were not normally distributed (evaluated using Shapiro–Wilk normality test) and therefore we tested for difference between NBF and BF using non-parametric two-sample Wilcoxon rank sum tests with continuity correction (R Core Team 2013). To compare proportion of larva surviving at different time points as well as hatching rate, we used weighted logistic regression with number of individuals within each sample group as the weighting factor (McCulagh and Nelder 1989). The effect of larvae/pupae density was tested using Kruskal–Wallis tests. Given that the effect of density on all development rates was significant (P < 0.01), we stratified our analyses of demographic parameters by pupae density using three density levels: low (53–62), medium (76–87), and high (99–101). The effect of sex was significant for all larvae development parameters (P < 0.05, Kruskal–Wallis tests), so we tested each sex separately. Pupal mass was normally distributed with non-heteroscedastic variance and therefore tested using parametric analysis of variance (ANOVA) tests. All statistical analyses were performed with R i386 3.5.1. software with R Commander and Dunn Test packages (Development Core Team 2008).
Results
Fecundity
Gravidity and Egg Production.
Significant difference in gravidity rate was found between BF and NBF females (Fig. 1A). From 50 BF females dissected, 98% were found to be gravid with mature (stage V) oocytes (Magnarelli et al. 1984). Of these, 82% produced ≥20 mature oocytes (Fig. 1A). In contrast, among the 50 NBF females, only 54% became gravid, with the majority of these (67%) producing 4 to 20 mature oocytes (Pearson’s chi-squared: χ 2 =17.729, df =1, n = 76, P < 0.0001; Fig. 1A). Specifically, gravid NBF females produced almost three times fewer mature oocytes compared with BF females (Fig. 1B). Moreover, if counting all females dissected (including females that did not become gravid), NBF females produced on average 5.2 times fewer eggs than BF females (mean ± SE: 8.84 ± 1.3 vs 46.0 ± 3.5, respectively).
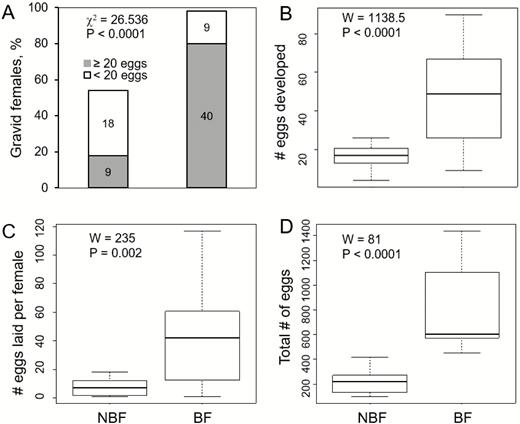
The effect of blood feeding status (NBF, BF) on Phlebotomus papatasi females’ fecundity. Panel A depicts gravidity rate (white and grey segments of stacked bar represent percentage of females producing less or equal-to/more than 20 mature oocytes and numbers within the bars indicate actual number of females in each category). Panel B depicts number (median ± quartiles) of mature oocytes developed by gravid females (those depicted in panel A) of each blood-feeding category. Panel C depicts number (median ±quartiles) of eggs laid in single-female oviposition bioassays (out of 35 females for each group, NBF: n = 12 and BF: n = 24 females that laid eggs). Panel D depicts total number (median ±quartiles) of eggs laid in multi-females (n = 9 ovipots, 15 females per pot) oviposition bioassays. Data depicted in panels C and D are based on different set of bioassays than those used to produce panels A and B. Statistical significance of the effect of blood-feeding was tested using Pearson χ 2-test (A) and two-sample Wilcoxon rank sum tests (using the W statistic) (B–D). .
Oviposition Rate.
In the single-female oviposition bioassays, only 12 out of 35 NBF females laid eggs (34%) compared with 25 out of 35 (71%) BF females (Pearson’s chi-squared: χ 2 = 3.0329, df = 1, P = 0.082). In terms of actual oviposition, NBF females laid about 5.7 times fewer eggs than BF females (Fig. 1C). In multi-female oviposition bioassay, total number of eggs laid by NBF females was about 3.5 times less eggs than BF females (Fig. 1D). Per-capita oviposition rates in multi-female bioassays tended to be higher than those observed in the single-female bioassays for both NBF (15.1 ± 9.3 vs 7.6 ± 1.2, respectively) or BF females (53.2 ± 7.9 vs 40.1 ± 6.3).
Egg Mass and Hatching Rate
Egg Mass.
Mean egg mass was obtained by calculating the quotient of egg group mass by the count of eggs for that group. In total, 1,172 and 1,917 eggs were used for NBF and BF females, respectively. No significant difference in mean egg mass was found between eggs laid by NBF (0.0289 ± 0.0024 µg, n = 21) or BF (0.0306 ± 0.0014 µg, n = 26) females (two-sample Wilcoxon rank sum: W = 333.5, P = 0.199).
Hatching Rate.
We did not find a significant difference in hatching rate for eggs laid by NBF (72.77 ± 2.75%, n = 8) and BF (76.21 ± 2.38%, n = 8) groups (two-sample Wilcoxon rank sum: W = 44, P = 0.226).
Larval Survival and Growth
Larval Survival.
Based on single-larva bioassays, stage-specific survivorship did not differ significantly between larvae of NBF or BF females for either developmental stage (Fig. 2A). Yet, a marginally significant effect was found for two to four instar larvae with survival of larvae of BF mothers tending to be slightly higher than that of NBF mothers (Fig. 2A). Comparing among developmental stages for larvae of BF females, we found that first-instar larvae had the lowest survival rate (Fig. 2A). For larvae of NBF females, first-instar survival rate was significantly lower than pupal survival. Overall, first-instar-to-adult survival rate were not significantly different between progeny of NBF and BF females (Fig. 2A). In the multi-larvae bioassays, developmental stage categories were coarser: egg-to-pupa, pupa-to-eclosion, and cumulative egg-to-adult survivorship. Larval stage survivorship was 45.5 and 43.9% and did not differ significantly (GLM: Z = −0.684, P = 0.494) among larvae of BF or NBF females, respectively (Fig. 2B). However, a significant difference (GLM: Z = −3.839, P = 0.0001) was found for pupal-stage survival, with pupae of NBF females having significantly lower survival than pupae of BF females (68 and 78%, respectively; Fig. 2B). Cumulative egg-to-adult survivorship was higher for offspring of BF females (GLM: Z = −2.913, P = 0.004), obviously, due to the unequal pupal-stage survival (Fig. 2B).
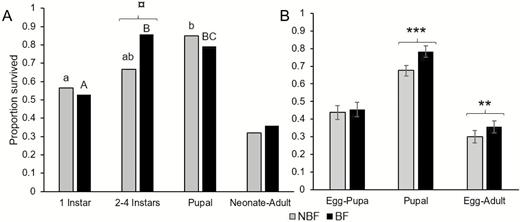
The effect of mother sand fly blood-feeding status on juvenile offspring survival. Panel A depicts stage-specific and cumulative immature-stage survival based on single larva bioassays (initial n = 53 larvae per each blood-feeding category, final BF: n = 19, NBF: n = 17). Different letters indicate significant differences among developmental stage classes (lower case for offspring of NBF and upper-case for offspring of BF females). Panel B depicts mean (±SE) survival of egg-to-pupa, pupa-to-adult, and cumulative egg-to-adult survival based on multi-larvae bioassays using n = 7 and n = 8 larval rearing jars for offspring of NBF and BF females, respectively. Symbols indicate level of statistical significance of the effect of mother’s blood-feeding status based on logistic regression analysis: ***: P ≤ 0.001, **: P ≤ 0.05, ‘¤’: 0.05 < P ≤ 0.1
Adult Offspring Sex Ratio.
In the multi-larvae bioassays, a marginally significant difference in sex ratio of offspring of BF and NBF females was found with 43.9% adult females (n = 335) in the NBF group and 50% adult females (n = 613) in the BF group (Pearson’s chi-squared: χ 2 = 3.3377, df = 1, P = 0.068).
Larval Developmental Rate.
Due to a low sample size (NBF: 10 females, 7 males; BF: 3 females, 16 males), we could not conduct this analysis for the single-larva bioassays and results presented here are based on the multi-larva bioassays only (NBF: 147 females, 185 males; BF: 253 females, 247 males). We evaluated the effect of mother’s BF history on larval developmental time from larva to pupation. We conducted this analysis for each sex separately and stratified it into three tiers of pupae density. For female larvae in general, time-to-pupation was significantly affected by mother’s blood-feeding history (two-sample Wilcoxon: W = 16,352, P = 0.043) with median of 30 d for larvae of NBF females compared with median of 29 d for larvae of BF females. This effect was significant at the low- (2.2 d, mean difference) and high (5.2 d, mean difference) density tiers but not at the medium density tier (1.3 d, mean difference; Fig. 3A). Pupal density level had a significant effect on time-to-pupation for larvae of both BF (Kruskal–Wallis chi-squared: χ 2 = 76.7057, df =2, P < 0.001) and NBF females (χ 2 = 26.9889, df = 2, P < 0.001). For both BF groups, time-to-pupation increased significantly between low and medium density level but decreased significantly between medium to high density levels only for larvae of BF females while staying about the same for larvae of NBF females (Fig. 3A). With males, the effect of mother’s blood-feeding history on time to pupation was not significant (two-sample Wilcoxon: W = 22,962, P = 0.928), with a median of 28 d for larvae of both NBF and BF mothers. However, within each density tier, development time was longer for male larvae of NBF females at low and high densities tiers but not in medium densities (Fig. 3B). Furthermore, similar with females, there was a significant effect of larval density level on time-to-pupation for male larvae of either BF (Kruskal–Wallis: χ 2 = 66.127, df = 2, P < 0.0001) or NBF group (Kruskal–Wallis: χ 2 =22.475, df = 2, P < 0.001). For both groups, time-to-pupation increased significantly going from low-to-medium density level but, similar to females, decreased significantly going from medium-to-high only for male offspring of BF mothers (Fig. 3B). Time-to-pupation was shorter for males (29.63 ± 0.22, mean ± SE) than that of females (30.40 ± 0.24) (two-sample Wilcoxon: W = 94,854, P = 0.014).
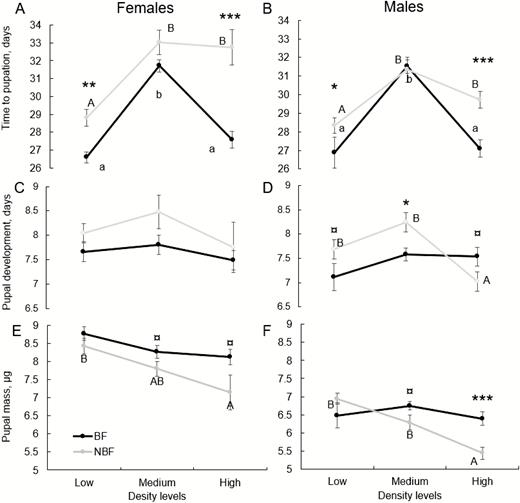
The effect of mother sand fly blood-feeding status (BF or NBF) on larval (A and B) and pupal (C and D) development rates and pupal mass (E and F) at low, medium, and high larval densities. Left and right columns depict effects on females and male juveniles, respectively. ‘Time to pupation’ refers to mean time (±SE) from first instar to pupation (A and B) and ‘pupal development’ refers to mean time (±SE) from pupation to eclosion (C and D). Different letters indicate significant differences (P < 0.05) among density classes based on Kruskal–Wallis tests (lower case for offspring of BF and upper-case for offspring of NBF females). Symbols indicate level of statistical significance of the effect of mother’s blood-feeding status based on two-sample Wilcoxon tests (A and D) and one-way ANOVA (E and F): ***P < 0.001, **P < 0.01, ‘¤’0.05 < P < 0.1.
Pupal Developmental Rate.
This analysis was based on the multi-larva bioassays only. Mother’s blood-feeding history had no significant effect on pupae’s time-to-eclosion for neither female (two-sample Wilcoxon: W = 17,376, P = 0.263) or male larvae (two-sample Wilcoxon: W = 21,484, P = 0.322). However, the trend was for a longer development time for pupa of NBF females (Fig. 3A). For female larvae, density level had a significant effect (Kruskal–Wallis: χ 2 = 6.502, df = 2, P = 0.039) with shortest mean pupal development time occurring at high density. However, for each blood-feeding group separately, density level did not have significant effect (Kruskal–Wallis BF: χ 2 = 3.0083, P = 0.22; NBF: χ 2 = 3.4392, P = 0.18). For male pupae, density level had a significant effect for only pupae of NBF mothers with shortest developmental time at high density (Fig. 3C). Furthermore, the effect of mothers’ blood-feeding status appeared to vary according to initial larval density: at low and medium density levels pupal developmental time tended to be longer for pupae of NBF mothers but at high density the trends reversed with pupal developmental time of NBF mothers tending to be shorter than that of BF mothers (Fig. 3D). Larval sex had a small yet significant effect with longer development time for female (7.86 ± 0.09 d) than for male (7.59 ± 0.08 d) pupae (two-sample Wilcoxon: W = 93,104, P = 0.041).
Total Development Time.
This analysis was based on the multi-larva bioassays only. Overall development time from egg to adult did not differ significantly between offspring of NBF and BF females (two-sample Wilcoxon test. females: W = 17,660, P = 0.115; males: W = 24,487, P = 0.785). Development time from egg to adult differed significantly by sex (two-sample Wilcoxon: W = 102,190, P = 0.004) with longer developmental time for females (38.60 ± 0.27 d) compared with males (37.64 ± 0.25 d). For both sexes, total development was longer at medium density than at low or high densities (Kruskal–Wallis chi-squared, females: χ 2 = −6.659597 or −7.298178, P < 0.001; males χ 2 = −6.903138 or −8.381176, P < 0.001).
Pupal Mass.
We found a significant effect of mother’s blood-feeding status, sex, larval density level, as well as a significant interaction of ‘blood-feeding-status’-by-‘density-level’ (Table 1). Female pupae, as expected, were larger than male pupae (8.241 ± 9.6 and 6.564 ± 7.9 µg, respectively). Mass of pupal offspring of NBF mothers was, on average, lower than that of BF mothers (Fig. 3E and F). This effect was, overall, consistent for females (ANOVA: F = 5.9851, P = 0.016) and males (ANOVA: F = 4.1055, P = 0.044). Pupal mass tended to decrease with density (Fig. 3E and F). However, as indicated by the significant ‘blood-feeding by density’ interaction (Table 1), the effect of mothers’ blood-feeding status tended to increase with density level (Fig. 3E and F). Furthermore, for both female and male pupae of BF mothers, density did not have a significant effect on pupal mass. However, for female and male pupae of NBF mothers, density did have a significant negative effect (females: F = 4.345, P = 0.019; males: F = 14.34, P < 0.0001; Fig. 3E and F).
Analysis of variance table for the effects of sex, mothers’ blood-feeding status, larval density level, and their respective interactions on Phlebotomus papatasi pupal mass
| Sum squares | df | F | P | |
|---|---|---|---|---|
| Sex | 19,080.3 | 1 | 189.5293 | < 0.001 |
| Blood-feeding | 996.8 | 1 | 9.9018 | 0.002 |
| Density | 3273.2 | 2 | 16.2567 | < 0.001 |
| Blood-feeding × Density | 991.3 | 2 | 4.9233 | 0.008 |
| Blood-feeding × Sex | 123.5 | 1 | 1.2264 | 0.269 |
| Sex × Density | 126.7 | 2 | 0.6293 | 0.534 |
| Blood-feeding × Sex × Density | 194.7 | 2 | 0.9671 | 0.381 |
| Residuals | 29,094.3 | 289 |
Note: Significant variables are in bold.
Intergenerational Effect
Gravidity and egg production rates did not differ between daughters of BF and NBF mothers irrespective of current blood-feeding status of the daughters (Fig. 4A and B). NBF daughters of NBF or BF mothers did not differ in their gravidity rate (38.3 and 36.7%, respectively; Kruskal–Wallis with pairwise Bonferroni: χ 2 = 0.200393, P = 1.0) and fecundity (5.4 and 6.2 mean eggs per female, respectively; Kruskal–Wallis with pairwise Bonferroni tests: χ 2 = −0.087806, P = 1.0; Fig. 4A and B). Similarly, BF daughters of NBF or BF mothers did not differ in their gravidity (87.3 and 94.1%, respectively; Kruskal–Wallis with pairwise Bonferroni tests: χ 2 = −0.898795, P = 1.0) and fecundity (55.7 and 53.1 mean eggs per female, respectively; Kruskal–Wallis with pairwise Bonferroni: χ 2 = 0.35844, P = 1.0; Fig. 4A and B). As expected, there was a clear and highly significant effect of current blood feeding status on gravidity rate and eggs production of daughters of NBF or BF mothers (two-sample Wilcoxon: W = 24,588 and W = 29,844, respectively, P < 0.0001). Thus, we found no evidence for an effect of mother’s blood-feeding status on daughters’ autogenous or anautogenous fecundity.
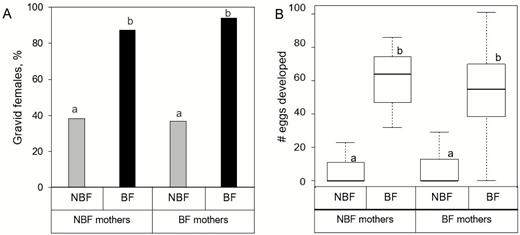
Intergenerational effect of mother’s blood-feeding status on daughter’s fecundity. Panel A depicts the effect of mother’s blood-feeding status on mean gravidity rate (±SE) of BF and NBF daughters. Panel B depicts the effect of mother’s blood-feeding status on number (median ± quartiles) of mature oocytes developed by BF (n = 135) and NBF (n = 120) daughters from the BF mothers and from BF (n = 55) and NBF (n = 47) daughters of NBF mothers. Different letters indicate statistically significant effects (P < 0.0001) based on Kruskal–Wallis tests with Bonferroni corrections.
Discussion
Our goal in this study was to evaluate the relative cost of autogeny in Ph. papatasi females. We evaluated both the ‘quantitative’ cost, in terms of reduced fecundity, as well as the ‘qualitative’ cost, in terms of reduced offspring fitness as measured in terms of egg mass and hatching rate, juvenile stage survival and developmental rates, and daughter’s fecundity. Most of the experiments done in this study were based, due to practical reasons, on a single cohort of flies (but with a statistically powerful sample size of our experimental units which were either individuals or groups of flies). Obviously, we implicitly assume that the cohorts used were representative of the entire laboratory population (given the constant sand fly rearing protocol we have no reason to assume otherwise). As expected, fecundity of NBF females was substantially lower compared with BF females. With the exception of a single female, all BF females became gravid. In comparison, only about half of NBF females became gravid. This is lower than a previous observation in which we observed 74% autogeny in our laboratory colony (Shymanovich et al. 2019). For Ph. papatasi previous studies reported autogeny rate ranging from 7.7 to 90.7% (Benkova and Volf 2007, Chelbi and Zhioua 2007). We also found that anautogenous females produced almost three times more eggs than autogenous females and when including those NBF that did not become gravid, egg production of BF females was 5.2 times higher than that of NBF females. Consistent with that, egg deposition of BF females ranged 3.5–5.7 times higher than that of NBF females (multi–single fly bioassays, respectively). Interestingly, per-capita oviposition rates in multi-female bioassays tended to be higher than that of single-female bioassays, which is consistent with the previously observed attraction of gravid females and stimulation of oviposition by conspecific eggs (Elnaiem and Ward 1991, Srinivasan et al. 1995, Basimike 1997, Wasserberg and Rowton 2011, Kowacich 2018).
In term of its ‘qualitative’ effect, blood-feeding status did not affect egg mass or egg hatching rate. However, it did have an effect on juvenile stage survivorship, development rate, and pupal mass. Single-larva bioassays suggested reduced second- to fourth-instar larval survivorship for offspring of NBF females. Multi-larvae bioassays indicated a significant reduction in pupal survival of NBF offspring. Developmental rate was consistently longer for female and male larvae of NBF females and pupal development rate had a similar, albeit nonsignificant, trend. In terms of pupal mass, female and male pupae of BF mothers were significantly larger than those of NBF females. Furthermore, juvenile stage offspring of BF and NBF females responded differentially with respect to the effect of conspecific density. For example, pupal survival in single-larva bioassays did not differ between offspring of BF and NBF females but it did differ in multi-larvae bioassays. Larval development time of both BF and NBF females was affected by conspecific density but not in a similar way. For larvae of BF and NBF females, development time of both sexes increased when going from low to medium densities, which is an expected response consistent with intraspecific competition and shown also in mosquito studies (Agnew et al. 2000). However, surprisingly, when going from medium- to high-density developmental time of larvae of BF mothers dropped back close to what it was when in low densities, whereas development time of larvae of NBF mothers remained high. This response was consistent for both sexes. With pupal developmental time, there was no density-dependent effect on offspring of BF females, but with male pupae of NBF females development time dropped significantly at high densities. This decrease in development time at high densities is counterintuitive, but it has been shown in some other systems. For example, Sarcophagaa bullata (Diptera: Sarcophagidae) study recorded that larvae reared at high densities pupated faster than those reared at low densities (Baxter et al. 1973). Larval development duration declined with intense competition for food in Hemipyrellia lidurriens (Diptera: Calliphoridae) (So and Dudgeon 1989). It was also shown for two fly species, Chrysomya megacephala and Chrysomya rufifacies, that when rearing density increased, larvae pupated faster and developed smaller adults (Shiao and Yeh 2008). It might be that competition does not stimulate pupation in larvae from NBF mothers as they miss some key nutrients and need more time to obtain them from larval food.
With pupal mass, we also observed a differential density-dependent response: pupae of BF females exhibited no effect, while pupae of NBF females exhibited an adverse density-dependent effect with pupal mass decreasing with density. This pattern was consistent for both female and male pupa, with females typically larger than males. This result suggests a potential maternal effect of blood-feeding history on the ability of their offspring to contend with intraspecific competition.
With respect to the effect of juvenile stage sex, it appears that female offspring were more affected by blood-feeding history of their mothers than male offspring as reflected by larger differences in larval development time and pupal mass. This makes sense in the context of females typically being larger than males, with female body size strongly correlated with its fitness (Honěk 1993, Stillwell et al. 2010). Specifically, smaller female mass tends to be associated with lower fat reserves resulting in reduced fecundity and reduced potential for autogenous reproduction (Rockel 1969, Baxter et al. 1973, Moon 1980). It might be that mass differences between sexes translates into a longer development for about 1 d for female than male larvae. It was shown for autogenous Aedes atropalpus mosquitos that female larvae and pupae differ from male by hexameric storage protein synthesis, and this trait might be conserved for sand flies as well (Zakharkin et al. 2001). The cumulative outcome of these female-biased costs might be reflected by the marginally significant difference in sex ratio of eclosed adults we observed: females constituted 44% of all adult offspring of NBF females whereas among offspring of BF females sex ratio was 50:50. Similar sex-specific competitive effects were shown with Culex pipiens mosquitoes (Agnew et al. 2000).
In terms of inter-generational effect, we posited that if blood-feeding status of mothers has a biologically meaningful impact on offspring’s ‘quality’, then adult female daughters of BF mothers will be more fecund; in particularly autogenous daughters. This expectation was not met. NBF daughters of autogenous mothers produced a similar mean number of eggs as that of NBF daughters of anautogenous mothers. Similarly, BF daughters of autogenous mothers produced a similar mean number of eggs as that of BF daughters of anautogenous mothers. In both cases, BF daughters produced significantly more eggs than NBF daughters. Due to the need to pool eclosed daughters of BF and NBF mothers for blood-feeding, we could not evaluate if there was any modifying effect of the level of larval density in which they grew. Indeed, it would be reasonable to speculate that daughters of autogeneous mothers growing in high larval density might exhibit dampened autogenous fecundity due to reduced fat storage compared with larvae growing at low density. This, indeed, would be a useful follow-up study. To the best of our understanding, this issue of inter-generational effect of blood-feeding has not been, previously, studied in any disease vector system. The effect of parental rearing conditions on offspring life traits was tested in Anopheles stephensi mosquitoes (Grech et al. 2007). In that study, parent rearing conditions did not affect offspring larval development. Surprisingly, daughters of parents reared at low-food conditions produced larger egg clutches than daughters of parents reared at high-food conditions. Furthermore, adult daughters of mothers reared at low-food conditions tended to take larger bool-meals than daughters of mothers reared under good conditions.
Overall, results of our study are consistent with previous studies showing a substantially reduced fecundity of autogenous females compared with anautogenous females (Lehane 2005). However, in contrast to our study, most previous studies only evaluated the impact of autogeny in term of fecundity (quantitative effect) but not in terms of its effect on offspring fitness (qualitative effects). In the only study that did evaluate this effect, Chelbi and Zhioua (2007) did not find difference in survivorship-to-adulthood for offspring of autogenous and anautogenous mothers. Results of our study indicate that in the system we studied, autogeny has a substantial quantitative cost in terms of reduced fecundity but also a meaningful qualitative effect in terms of reduced larval development rate, size, and survival but not on offspring fecundity. In other words, autogenous reproduction appears, in this system, to have a substantial overall fitness cost. Nonetheless, this strain of Ph. papatasi retains a great degree of phenotypic plasticity in terms of its facultative autogeny. This outcome is inconsistent with the predictions of Tsuji et al. (1990) who posited that when the cost of autogeny is high, natural selection should drive the evolution of that population toward anautogeny. Indeed, in sand flies, there appears to be a large degree of variation with some species being entirely anautogeneous and others facultatively autogenous (Schmidt 1965, Benkova and Volf 2007, Chelbi and Zhioua 2007). Furthermore, even within the same species, some geographical populations are strictly anautogenous, whereas others are facultatively autogenous. Obligatory anautogeny was described for a Turkish population of Ph. papatasi (Chelbi and Zhioua 2007). In contrast, facultative autogeny was described in some populations of Ph. papatasi by Dolmatova (1946), Chelbi and Zhioua (2007), Benkova and Volf (2007) and in Lu. gomezi by Johnson (1961), in Lu. lichyi by Montoya-Lerma (1992). Interestingly Johnson’s (1961) study on Lu. gomezi and Chelbi and Zhioua’s (2007) study on Ph. papatasi described that some autogenic and anautogenic populations crosses are not fertile suggesting their physiological or genetic incompatibility. Similarly, Spielman (1964) study on Cx. pipiens mosquitoes suggested that reproductive isolation of autogenous and anautogenous populations may be also due to differences in mating behavior.
The evolution of autogeny as a reproductive life-history strategy is assumed to reflect a trade-off between the benefit of reproducing in the absence of bloodmeal hosts versus the quantitative or qualitative cost of reduced fecundity and/or offspring fitness (Tsuji et al. 1990). As posited in Tsuji et al.’s (1990) model, autogeny could remain advantageous despite high cost if host search time is large and survival during blood-feeding is low. Indeed, in many arid regions, host availability is highly temporally and spatially variable. Under such circumstances, it would be evolutionary advantageous to maintain the high degree of phenotypic plasticity offered by facultative autogeny despite its high fitness cost. Unfortunately, most of studies to date on sand fly systems have not evaluated their study systems within this conceptual framework. This should be a useful avenue for further exploration.
Understanding the relative fitness cost of autogeny may also have implications with respect to the emergence of Leishmaniasis and other sand fly borne pathogens. For example, it was suggested that the availability of reservoir hosts, mainly gerbilline rodents which provide shelter, breeding sites, and bloodmeal for Ph. papatasi sand flies, is a major factor limiting sand flies’ population size (Ashford 1996, Wasserberg et al. 2003, Berger et al. 2014). The results of our study, however, introduce a novel dimension to this effect. Our results suggest that a natural or human-induced increase in population size of any suitable bloodmeal host could lead to an increase in the fraction of BF, anautogenous, female sand flies. Based on our results, this could lead to an increase in sand fly fecundity and larval survival as well as shorter generation time, which together could cause a spike in sand fly population size potentially leading to a major Leishmaniasis outbreaks. For example, Schlein et al. (1982) reported that in an agricultural settlement in the Jordan Valley catches of Ph. papatasi were seven times higher near turkey sheds than in nearby colonies of Psammomys obesus, their natural shelter host. Furthermore, this effect might explain the recent outbreaks of cutaneous Leishmaniasis in novel foci in Israel associated with an outbreak of Levant Voles (Faiman et al. 2013) and of Tristram’s jird (Ben-Shimol et al. 2015).
In summary, this study has highlighted the importance of studying cost of autogeny as it provides important insights with respect to the evolution of this important life-history strategy. In addition, it might have previously unrecognized public health implications as a novel mechanism for zoonotic vector-borne disease emergence and resurgence.
Acknowledgments
We thank Charles Apperson for reviewing an earlier draft of this paper. We thank UNC-Greensboro’s Office of Undergraduate Research for awarding NH with their Undergraduate Research and Creativity Award. We thank members GW’s lab for their assistance with the sand fly colony maintenance. This work was partially supported by the NIH: National Institute of Allergy and Infectious Diseases [grant R01AI123327-01 to G. W.].
