


Abstract
The population of Aedes albopictus (Skuse) (Diptera: Culicidae) was measured in four towns in northern Italy by means of Stegomyia indices (house index: percentage of houses with at least one active breeding site; container index: percentage of containers with larvae; and Breteau index: number of active breeding sites per premises), pupae per premises index (PPI), pupae per hectare index (PHI), and ovitrap monitoring. A detailed investigation on types and number of productive or potential larval habitats in the inspected premises was performed. Catch basins were the most productive breeding sites in both private and public areas. The influence of the premises maintenance and premises shading indices (PMI and PSI) on the population indices and the correlations between the latter and egg density were assessed. The highest PPI was found in badly maintained premises, most times combined with shady coverage. Stegomyia indices and PPI were well correlated with each other, but not with the PHI, which also included the pupae collected in public areas. We obtained a highly positive correlation (R = 0.86) between the PHI and weekly mean egg density estimated 7–14 d after inspection of the premises. The number of females per hectare, calculated using the Focks model, was correlated with the mean egg density of the week after sampling (R = 0.79), and we propose that ovitrap monitoring can be used to evaluate the efficiency of the control activities or to determine a mean egg density threshold for epidemic risk evaluation.
Aedes albopictus (Skuse) (Diptera: Culicidae) was accidentally introduced into Italy at the end of the 1980s (Sabatini et al. 1990) with the trade of used tires, probably coming from the United States (Dalla Pozza and Majori 1992, Urbanelli et al. 1999). The species is now widespread over the peninsula (Romi et al. 1999) and well established in several other European countries, including Albania (Adhami and Murati 1987); Serbia and Montenegro (Petric et al. 2001); Switzerland (Flacio et al. 2004); Belgium (Schaffner et al. 2004); Greece (Samanidou et al. 2005); Spain (Aranda et al. 2006); Croatia (Klobucar et al. 2006); and Slovenia, Bosnia-Herzegovina, and France (Scholte and Schaffner 2007).
In the Emilia-Romagna region, after first being detected in the town of Bologna in 1994 (our unpublished data), the species rapidly spread and colonized the entire regional territory, reaching 600 m in elevation (Albieri et al. 2010). In summer 2007, an epidemic of Chikungunya (CHIKV) occurred in the villages of Castiglione di Cervia and Castiglione di Ravenna, involving ≈250 cases, with secondary outbreaks in other Emilia-Romagna urban areas (Rezza et al. 2007, Bonilauri et al. 2008). The main objective was then to develop a control strategy to contain the vector below the critical population density threshold to prevent new epidemic events, considering both CHIKV and dengue fever.
The indices traditionally used to evaluate Stegomyia population densities and the efficiency of control campaigns, such as the house index (HI: percentage of houses with at least one active breeding site), container index (CI: percentage of containers with larvae), and Breteau index (BI: number of active breeding sites per 100 premises), are widely used as empirical standard parameters in developing countries (WHO 1972). Most previous studies based on these indices concerned Aedes aegypti (L.), and they are often of little usefulness in European urban areas because of the different socioeconomic and environmental conditions. In addition, the indices have disadvantages when adopted in epidemiological studies, due to the lack of information on the real productivity of containers and their relative contribution to the adult population size. As a new tool, Tun-Lin et al. (1995a,b) proposed the adult productivity index (API), which is based on the sum of positive containers of different typology considering their specific relative density. The pupal demographic survey (PDS) seems to be the most appropriate index for epidemiological studies, because it exploits the strong correlation between the number of pupae and the number of adults in a definite area (Focks and Chadee 1997; Focks et al. 2000; Focks and Alexander 2006; Chadee et al. 2007a,b).
The cities of northern and central Italy are characterized by high urbanization with limited well-maintained green areas. The most diffused potential larval habitat, both in public and private properties, is catch basins for the drainage of rainwater (Fig. 1), which is part of a sewer system in which grids and a siphon prevent large objects and debris from falling into the sewer system; water from the top of the catch basin drains into the sewer proper. Their side measurements vary from 20 to 30 cm for catch basins placed in private properties and from 40 to 60 cm for those in public areas.
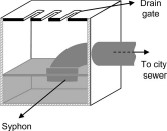
Section of a typical catch basin in Italy. Most have side dimensions of ≈40 by 40 cm.
The most frequent containers' inhabiting mosquitoes are Ae. albopictus and Culex pipiens L. Culiseta annulata Schrank, Culex hortensis Ficalbi, Anoheles maculipennis Meigen, and Anopheles plumbeus Stephens also have been described (Carrieri et al. 2003). In the town of Bologna in 2010, Cx. impudicus Ficalbi and Orthopodomyia pulcripalpis Rondani were caught with BG-Sentinel traps (M.C., unpublished data). Ae. aegypti disappeared from southern Europe after the Second World War and was last recorded in Italy in Desenzano del Garda (Brescia province, northern Italy) in 1971 (Fontenille et al. 2007).
In this study, we examined the main characteristics of the urban areas where the CHIKV epidemic occurred in 2007 to highlight which control and monitoring strategies can be adopted to reduce the density of the vector and avoid new outbreaks. Toward this aim, vector surveillance is a crucial point, but because the virus is not endemic to Italy the surveillance systems must have sustainable costs. Measuring Ae. albopictus populations using a network of ovitraps is inexpensive, simple to execute, and commonly used in Italy in integrated control campaigns (Hawley 1988, Bellini et al. 1996, Carrieri et al. 2011). In a recent study conducted in Italy over an urban area measuring 1 km2, a significant correlation between the CI and mean number of eggs per ovitrap was found (Carrieri et al. 2008). The current study was designed to evaluate the reliability of some larval population estimation indices in the environmental and socioeconomic conditions of northern and central Italy and to investigate their relationships with egg density data obtained by means of an ovitrap network.
Materials and Methods
Study Period.
In northern Italy, the Ae. albopictus development season spans from April to October, overwintering occurs by means of eggs only, and no adult activity has ever been observed during the winter. Therefore, three sampling sessions were performed to follow the expected increasing trend of population density: 1) June (weeks 24–26); 2) July (weeks 29–30); and 3) August (weeks 34–35), during which both private properties and public areas were inspected.
Study Area.
The study was conducted during the 2008 season in three towns where the CHIKV epidemic occurred in 2007: Ravenna (urban area, 13 km2; population, 5,704 people per km2), Cesena (urban area, 20 km2; population, 3,752 people per km2), and Rimini (urban area, 27 km2; population, 8,679 people per km2 in winter and 9,592 people per km2 in the tourist season). The study also was extended to the town of Forlì (urban area, 21.5 km2; population, 4,252 people per km2), where CHIKV cases did not occur (Fig. 2). These locations are representative of small- and medium-sized towns as well as residential areas of large cities in northern and central Italy.
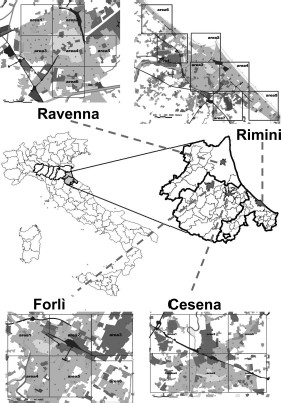
Location of the four study towns in the Emilia-Romagna region and subdivision into quadrants (sampling zones). Light gray and gray represent the residential areas, dark gray represent industrial and commercial areas, and black lines represents the road and train networks. The small gray dots indicate the ovitrap stations.
Vector Control Campaigns.
In all of the towns, a vector control program was carried out and included larval control in public catch basins according to a monthly program, using pyriproxyfen-based products in Cesena and diflubenzuron-based products in the other three towns. Their efficacy was monitored as follows: in pyriproxyfen-treated catch basins, pupae were sampled to assess its efficacy in preventing adult emergence; and in the diflubenzuron-treated catch basins, pupae were counted to evaluate its efficacy in killing immature stages.
In the towns where the CHIKV outbreaks occurred in 2007 (Ravenna, Rimini, and Cesena, within a radius of 300 m from the confirmed cases) a door-to-door control campaign was conducted in spring 2008. In addition, in Rimini four door-to-door campaigns were conducted during the summer, whereas in Ravenna a Bacillus thuringiensis israelensis-based product was offered free of charge to the citizens for the treatment of the private areas (www.zanzaratigreonline.it/CosafalaRegione/IlProgettodellaRegioneEmiliaRomagna).
Premises Survey Organization and Data Collection.
Each urban area was divided into six zones (Rimini into seven zones; Fig. 2), and 40 premises per zone and per session were randomly selected from a general list for inspection to detect active breeding sites. In case of an inaccessible private property, the inspectors moved to the next premises situated on the same side of the road. At the end of the survey session, the inspected premises were removed from the list, and new premises were randomly selected for the next one. The inspections were conducted by three teams, each composed of two skilled technicians equipped with Palmtop and global positioning system (GPS) for georeferencing of the surveyed sites and an aquatic net, plastic tray, and pipettes to sample the water bodies. When possible, the active breeding sites were removed; otherwise they were treated.
During the survey, the owner was asked how many people lived in the premises, to calculate the number of pupae per person. Each survey session was concluded within 2 wk.
Premises Condition Indices.
The premises were assessed according to the levels of two main parameters: the premises maintenance (PMI) and the premises shading (PSI).
The PMI evaluated the state of maintenance of the yard, according to the regularity of the gardening operations, such as cutting the grass, maintenance of the trees in good conditions, and the presence of abandoned potential water containers. Four levels were considered: 0, no green area or open courtyard was present; 1, the yard was well maintained with regular gardening operations and absence of abandoned potential water containers; 2, the yard was at an intermediate level of maintenance; and 3, the yard was badly maintained or abandoned.
The PSI provided information about degree of shading of the yard: 0, no garden or open courtyard was present; 1, the shaded area was up to 25%; 2, the shaded area was the 25–50% of the yard; and 3, >50% of the area was shaded.
Premises Container Typology.
For each inspected property data were collected concerning the house characteristics, the typology and number of artificial containers potentially acting as breeding sites, and the presence of water and of Ae. albopictus larvae and pupae. The containers were subdivided into 10 types: catch basins, plant saucers, drums (metal and plastic), buckets, tarpaulins, tires, bathtubs, generic containers with a volume <1 liter, generic containers with a volume of 1–10 liters, generic containers with a volume >10 liters.
Public Areas and Catch Basins.
During the survey sessions, teams also inspected public areas, where catch basins constitute the unique Ae. albopictus larval habitat in northern Italy. In public areas, the average spatial density was 7–19 catch basins per hectare, whereas in private properties it was 30–40 catch basins per hectare. Surveys were performed on a total of 3,317 catch basins (822 in Ravenna, 502 in Forlì, 663 in Cesena, and 1,330 in Rimini) by one team (two skilled technicians).
Sampling Technique.
During the inspections, both larvae and pupae were counted and classified for the calculation of the Stegomyia indices, whereas only the pupae were considered for PDS. Classification was performed in the field; when the result was doubtful, samples were examined by means of a stereomicroscope in the laboratory.
In small containers, the counting was performed by direct visual inspection. In the larger containers (catch basins, 1–50 liters; drums, 50–100 liters), immature stages were collected using an aquatic net (10 by 10 cm). In the catch basins, after the removal of floating materials, the water body was carefully explored using a net and all pupae were collected and put in a white pan with clear water for counting. In the catch basins with little water and/or lots of suspended material, a dipper (0.5-liter capacity) was used to sample the water, and the number of pupae was then multiplied by the estimated water volume contained in the catch basin. Colonized drums containing clear water for domestic garden irrigation were gradually emptied while filtering the water by using an aquatic net to collect all the larvae and pupae.
Number of Females.
Monitoring Egg Density With Ovitraps.
According to the Taylor equation, the number of ovitraps to be set in the four towns was 67 in Rimini, 87 in Forlì, 114 in Cesena, and 69 in Ravenna. The location of each ovitrap was set to ensure homogeneity in spatial distribution and standardization of the environmental conditions that influence the efficacy of the ovitrap itself (Williams et al. 2006); therefore, this task was performed by skilled technicians. By using Geographic Information Systems (ArcView, ESRI, Redlands, CA), each town was divided into a number of quadrants equal to the number of ovitraps needed. In each quadrant, one ovitrap was placed in an easily accessible shaded location, positioned on the ground with at least 1 m of free space above the trap. The ovitrap stations were georeferenced by GPS-equipped Palmtops and kept fixed throughout the entire season.
Each ovitrap consisted of a black plastic 400-ml pot with an upper diameter of 8 cm, filled to about two-thirds its height with ≈285 ml of dechlorinated water, including a substrate for egg deposition (strips of masonite, 12.5 by 2.5 cm) fixed to the trap with a metal clip. Each ovitrap was labeled with an identification code. Ovitraps were checked every 7 d, and the deposition substrate and water were replaced after cleaning the ovitrap's inside wall to remove any eggs. Masonite strips were then delivered to the provincial section of the Regional Agency for the Protection of the Environment for egg classification and counting.
For each town the mean egg density provided by the ovitraps was calculated. To assess the efficiency of the monitoring method, the relative variation (RV), the rate between the mean and the SE of the weekly egg density, also was provided.
Population Indices.
Five indices were calculated to provide synthetic information on the infestation level of Ae. albopictus at a single premises: HI (house index, percentage of houses with at least one infested container); CI (container index, percentage of infested containers); BI (Breteau index, number of infested containers per premises); PPI (number of pupae per premises); and PHI (number of pupae per hectare), which reflects the mosquito density per unit area, for both public and private domains.
Meteorological Data.
In all the four towns a meteorological station of the Emilia-Romagna region was present (CLINUR net, www.arpa.emr.it) and the following weather parameters were registered: wind speed at 10 m from ground level, relative humidity (minimum, maximum, and average daily mean), air temperature at 2 m from ground level (minimum, maximum, and average daily mean), and daily rainfall (millimeters per day).
Statistical Analyses.
The total number of catch basins, the number of infested catch basins, and the number of larvae, pupae, or both found in the four towns were analyzed by means of one-way analysis of variance (ANOVA).
The effect of PMI and PSI on HI (considering the average HI of each zone), BI, and PPI were analyzed by one-way ANOVA. The differences in the PMI and PSI as a function of the town were analyzed by one-way ANOVA.
Two-way ANOVA was used to analyze the PPI depending on the town and container capacity, and in relation to the interaction between PMI and PSI, for which we considered only the data collected in houses with open areas.
Percentage data were submitted to angular transformation before analysis. The Newman–Keuls multiple comparison test was used for mean comparison. Data also are presented as mean ± SD; different letters are used in text and tables to indicate statistically significant differences among the means.
For each town and sampling data, the Stegomya indices, PPI and PHI were calculated and correlations were analyzed by means of the Pearson product number: 1) among all population indices considered in the study; 2) between the population indices and the mean egg density per ovitrap per week obtained during the week before, the same week, and the week after the inspection; 3) between the number of females (calculated from the number of pupae using the Focks model) and mean egg density in the ovitraps; and 4) between the female per egg rate and the weather factors during the week after the inspection.
Results
Cumulatively in the four towns, 2,919 premises (97.3% of the premises randomly selected from the initial list) were inspected (Table 1), and the colonized containers as well as all those potentially serving as larval habitat (all containers with water or empty but exposed to the rain) were classified. In total, 27,836 containers were counted, 8931 of which (32.1%) contained water. Mosquito larvae and pupae were found in 1583 containers, equal to 17.7% of those with water or 5.7% of the total number of potential habitats (Table 2).
Descriptive data of the four towns
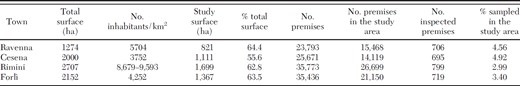
Descriptive data of the four towns
Data collected during the survey
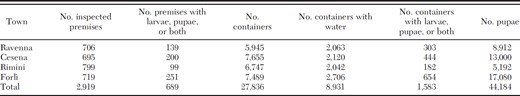
Data collected during the survey
According to interviews with the owners during surveys of the premises, the average number of person living in each inspected premises was 9.11 ± 21.96. The average inspection time for one premises was 1.35 h, whereas the average time for the inspection of a public catch basin was 0.5 h.
During the period of study (weeks 23–36) in the four urban areas, significant differences were found in the average daily wind speed measured at 10 m height (F3, 388 = 96.93; P < 0.0001) and relative humidity (F3, 388 = 12.23; P < 0.0001). Cesena had the highest wind speed (3.15 ± 0.55 m/s) and the lowest relative humidity (51.38 ± 10.95%), whereas Rimini had the lowest wind speed (2.07 ± 0.39 m/s) and the highest relative humidity (58.90 ± 9.88%). No significant differences were observed in the mean temperature (24.57 ± 2.92°C) and daily rainfall (0.82 ± 3.20 mm/d) among the four towns. The trends of the main meteorological data for each town are shown in Fig. 3.
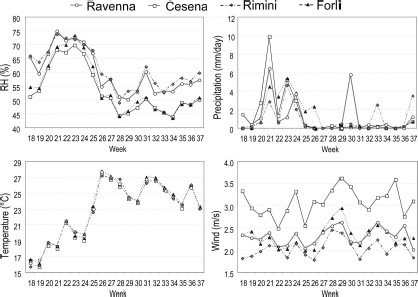
Trends of the main meteorological parameters registered in the four towns during the study period.
There were green areas or yards in a majority of surveyed premises (N = 2521; 86.4% of the total inspected premises), and many of them (N = 689; 23.6%) hosted at least one active Ae. albopictus breeding site.
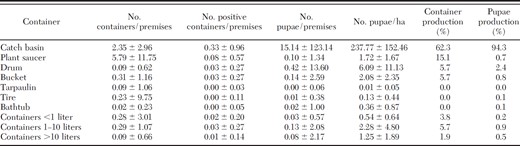
The most common container types found were plant saucers (60.7%) and private catch basins (24.7%), followed by buckets (3.3%), other medium-capacity (1–10 liters) containers (3.1%), low-capacity (<1 liter) containers (2.9%), abandoned tires (2.4%), drums (1.0%), tarpaulins and high-capacity (>10 liters) containers (0.9%) and bathtubs (0.3%). Their contribution in the premises' infestation is reported in Table 3.
Pupae productivity of the different types of containers
Pupae productivity of the different types of containers
Private Catch Basins.
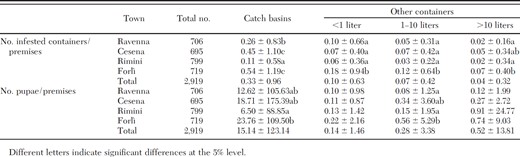
In total, 6,874 private catch basins were inspected in the four towns; 70.9% of them contained water, and 14.1% hosted larvae and/or pupae (15.14 ± 123.14, on average). Significant differences were found among the towns in the mean number of infested catch basins per premises (F3, 2,915 = 30.78; P < 0.0001) (Table 4) and in their relative pupae productivity (F3, 2,915 = 2.78; P < 0.04).
Results of the catch basin and container (categorized according to volume) inspection in the 2,919 premises (mean ± SD)
Results of the catch basin and container (categorized according to volume) inspection in the 2,919 premises (mean ± SD)
Other Containers.
For container types other than catch basins, the average number of infested containers per premises was 0.21 ± 0.99 and the total number of pupae per premises was 0.94 ± 14.62. If all the containers types are grouped according to capacity categories, 85.7% had a capacity <1 liter, 11.5% a capacity of 1–10 liters, and 2.8% >10 liters. The two-way ANOVAs considering the towns and container capacity as main factors showed a significant difference in the number of pupae per premises among the four towns when considering medium-capacity water containers (1–10 liters), whose contribution to the number of pupae per premises was lower in the two tourist towns, Rimini and Ravenna, with respect to the others (F3, 2,915 = 2.92; P < 0.03) (Table 4).
Public Catch Basins.
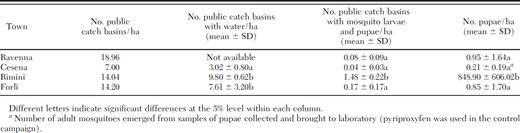
The density of public catch basins was lower in Cesena than in the other three towns, and the number of catch basins with water per hectare was lower in Cesena than in Forlì and Rimini (F2, 6 = 9.60; P < 0.02) (Table 5). The percentage of infested catch basins was very low in Ravenna, Cesena, and Forlì (0.4, 0.6, and 1.2%, respectively), whereas this value was 10.5% in Rimini. In fact, the number of infested catch basins per hectare and the number of pupae per hectare were significantly higher in Rimini than in all the other three towns(F3, 9 = 65.02; P < 0.0001 and F3, 9 = 6.78; P < 0.02, respectively) (Table 5).
Density of public catch basins, catch basins with water, and infested catch basins and their productivity
Density of public catch basins, catch basins with water, and infested catch basins and their productivity
Effect of Premises Maintenance and Shading.
PMI. Only 13.6% of the properties had no green area or an open courtyard (PMI = 0), 66.3% had well-maintained green areas (PMI = 1), 15.9% presented a medium level of maintenance (PMI = 2), and only 4.2% of the green areas were in bad condition or abandoned (PMI = 3). Differences emerged in the mean level of maintenance as a function of the town (F3, 2,915 = 12.13; P < 0.0001), with a significantly higher PMI (i.e., higher percentage of badly maintained green areas) in Forlì (1.23 ± 0.74a) with respect to the other study towns (Ravenna, 1.04 ± 0.64b; Rimini, 1.07 ± 0.66b; and Cesena, 1.08 ± 0.63b).
The HI in premises without a yard (PMI0, 2.30 ± 8.87a) was significantly lower with respect to all the three categories of maintenance. Between the optimal and the medium level of green area maintenance, no significant difference was found in the HI (PMI1 = 25.04 ± 15.82b and PMI2 = 31.60 ± 28.62b, respectively), whereas the badly maintained or abandoned ones showed a significantly higher HI (PMI3 = 47.48 ± 37.23c) (F3, 262 = 36.96; P < 0.0001).
Significant differences were found in the BI according to the level of maintenance of the open area (F3, 2,915 = 67.83; P < 0.0001), with the lowest value found, as expected, in the premises without green areas (PMI0 = 0.02 ± 0.21a) increasing with the decrease of the maintenance level (PMI1 = 0.50 ± 1.21b; PMI2 = 0.78 ± 1.62c; and PMI3 = 1.96 ± 3.42d).
The ANOVA showed that the PPI in premises without a yard (PMI0 = 0.22 ± 2.90a) was not different from the PPI found in courtyards with optimal maintenance (PMI1 = 16.86 ± 127.16ab) and medium maintenance (PMI2 = 20.71 ± 117.62ab), whereas it was significantly lower with respect to the premises with badly maintained green areas (PMI3 = 37.67 ± 126.62b) (F3, 2,915 = 3.66; P < 0.02).
PSI. In 48.30% of the properties, green area was shaded for <25% of its extension (PSI1), in 33.13% the shaded area was in the range 25–50% (PSI2), and only in ≈4.93% of the inspected premises the shading covered >50% of the green area (PSI3). Significant differences were observed in the BI among the three shading categories (F3, 2,915 = 23.72; P < 0.0001) and in the HI between PSI1 and PSI3 (F3, 260 = 28.84; P < 0.0001). The PPI was higher in the highly shaded premises (PSI3, 52.71 ± 396.39 pupae per premises) with respect to other shading levels (PSI1, 16.15 ± 93.86 pupae per premises, PSI2, 17.05 ± 100.32 pupae per premises) (F3, 2,915 = 6.40; P < 0.001). As expected, the premises without a yard showed the lowest mosquito density irrespective of the index used to describe it.
Interaction between PMI and PSI. When premises maintenance and shading were considered as main factors for assessing the influence on the mean number of pupae per premises in houses with open areas, the two-way ANOVA revealed a significant effect for the PSI (F2, 2,512 = 3.09; P = 0.046) but not for the PMI (F2, 2,512 = 1.17; P = 0.31) or for the interaction between the two (F4, 2,512 = 0.52; P = 0.72). Thus, the shading conditions played a significant role in favoring pupae productivity irrespective of the level of maintenance of the premises' open areas.
In particular, the mean number of pupae per premises in the badly maintained green areas was 24.63 when the shaded area was limited, 41.80 in intermediate shading conditions, and 80.07 when the shaded area was much extended (Table 6). This last category of highly productive premises, showing the optimal conditions for the development of Ae. albopictus, represented only 0.6% of total inspected premises.
Number of containers with water, positive containers, and pupae per premises in relation to level of maintenance and shading of green area or open courtyard
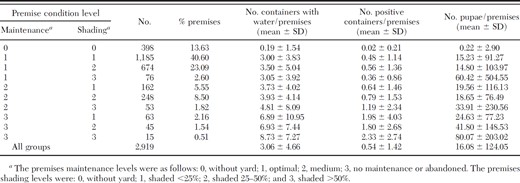
Number of containers with water, positive containers, and pupae per premises in relation to level of maintenance and shading of green area or open courtyard
Egg Density Estimation.
In Fig. 4, the weekly mean number of eggs per ovitrap collected in the study towns by the Regional Monitoring Program together with the RV coefficient are reported. As normally happens in temperate regions, the seasonal pattern was a bell-shaped curve starting at week 22, peaking during weeks 27–37, and ending at week 45. The RV coefficient of the mean egg density in the summer period (weeks 26–35) was between 0.08 and 0.18, indicating good efficiency of the monitoring system (Southwood and Henderson 2000).
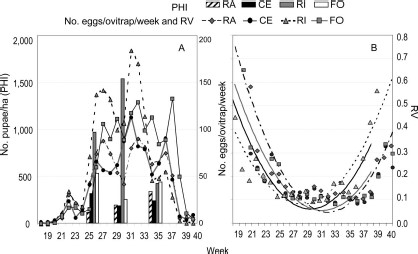
(A) Weekly trend of the mean number of pupae per hectare (PHI) and of the mean number of eggs per ovitrap. (B) Weekly trend of the relative variation coefficients of the mean number of eggs per ovitrap.
Immature Population Estimation: Indices Analyses.
As shown in Table 7, all the premises population indices in the four towns seemed to be highly correlated with one to another but not with the PHI (number of pupae per hectare found in private and public areas). A correlation analysis was run between each population index and the mean number of eggs per ovitrap laid, respectively, in the same week of the premises inspection, in the week before the inspection, and in the week after the inspection (Table 8). The analysis showed a strong correlation (R2 = 0.74; F1, 10 = 28.96; P < 0.001) only between the PHI and the mean number of eggs collected by the ovitraps during the week after the inspection.
Pearson product moment correlations (R) among Ae. albopictus population indices
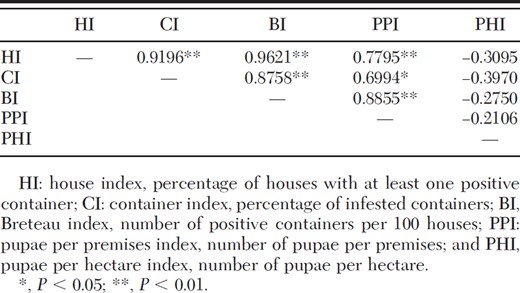
Pearson product moment correlations (R) among Ae. albopictus population indices
Pearson product moment correlations (R) between mosquito pop indices and mean number of eggs per ovitrap per week collected the week before, the same week, and the week after the inspection
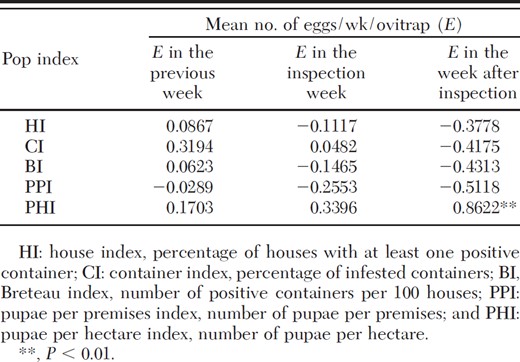
Pearson product moment correlations (R) between mosquito pop indices and mean number of eggs per ovitrap per week collected the week before, the same week, and the week after the inspection
Relationship Between Female Population and Egg Density.
We found a significant correlation between the number of adult females per hectare and the mean number of eggs collected in the ovitraps 7–14 d after the inspection (R2 = 0.62; F1, 10 = 16.37; P < 0.003).
The mean females per egg rate (RFE) was 1.22 ± 0.65 (95% CL = 0.81–1.63). The variability of RFE was partially influenced by weather factors, as the Pearson product-moment correlation analysis revealed positive correlations between RFE and relative humidity (min. relative humidity: R = 0.71, P < 0.01; mean relative humidity: R = 0.74, P = 0.007) and between RFE and atmospheric pressure (R = 0.66, P < 0.02). The wind seemed to reduce RFE (R = −0.54, P = 0.07), thus increasing the efficiency of the ovitraps. Furthermore, the number of eggs laid in the ovitraps did not influence RFE (R = 0.26, P = 0.42) (no superoviposition effect).
The stepwise regression analysis (R2 = 0.86; F2, 9 = 28.64; P < 0.001) showed that the number of females estimated through the PDS was correlated with the number of eggs laid in the ovitraps and with relative humidity. According to the equation in Table 9, an increase in the relative humidity seemed to result in a decrease in the number of eggs laid in the ovitraps, reducing the efficacy of the ovitraps as a monitoring method.
Values of significant effect in the stepwise regression
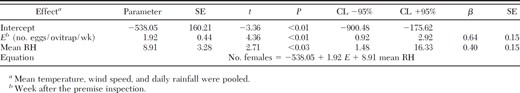
Values of significant effect in the stepwise regression
Discussion
The catch basins in central and northern Italy are fundamental for the drainage of rainwater. They are always present in private building areas and usually occupy both sides of the roads at a distance of 10–20 m one from each other. During the summer, rainfall can easily reach 50 mm/h/m2, and each catch basin collects and sends to the sewer system >1,000 liters/h. During the drier parts of the year, stagnant water in the catch basins could be used by mosquitoes for breeding. Indirect proof that catch basins constituted the most diffused and productive breeding sites for Ae. albopictus is in our finding that the females per egg rate did not seem to be affected by the presence of competitive breeding sites of any dimension, in any of the studied urban areas. Catch basins (both in public and private areas) produced 96.9% of the pupae, followed by drums (2.6%), buckets (0.9%), and medium containers used in vegetable gardens for irrigation (0.8%).
The courtyards and green areas were generally well maintained, and only 4.1% seemed poorly maintained or abandoned. In the latter premises category, we found the highest number of pupae per premises (37.67 ± 126.62), particularly in those with high shade coverage as well (on average 2.33 ± 2.74 positive containers per premises with 80.07 ± 203.02 pupae per premises). In all the other premises with optimal or medium maintenance levels, an average of 0.48 ± 1.23 active containers per premises was found, with a mean density of 15.13 ± 123.87 pupae per premises. A good level of maintenance of private and public green areas reduced the number of water containers in competition with the ovitraps as larval habitats to very low numbers (0.2 active containers per premises, catch basins excluded), concentrated in restricted areas.
In our study region, the most widely used Stegomyia population indices (HI, CI, and BI) applied to Ae. albopictus seemed well correlated one to another, in agreement with the data obtained by Tun-Lin et al. (1996) for Ae. aegypti. However, we found no correlation between the Stegomyia indices and the PHI (number of pupae per hectare), another indicator of adult density that Focks and Chadee (1997) considered reliable for estimating of Ae. aegypti adult density in Trinidad. This finding can be explained by the fact that the Stegomyia indices only consider the larval habitats within each premises, whereas PHI depends on the number of pupae found in both public and private areas, and in Italy the public catch basins represent the most uniformly diffused larval habitat and significantly affect the mosquito population density.
We obtained a highly positive correlation between the PHI and weekly mean of eggs per ovitrap collected 7–14 d after the inspection. This is in agreement with the model developed by Vallorani et al. (2010), who estimated that females that emerged from the sampled pupae should be ready to lay eggs 8–11 d later.
Many studies on mosquito female oviposition behavior have been conducted on Ae. aegypti, and several reports stated that this species is characterized by superoviposition and skip-oviposition behaviors. In particular, the number of eggs laid is influenced by the presence of conspecific eggs, container diameter, container volume and water surface (Apostol et al. 1994, Chadee 2009). The distribution and availability of competitive artificial containers modify the Ae. aegypti female oviposition behavior in ovitraps, thus influencing the relationship between the number of females and the number of eggs in the ovitraps, as described by Focks (2003), Harrington et al. (2008), and Chadee (2009).
According to our findings, which are in agreement with Allan and Kline (1998) and Carrieri et al. (2009), in Ae. albopictus the females per egg rate did not seem to be influenced by the egg density. In addition, we found a positive correlation between the PHI and mean egg density in the ovitraps, probably due to the lack of superoviposition behavior; if the number of females and number of eggs did not vary depending on the latter, then the number of eggs does not attract ovipositing females.
The uniform distribution of the most productive larval habitats (catch basins) and the lack of superoviposition behavior allowed the establishment of a correlation between the PHI (based on the PDS of public and private properties) and the number of eggs collected 7–14 d after the PDS. In our study, the RFE was 1.22 ± 0.65. The most important consequence of this relationship is that the egg density data provided by the ovitraps can be used to determine the mean number of females per unit area.
We must note that the PDS value calculated in our study underestimated the number of females per hectare, because it did not consider the overlap between mosquito generations. If we hypothesize that the total number of females developed during the 2 wk preceding the sampling is proportional to the number of eggs sampled at day 14 and considering a mean daily survival of 0.82 (Otero et al. 2006), RFE increases to 1.57 ± 0.77.
Weather factors can affect the availability of larval habitats. High temperature regimes increase water evaporation, thus reducing the number of containers with water available for oviposition, whereas rain and high relative humidity favor the presence of water in small containers (Favier et al. 2006). Despite that in Italian urban areas most of the catch basins (the main larval habitat for Ae. albopictus) always contained water, a relationship was found between weather parameters and the number of females per egg. Over the course of our study, RFE was 1.40 ± 0.77 in June (mean RHmin = 42.0%; mean tmin = 18.0°C) and 0.99 ± 0.72 in July (mean RHmin = 30.2%; mean tmin = 20.2°C), increasing to 1.23 ± 0.27 in August (mean RHmin = 31.7%; mean tmin = 20.1°C). If we take into consideration the overlap among mosquito generations, the estimated RFE in the same periods were, respectively, 1.65 ± 0.84, 1.28 ± 0.87, and 1.74 ± 0.36. We hypothesize that humidity affected the gravid females' behavior, allowing for the exploitation of reproductive sites located in less shaded areas when the humidity level increases. In conditions of low relative humidity, females laid more eggs in the ovitraps because they spent more time in the shaded areas where the ovitraps were placed. Thus, our findings suggest that to increase the reliability of the monitoring system and to reduce the seasonal variability of the RFE value, it would be useful to place ovitraps in partially sunny locations as well.
In the public catch basins, control interventions against the larvae were conducted in all four towns, but with different results. In Ravenna, Cesena, and Forlì, the efficacy was high (as shown by the low frequency of infested catch basins), whereas Rimini showed the lowest efficacy (Table 5). Controlling the quality of catch basins treatments (i.e., the efficacy and the timing of execution), especially in shaded areas under trees along the roads (as found in Rimini), is crucial to reduce the mosquitoes population.
Concerning the private properties, our experience shows that the door-to-door campaigns repeated several times during spring and summer significantly reduced the number of pupae per premises. Making available control products free of charge at distribution points in the towns was less effective, but this strategy would be acceptable in years and periods when no epidemic occurs. In fact, if we compare the mosquito population of Rimini (five door-to-door control campaigns: one in the spring, four in the summer), Ravenna (one door-to-door control in spring and the offer of free larvicide to the citizens during summer), and Cesena (only one door-to-door control in spring) with that of Forlì (no control campaign in the private areas), we see that the percent reduction of the mosquito population with respect to that of Forlì was 72.7% in Rimini, 46.9% in Ravenna, and 21.3% in Cesena (data calculated from Table 3).
The correlation between the PDS and ovitrap data also might be related to the specific seasonal dynamic of Ae. albopictus population in temperate regions, showing a bell-shaped curve with a conspicuous increase of the population densities during the summer months followed by a dramatic decrease during the autumn-winter, with only a small portion of the population overwintering as eggs. In Italy, the Ae. albopictus life cycle in public catch basins is highly discontinuous and depends primarily on rainfall and the amount of water used to clean the roads (which differs from town to town). Therefore, the number of pupae sampled in these larval habitats is strongly influenced by the timing of sampling in relation to rains and road cleaning. If the sampling is carried out after a rainstorm, a few pupae and many positive containers are likely to be found. However, if the sampling is carried out 5–7 d after heavy rainfall or a road cleaning, we would collect many more pupae. This aspect increased the variability of data obtained through the PDS in public areas. In the private areas, the variation of water volume in containers is less dependent on daily rain than in public areas, and the mosquito life cycle is highly dependent on human activities, such as irrigation, car washing, and other water-consuming activities.
We found a very low and nonsignificant negative correlation between the PHI (which considers the pupae production in public and private areas) and the other indices (which consider only the pupae produced in private areas). This finding might be due to the presence of water in the public catch basins being mainly caused by heavy rains, whereas in the private catch basins it is mainly related to irrigation, which occurs more frequently during the dry periods. This discrepancy is even more evident because the population indices are calculated based on a PDS, which is a discontinuous sampling method whose results largely depend on the timing of sampling with respect to egg hatching. Therefore, local factors can highly influence the water availability in both public and private catch basins, and in this sense both Rimini and Forlì are outliers. If Rimini were excluded from the analysis, the correlation between data collected through PDS and ovitrap monitoring would not be confirmed, whereas if Forlì were excluded the correlation level would be even higher. The current study has been planned in these very different four towns just to compensate for these contrasting tendencies.
The PDS is a reliable system for estimating the adult population of Ae. albopictus. However, considering the peculiar characteristics of breeding sites in northern and central Italy, its adoption as a monitoring method could be extremely costly, because the inspection of a representative sample of the main reproductive sites (Morrison et al. 2004), namely the catch basins, would be very time consuming.
Even if there is some risk of diffusion of the CHIK and dengue viruses in Italy and southern Europe—as the recent CHIKV epidemic (in Italy in 2007) and the dengue cases (in France and Croatia in 2010) showed—the conventional strategies of control seem too costly and the efficacy might prove insufficient without tight and continuous monitoring of the control measures. Based on the findings of this study, the Regional Plan for Tiger Mosquito Control and the prevention of CHIKV and dengue fever in 2010, in the absence of cases of diseases, planned to invest available economic resources in: periodic larvicidal treatment of public catch basins; quality control of the disinfestation activities; distribution of larvicidal product to citizens; and public education and awareness-raising programs aiming to improve the management of mosquito population in private areas.
Monitoring by means of ovitraps constitutes an economically sustainable method to estimate the mosquito population density in a risk assessment plan. The results of our study show it is possible to shift to a monitoring program based on weekly (or biweekly) checks of the number of eggs laid within a network of ovitraps. Carrieri et al. (2011) showed that it is possible to set up large-scale ovitrap-based monitoring programs that would significantly reduce the financial investment, allowing continuous data collection throughout the reproductive season. The following paper in this series describes the determination of a risk threshold for CHIKV based on the mean egg density in ovitraps.
Acknowledgments
We thank Fabrizio Balestrino, Francesco Colosio, Marco Fiammenghi, Rocco Iezzi, Simona Maccaferri, Daniele Porretta, and Samanta Puggioni for the hard work in field data collection; the Municipalities of Cesena, Forlì, Ravenna, and Rimini for organizational support; and the Public Health Departments of Cesena, Forlì, Ravenna, and Rimini for assistance in data processing. The research was funded the Italian Ministry of Health and managed by the Health Agency of Emilia-Romagna Region through grant RFPS-2007-7-639191.
References Cited
