


Abstract
Mosquito species abundance and composition estimates provided by trapping devices are commonly used to guide control efforts, but knowledge of trap biases is necessary for accurately interpreting results. We tested the hypothesis that commercially available traps (Mosquito Magnet-Pro, the Mosquito Magnet-X) would be significant improvements over the CDC Miniature Light Trap with respect to abundance, species diversity, and measures of recruitment in a wooded area of the Bronx Zoo in New York City, NY. The Mosquito Magnet-Pro collected significantly more mosquitoes (n = 1,117; mean per night, 124 ± 28.3) than the CDC Miniature Light Trap (n = 167; mean per night, 19 ± 5.5). The Simpson’s diversity index was greatest for the Mosquito Magnet-Pro. A CDC light trap from a simultaneous surveillance project was located 15 m away and used as a control trap to test for significant differences in mosquito counts on nights with or without the experimental traps. There were no significant differences between nights, indicating the test traps did not recruit beyond 15 m. The traps differed significantly in abundance, but they had similarly limited sampling areas. Measured differences in abundance were independent of differences in diversity. This study highlights how differences between traps might affect species abundance and composition estimates.
Mosquito species abundance and composition estimates can be used to target disease prevention efforts by providing information regarding the spatial distribution of vector species. Trapping, as a means to monitor mosquito populations, is an integral component of surveillance efforts, yet standard techniques for interpreting the results are lacking (Downing 1976, Jensen et al. 1994). Trap design (e.g., Counterflow, downdraft), placement (e.g., height above ground, time of day), location (local environment, habitat specificity of mosquito), and use of attractants (e.g., light, CO2, octenol) influence mosquito abundance estimates (Kline 1999, Mboera et al. 2000, Burkett et al. 2001, Anderson et al. 2004). These factors affect the species, number, and reproductive status (parity) of mosquitoes captured (Reisen et al. 1999, 2000; Mboera et al. 2000). Knowledge of trap biases is essential when deciding what traps to use, where they are to be deployed, and how to interpret the results. Recognition of these biases is especially important when modeling mosquito species distributions and designing mosquito-borne disease surveillance programs.
In this study, we tested the hypothesis that commercially available traps would show significant differences from a standard surveillance trap with respect to differences in abundance, species diversity, and measures of recruitment. Species abundance is the most commonly reported trap attribute. However, understanding the mosquito species community composition is more complex than basic species abundance measures such as richness. Therefore, this study also evaluates species diversity among the three trap types. Finally, the study tests whether results can be explained by active recruitment of mosquitoes to the collection site or if traps capture mosquitoes that are fortuitously present at the trap site. The findings presented here are salient when collecting and interpreting mosquito surveillance data. These additional facets of surveillance trap data are germane to modeling mosquito species distribution and abundance.
Materials and Methods
This study of trap effectiveness was nested in a larger surveillance study occurring at the Bronx Zoo in New York City, NY, in collaboration with the Wildlife Conservation Society. In the larger study, 12 CDC Miniature Light Traps (MLT) were evenly distributed over the park to target mosquito control efforts during a West Nile virus (family Flaviviridae, genus Flavivirus, WNV)epizootic and to evaluate results. The Bronx Zoo is a 107-ha (265-acre) island of deciduous forest situated in New York City along the Bronx River.
This project used the larger study’s trapping infrastructure to compare two commercially available traps to the MLT. The American Biophysics Corporation (North Kingston, RI) markets the Mosquito Magnet as effective control devices for professional and home use. Here, we evaluate how the Mosquito Magnet-Pro (MM-Pro) and its prototype Mosquito Magnet-X (MM-X) compare with the standard MLT with respect to abundance, species diversity, and area of recruitment.
The traps were run at three sites located 15 m equidistant on 9 d between 3 August and 24 August 2000. Traps were systematically rotated between the three sites each night to control for the effect of site. All study sites were located in a continuous deciduous forest with similar ground and canopy cover. One of the surveillance MLTs ≈15 m from the experimental locations was used as a control for the recruitment range comparison.
Traps.
The MLT used is manufactured by Clarke Mosquito Control (Roselle, IL) based on the American Biophysics Basic Light Trap. This trap remains relatively unchanged since its 1962 inception (Sudia and Chamberlain 1962). It is powered by a 6-V, 10-ampere-h rechargeable gel-cell battery operating a 0.15-W light and a four-blade fan. The traps were suspended 1.5–2 m above the ground and baited with carbon dioxide provided by a 0.95 liter (1-quart) insulated flask filled with dry ice (Rudolfs 1922).
The MM-X trap differs from the MLT in that it does not use a light as an attractant and uses a different trapping mechanism, namely, Counterflow geometry. Counterflow is generated through the use of two fans simultaneously moving air in opposite directions (for details, see Kline (1999). In brief, a CO2-enriched plume is released through a center pipe by a motor-driven fan. This center pipe is surrounded by a wider tube through which air is sucked upward into the trap by a second fan into a wide plastic container to hold the mosquitoes attracted to the trap. For this study, the MM-X was baited with dry ice as with MLT and suspended between 1.5 and 2 m above the ground. Two serially connected 6-V, 10-ampere-h rechargeable gel-cell batteries were used to provide the required 12-V power source.
The Mosquito Magnet-Pro (MM-Pro) has a power head that catalytically converts propane into CO2, heat, and water vapor. These attractants are exhausted outside the trap through a center tube, similar to the MM-X, providing a plume of mosquito attractants. As with the MM-X, two fans work in opposition: one fan provides the exhaust plume of attractants; the other fan provides a counterflow updraft used to capture mosquitoes. It is a freestanding unit with an intake 52 cm above ground level and holds a 9-kg propane tank. In the Northeast, the manufacturer recommends using octenol as an additional attractant, but it was not used for this study to facilitate direct comparisons among the traps.
Traps were set between 8:00 a.m. and 9:00 a.m. with dry ice, propane, fresh batteries, and collection units as necessary. Collections of mosquitoes were recovered 24 h later, frozen on dry ice, and transported to the laboratory in New Haven, CT. Mosquitoes were identified to species using an Industrial Inventions Inc. (Monmouth Junction, NJ), model 1012 electronic chill table under a 10-40× zoom dissection microscope, and then they were frozen at -70°C for later virus isolation as part of a WNV surveillance and control program. Damaged mosquitoes that could not be identified to species were identified to genus when possible or placed into an unidentified class and excluded from this analysis. These exclusions did not significantly differ across the three trap types (Pearson χ2 = 18.0, P = 0.324).
Data Analysis.
Count data were tested for normality and transformed using log(count + 1). Differences in abundance were tested by comparing the total number of mosquitoes per trap using Bonferroni analysis of variance (ANOVA) and SAS version 8 software (SAS Institute 2002). The analysis compared trap and site specific differences.
where n is the total number of a particular species (i), and N is the total number of individuals (in this case per trap type).
This index measures the probability that two specimens from a sample will be different species. Simpson’s diversity index increases in value as species diversity increases. It is sensitive to the numerical abundance of dominant species (Magurran 1988).
Recruitment range was evaluated to assess whether the experimental traps were attracting mosquitoes from >15 m by comparing counts for the control trap (15 m from the test sites) on the nine test nights to the seven intervening nontest nights. This comparison was conducted using the total mosquito count and by the combined Aedes/Ochlerotatus species total count and Culex species total count using Kruskal-Wallis test (χ2 approximation) and compared with Wilcoxon rank sum test.
Results
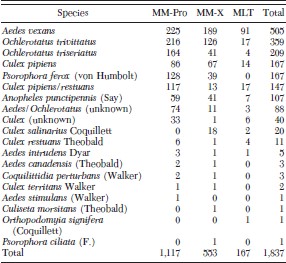
Over the 27 trap nights, 1,837 female mosquitoes were collected, representing 16 species (Table 1). Aedes vexans (Meigen) was found in the greatest number for all traps (27% of all mosquitoes trapped; range 20-54%), followed by Ochlerotatus trivittatus (Coquillett) (20%, range 10–23%), Ochlerotatus triseriatus (Say) (11%, range 2–15%), and Culex pipiens L. (9%, range 8–12%). Although the total number of mosquitoes collected was not particularly large, it is the result of an operational mosquito surveillance program during a WNV epizootic; therefore, it is representative of an operational application of these traps.
Mosquito species collected during trap nights
Mosquito species collected during trap nights
Abundance.
The MM-Pro collected the greatest number of mosquitoes (n = 1,117; mean per night, 124 ± 28.3), followed by the MM-X (n = 553; mean per night, 61 ± 22.7), and the MLT (n = 167; mean per night 19 ± 5.5) (Fig. 1). The ANOVA measure for multiple comparisons showed significant differences in count between the MM-Pro and MLT (ANOVA: F = 15.76, P < 0.01), but not the MM-X. There were no differences when evaluating count by site (ANOVA: F = 0.23, P = 0.90) (Fig. 2). This lack of difference indicates the trap, not the location of the trap, yielded significant differences in total mosquito counts.
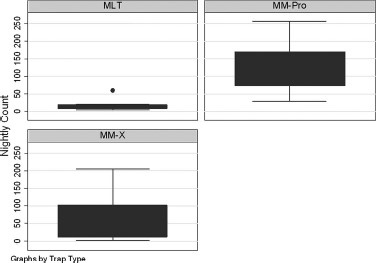
Box plot of the nightly counts by the three trap types: MLT (n = 167; mean per night, 19 ± 5.5), MM-X (n = 553; mean per night, 61±22.7), and MM-Pro (n = 1,117; mean per night, 124±28.3). There were significant differences in count between the MM-Pro and MLT (ANOVA: F = 15.76, P < 0.01).
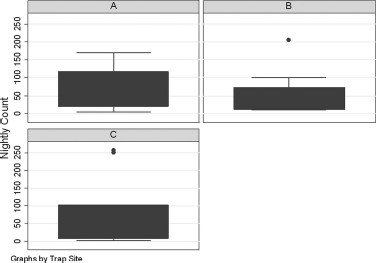
Box plot of the nightly counts by the three trapping sites shows there is not effect of the site on nightly count (ANOVA: F = 0.23, P = 0.90).
Species Diversity.
The MM-X collected the greatest total number of species (n = 14) followed by the MM-Pro (n = 12) and the MLT (n = 9). However, Simpson’s diversity index, which accounts for sampling in the estimation of diversity, was greatest for the MM-Pro (1-D = 0.87, 95% CI: 0.88–0.86) followed by the MM-X (1-D = 0.80, 95% CI: 0.82–0.78) and the MLT (1-D = 0.68, 95% CI: 0.75–0.60). Although the MM-X collected the greatest number of species (species richness), collections from the MM-Pro yielded the greatest measure of species diversity.
Recruitment Range.
Analysis of the attraction by experimental traps on total mosquito count by Kruskal-Wallis test (approximation) showed neither significant differences for the total catch comparison on test and nontest nights (Kruskal-Wallis = 0.06, P = 0.81), nor for the species group specific comparisons (Aedes/Ochlerotatus species, Kruskal-Wallis = 0.04, P = 0.85 and Culex species, Kruskal-Wallis = 0.24, P = 0.62). See Fig. 3 for box plot comparison of nontrap night and trap night counts. Likewise, analysis by Wilcoxon rank sum test indicated no significant difference in total count (Wilcoxon rank sum = −0.20, P = 0.85), Aedes/Ochlerotatus count (Wilcoxon rank sum = −0.15, P = 0.89) or Culex (Wilcoxon rank sum = 0.44, P = 0.65) on test compared with nontest nights. These results indicate that the test traps did not influence results from the surveillance trap located 15 m distant.
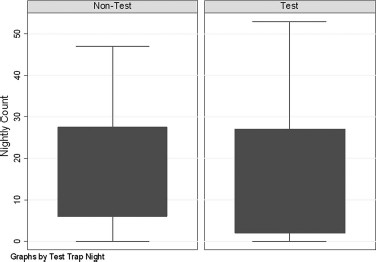
Box plot of count in the control trap for test versus nontest nights indicates no significant difference for the total catch comparison on test and nontest nights (Kruskal–Wallis = 0.06, P = 0.81).
Discussion
This study confirms that traps using Counterflow technology collect greater numbers of mosquitoes than standard downdraft traps (Kline 1999, 2002; Burkett et al. 2001). However, traps may be biased toward specific species (Huffaker and Back 1943, Acuff 1976). To understand the composition of the mosquito community this study also examined diversity. The findings support the importance of diversity measures as the trap yielding greatest species richness did not capture the greatest diversity of mosquitoes. These findings are important when comparing across different trap types because greater richness does not necessarily translate into greater diversity.
This study shows that all of the traps are spatially limited with reference to the information they provide about the local mosquito community. To detect what species occur and their relative abundances within an area, we would recommend using replicates of MLTs rather than relying on only one Magnet (MM-X or MM-Pro). Although one MLT may yield lower counts, multiple trap locations would offer similar abundance data but with greater spatial resolution. The loss with respect to species diversity might be with rare species and this would have to be considered. However, this duplicative sampling methodology may be more cost effective and would allow for sampling in multiple habitats. Regardless of the trap used, repetition of sites would improve the study design, create greater confidence in the information provided, and traps placed >15 m apart might be independent. An alternative would be to alter the CO2 output or the wattage of the light attractants, but we view this to be more difficult.
There is increasing use of spatial models to identify high-risk areas for mosquito-borne disease control (Barrera et al. 1999, Brownstein et al. 2003, Diuk-Wasser et al. 2006). With improvements in disease risk models and increasing use of these models to guide intervention efforts, appreciation of the unavoidable errors associated in parameter estimation become more important (reviewed by Liebhold et al. 1993, Rogers and Randolph 2003). Commenting on the information provided by mosquito light traps, Huffaker and Back (1943) stated “the trap is only one component of the picture.” Their 64-yr-old comment holds true today, and researchers must ensure that they address the biases inherent in the surveillance data collected. This study quantifies how differences in trap selected can alter the “picture” of mosquito abundance and diversity. Understanding the limitations of mosquito surveillance data is necessary to improve the accuracy of spatial models.
Acknowledgements
We thank the field collectors from the Yale School of Public Health, particularly Hilary Rosen and Karin Neidt, for work on the project. We also thank Annie Gatewood for helpful editing comments on an earlier version of this manuscript. We are especially grateful to the staff of the Wildlife Conservation Society for their cooperation and assistance. This project was supported by a contract from Wildlife Conservation Society and by a Cooperative Agreement (58–0790-2-072) from USDA/ARS to Yale University.
